The structure and kinematics of AGN
with ionization cones.
A.V.Moiseev, V.L. Afanasiev, S.N. Dodonov
Special Astrophysical Observatory , Nizhnij Arkhyz, Karachaevo-Cherkesia, 357147, Russia
V.V. Mustsevoi and S.S. Khrapov
Volgograd State University, Volgograd, 400062, Russia
Abstract
Results of 2D spectral observations for 4 Sy galaxies with ionization cones are presented. Images in the [OIII] line, velocity fields of the ionized gas, stellar velocity and velocity dispersion fields were obtained at the SAO RAS 6m telescope. Non-circular gas motions and Z-shaped emission filaments could be explained as helical waves located in the ionization cone. This waves are generated by the hydrodynamical instability due to the velocity break between galactic ISM and outflowing matter from the AGN engine. The axis of cone lies close to the direction of a nuclear mini bar.
1 Introduction
Many Seyfert galaxies have a cone-like morphology of Narrow Line Regions (NLRs). In present work we discussed the structure of galaxies with following observational features:
-
•
an axis of cone lies along the direction of a radio jet (Wilson&Tsevetanov,[1994]);
-
•
a multicomponent structure of the narrow emission lines (e.g. [OIII]) shows that some systems of the gas clouds with velocity difference more than present in this galaxies.
-
•
emission filaments have a Z(S)-shape or/and arcs-like (”strands”) structure;
-
•
a large gradient of the line-of-sight gas velocities presents in Z-shaped spiral. Blueshifted and redshifted components of the emission lines has a different location on the sky-plane in the emission cone.
We consider results of observations of the galaxies Mrk 3, Mrk 573, NGC 3516 and NGC 5252. For each object some models for understanding of a Z-shape morphology were proposed: complex of inclined and polar gaseous discs in NGC 5252 (Morse et al.,[1998]) and in Mrk 3 (Afanasiev & Sil’chenko, [1990]), bent bipolar outflow or precessed jet for NGC 3516 (Veilleux et al.,[1993]). Such structures are unstable with short live-time, or they should have very specific orientation relative to Earth observer, or an unusual power is required (for jet precessing on scale kpc). A new model of jet-cloud interaction for Mrk 3 (Rossi et al.,[2000]) also cannot describe a Z-shaped emission pattern in NLR.
2 The hypothesis.
First, we assume that observable Z-shaped structures of NLRs are tridimensional helical waves in the ionizations cone. These waves generated by the hydrodynamical instability due the velocity break between galactic ISM and a central outflowing. A collimated radio jet associated with direction of outflow and matches with the cone’s axis.
Second, we considered the orientation of the cone. The Unified Model of AGN assumes the presence of circumnuclear disk (torus) around the central engine which collimates a jet outflow and an ionized radiation. We propose to assume that torus orientation associated with a particular directions in a galactic body. In an easy axisymmetrical case this is direction of the rotation axis. All galaxies from our sample have a triaxial structures in central regions (Mrk 573 and NGC 3516 are double-barred galaxies, Mrk 3 and NGC 5252 have a probable central mini bar, see section 3.1 and 3.4). In triaxial gravity potential, there are three planes where stable orbits are possible: this planes are lying along its axis. Let us note that most stable orbits are located in the smaller dimensional plane, where rotation matter has a minimal angular moment. The gas in a galactic disk decelerates by bar and accumulates to the torus. A resulting radiation and outflowing cone will coincide with the angular momentum vector of the torus (along a major axis of the central bar 111Axon & Robinson([1996]) and Vila-Vilaro ([1995]) also argued that orientation of the circumnuclear torus due the vertical inner ILR in a secondary bar and alignment with its direction.).
3 Observations
The observations with Interferometer Fabry-Perot (IFP) for galaxies Mrk 3, Mrk 573, NGC 3516 and NGC 5252 were obtained at the SAO RAS 6m telescope in 1996-1998. Spectra of the [OIII] emission line were obtained with a spectral resolution and a spatial resolution 15-2′′. Mkn 3 and NGC 5252 were also observed with integral field spectrograph MPFS in 1999-2000. A spectral range was and , a spectral resolution and spatial data sampling in field-of-view. A cross-correlation method (Tonry&Davis,[1979]) used for stellar velocity and velocity dispersion measurements. For Mrk 573 and NGC 3516 we used already published MPFS-data (Afanasiev et al.,[1995]; Afanasiev&Vlasyuk,[1995]) with similar spectral and spatial resolutions.
We fit the observable Z-shaped emission arms in easy assumption of a helical log-scale spiral on a cone’s surface. The axis of the cone was setting near the galactic plane and projected on the sky-plane in alignment with radio jet direction. The fitting results are shown together with n [OIII] images and velocity fields (Fig. 1-4)
If blueshifted and redshifted parts of the helical spiral lie along a line-of-sight then a mutlicomponent structure of emission line will be presented.This fact also was taken in consideration.
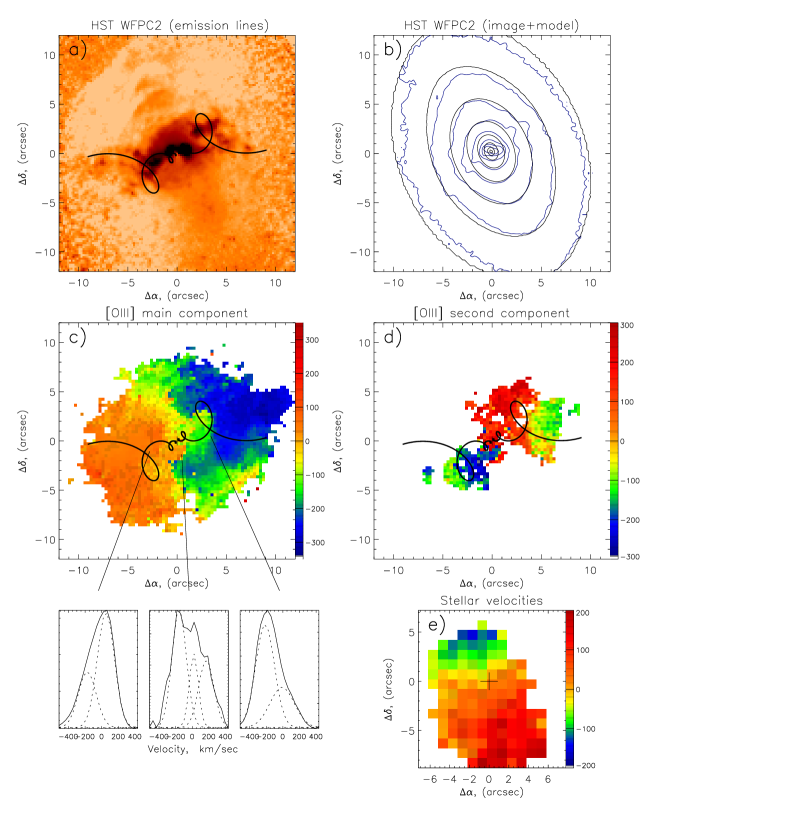
3.1 Mrk 3 (S0, Seyfert 2)
The NLR has a bi-conical structure which extended more than ( kpc), elongated in (Pogge&De Robertic,[1993]) and shows a Z-shaped structure on HST-images ( see Fig. 1a and Capetti et al., [1995]). The analysis of the stellar velocity field shows that PA of a kinematical major axis shifted on relative the photometrical in . This discrepancy relates with a oval orbit distortion due to the large-scale bar with . We fit the HST image by a 2D model (oblate spheroid+disk+Ferrer’s bar, Fig. 1b). A small-scale bar may be also presents in this galaxy (Capetti et al., [1995]) with and .
The profiles of the [OIII] line in IFP-data demonstrate a multicomponent structure (Fig.1c) in agreement with long-slit data by Afansiev&Sil’chenko([1990]). The distance between components is . A kinematical axis in the velocity field of main (brightest) component turns away from the stellar axis more than . A velocity gradient along the helical spiral is presented in . The second component of the [OIII] profile also shows non-circular motions located in the helical structure only. This component has inverse velocities in comparison with the main component of the emission line profile (Fig. 1d). In the third (low-brightness) component of the [OIII] line is presented and corresponds to the stellar motions in the large-scale bar.
From the helical fitting we obtained an estimation on the ionized cone open angle , and the inclination angle to the galaxy plane .
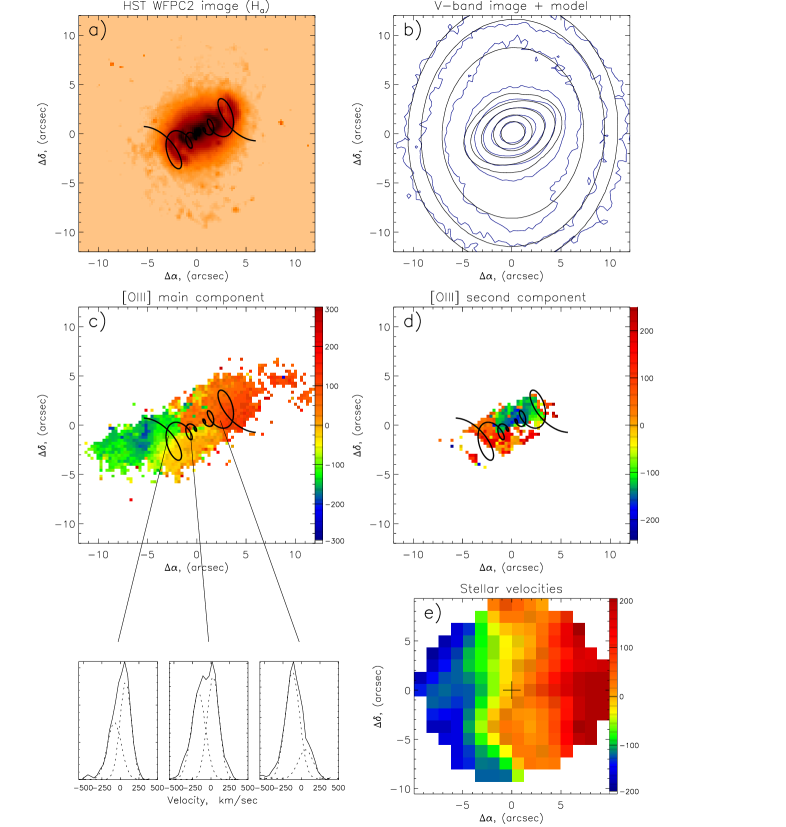
3.2 Mrk 573 (SAB0, Seyfert 2)
The NLR elongated in and extended at ( kpc, Wilson&Tsvetanov,[1994]). This shows an arc-like and Z-shaped bi-conical structures on ground-base and HST emission line images (Fig. 2a and Ferruit et al.,[1999]). The optical image of the galaxy can be fitted in double-barred assumption with lengths of bars and (Fig. 2b, and Moiseev,[1998]). The secondary bar () distorts the stellar velocity field (Fig. 2e) in . The [OIII] line in has a double-component profile (Fig. 2c) with separation in agreement with previous 2D spectroscopy study (Afanasiev et al. [1995]). The main component shows the strong non-circular motions with in amplitude. The second component locates near the cone’s axis and demonstrates an invert sign of the velocities (Fig. 2d). Note that Ferruit et al.([1999]) carried out a 2D spectroscopy of the galaxy and found the strong red (blue) wings of the [OIII] line profile on distance from the nucleus. In our IFP data these components are certainly decoupled (Fig. 2c).
From the helical fitting we obtained an estimation on cone open angle , the inclination angle to the galaxy plane . The axis of cones align with a secondary bar major axis.
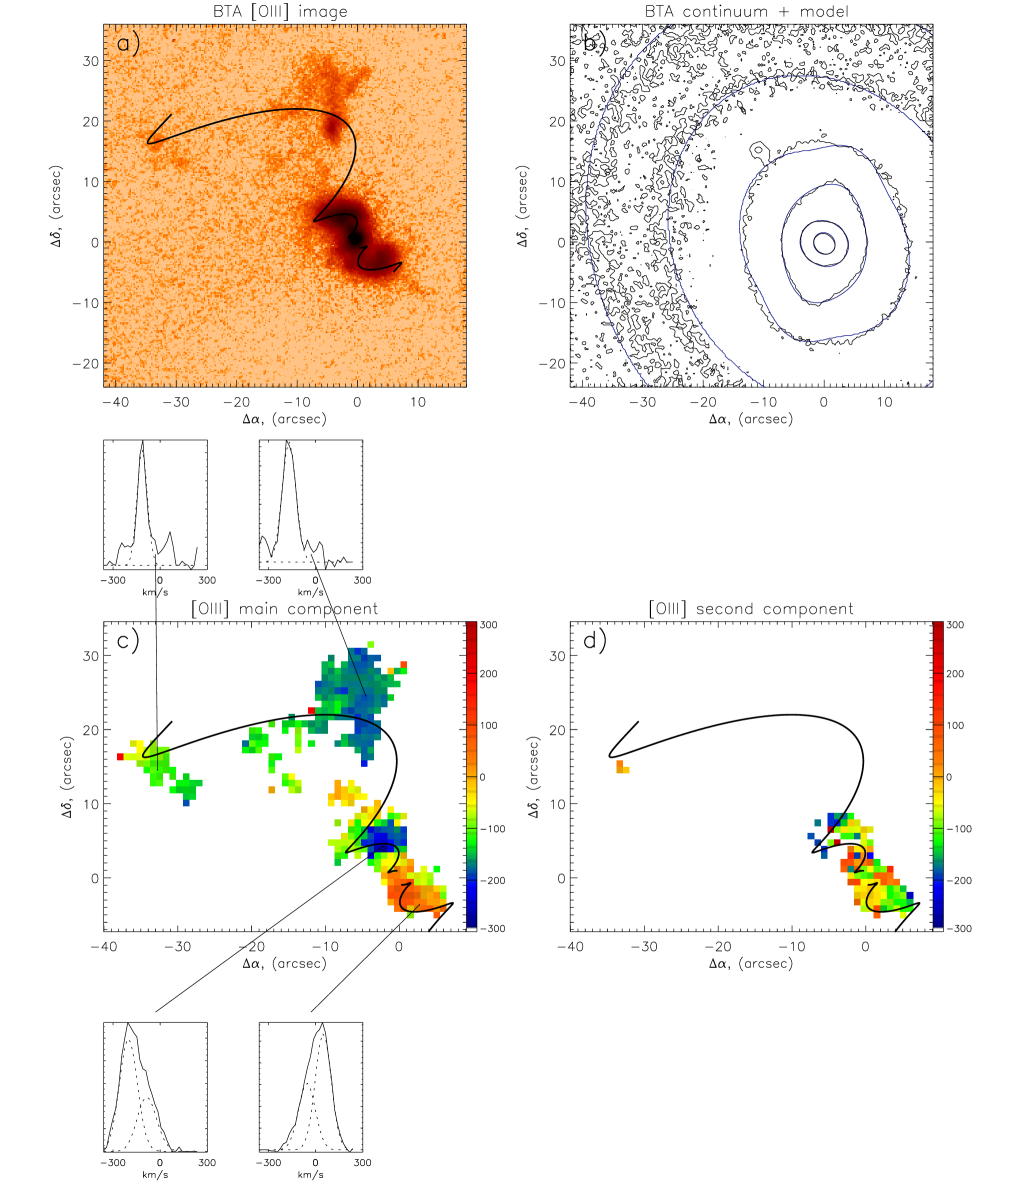
3.3 NGC 3516 (SB0, Seyfert 1.5)
The image in [OIII] line shows the broad cones in (Fig. 3a). The NLR extended on ( kpc) in NE and on ( kpc) in SW in agreement with Miyaji et al.([1992]). The emission regions in have a Z-shaped morphology also available in HST data (Ferruit et.al [1998]). We fit the continuum image of NGC 3516 by a double-barred model, where bars have sizes and (Fig. 3b). The central mini-bar has and matches with line-of-nodes of the stellar velocity field from Arribas et al.([1997]) and with our MPFS-data. A double-component structure of the [OIII] profile (Fig. 3c and 3d), firstly pointed out by Mulchaey et al.([1992]) is seen in . The velocities of the emission components have a ”blue-red” asymmetry along the Z-shaped structure, in agreement with Afanasiev et al. observations at the 4m Mayall telescope. In the line-of-sight velocities have a gradient across the cone axis (along the helical spiral arm).
From the helical fitting we obtained an estimation on cone open angle , the inclination angle to the galaxy plane . The axis of cones align with a secondary bar major axis.
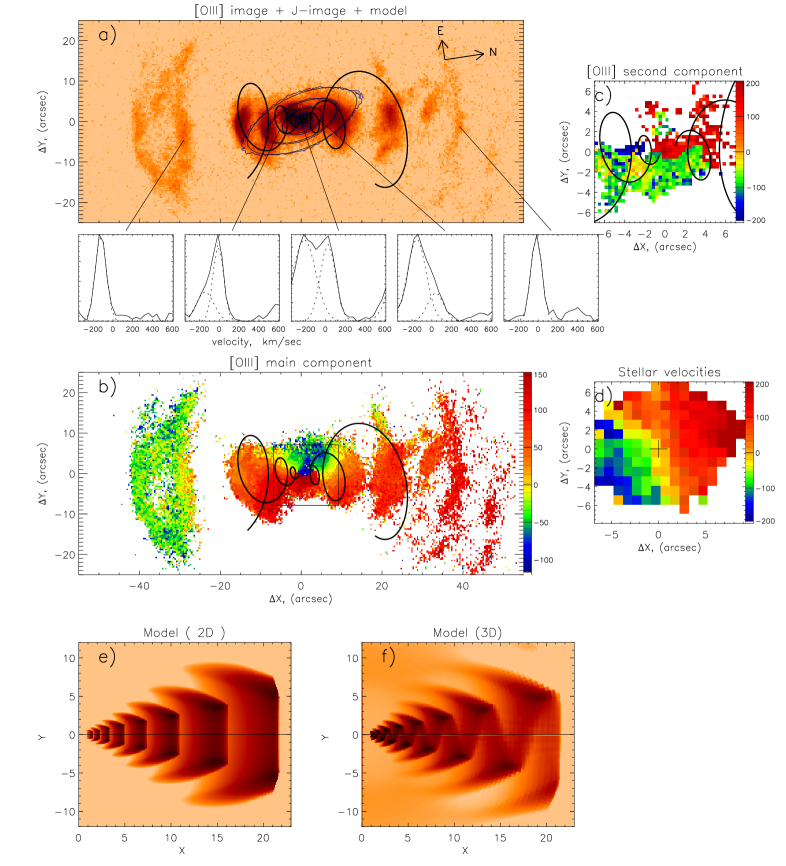
3.4 NGC 5252 (S0, Seyfert 1.9)
A beautiful bi-cone emission structure extended in this galaxy more than ( kpc). The central Z-shaped arms and outer arcs are revealed on the [OIII] image (Fig. 4a. and Morse et al.,[1998]). The major axis on J-band image (Alonso-Herrero et al.,[1998]) has in agreement with stellar rotation (Fig. 4a and 4d). We fitted the J-image by a axisymmetrical model (disk+oblate bulge), but the structure of the central isophotes is uncertain. The asymmetry in stellar velocity dispersion field and ”boxy” isophotes support a possible existence of a mini bar () in a high inclined disk. The second component of the [OIII] line profile is presented in (Fig. 4a-c). Partly it has circular (as stellar) rotation, strong non-circular motions also available. The velocity field of the bright [OIII] component has a very strange structure (Fig. 4b): isovelocities turned across the galactic major axis in the central region and have an insignificant gradient at the outer part of the galaxy (in the outer arcs). The gas line-of-sight velocities show large disagreement with the stellar one.
Note that helical model matched with emission filaments (and its velocities) only in . The outer emission arcs have a small gradient of line-of-sight velocity and probably has a axis-symmetrical structure.
4 A numeric simulations
We just started sets of 2D and 3D hydrodynamical simulations of a conical jet with optically thin radiative cooling in the field of parabolic gravity potential. This simulations show that heavy damping of all acoustical modes and little influence on unstable Kelvin-Helmholtz surface modes are presented. Waveguide-resonance internal gravity modes moving relative to the jet matter from the source being always damped, the growth of modes moving towards the source is faster then in adiabatic jet. Our analysis shows that surface Kelvin-Helmholtz modes and waveguide-resonance internal gravity body modes will be most effective at producing shock waves outside from the central outflow (radio jet). Moreover, these shocks create a cone with rather large opening angle than initial jet. The intensity of radiative cooling in these shocks provide heating of the ambient medium and forms a cone of ionization.
Our simulation shows that axisymmetrical waves are grows slower than helical waves. Therefore these waves can be observed at the outer regions. An amplitude of the helical modes decrease with radius (unlike from axisymmetrical modes). And nonlinear superposition of helical and axisymmetrical waves can give the structure which observed in the NGC 5252. Moreover, simulation shows that line-of-sight gas velocities will be increased with a distance from center, in good agreement with observations (section 3).
The Fig.4e and Fig.4f. reproduce projections of the ionized gas luminosity on the sky plane which were obtained from the 2D and 3D simulations. We can see axisymmetrical waves (”rings”) and helical waves around the central outflow. These first results support our scenario of formation of the Z-shaped and arc-like emission structures in Seyfert galaxies.
We postulate that model of NLR which includs the bar, radio jet, ionization cone and helical waves in the cone may be constructed from easy assumption, without special limitations on the origin of AGN central engine.
-
Acknowledgements.
We would like to thank astronomers of the SAO – Alexander Burenkov, Irina Kostiuk, Alla Shapovalova and Valery Vlasyuk for assisting at the 6m telescope, Sergej Drabek and Eugene Gerasimenko for technical supporting of the observations and 6m telescope committee for allocating observing time. Also we are grateful to Viktor Levi for helpful discussions and to to Almudena Alonso-Herrero who provided the J-band image of NGC 5252.
References
- 1995 Afanasiev, V.L., Burenkov, A.N., Shapovalova, A.I., Vlasyuk, V.V.,1996, in IAU Coll.157,Vol.91, 218
- 1995 Afanasiev, V.L., Vlasyuk, V.V.,1995, in IAU Coll.149,Vol. 71, 266
- 1990 Afanasiev, V.L. & Sil’chenko, O.K., 1991,Bull. SAO,33,104
- 1998 Alonso-Herrero, A., Simpson, C., Ward, M.J., Wilson, A.S.,1998,ApJ,495,196
- 1997 Arribas, S.,Mediavilla, E., Garsia-Lorenzo, B., Del Burgo, C., 1997,ApJ,490,227
- 1996 Axon, D.J. & Robinson, A., 1996, in Nobel Symposium 98,223
- 1995 Capetti, A., Macchetto, F., Axon, D.J., et al.,1995,ApJ,448,600
- 1999 Ferruit, P., Wilson A.S., Falcke, H., et al.,1999, MNRAS,309,1
- 1998 Ferruit, P., Wilson, A.S., Mulchaey, J.S.,1998, ApJ,509,646
- 1992 Miyaji, T., Wilson, A.S., Perez-Fournon, I.,1992,ApJ,385,137
- 1998 Moiseev, A.V., 1998, SAO RAS preprint, N 134/1
- 1998 Morse, J. A., Cecil, G., Wilson, A.S., Tsvetanov, Z.I.,1998,ApJ,505,159
- 1992 Mulchaey, J.S., Tsvetanov, Z., Wilson, A.S., Perez-Fournon, I.,1992,ApJ,394,91
- 1993 Pogge, R.W. & De Robertic, M.M., 1993,ApJ,404,563
- 2000 Rossi, P., Capetti, A., Bodo, G., et al.,2000,A&A,356,73
- 1979 Tonry, J. & Davis, M.,1979,AJ,84,1511
- 1993 Veilleux, S., Tully, R.B., Bland-Hawtorn, J., 1993,AJ,105,1318
- 1995 Vila-Vilaro, B., Robinson, A., Perez, E., et al.,1995,A&A,302,58
- 1994 Wilson, A.S. & Tsvetanov, Z.I.,1994,AJ,107,1227