A Relationship Between Nuclear Black Hole Mass and Galaxy Velocity Dispersion
Abstract
We describe a correlation between the mass of a galaxy’s central black hole and the luminosity-weighted line-of-sight velocity dispersion within the half-light radius. The result is based on a sample of 26 galaxies, including 13 galaxies with new determinations of black hole masses from Hubble Space Telescope measurements of stellar kinematics. The best-fit correlation is over almost three orders of magnitude in ; the scatter in at fixed is only 0.30 dex and most of this is due to observational errors. The - relation is of interest not only for its strong predictive power but also because it implies that central black hole mass is constrained by and closely related to properties of the host galaxy’s bulge.
Subject headings:
galaxies: nuclei — galaxies: statistics — galaxies: general1. Introduction
Massive black holes at the centers of galaxies are now recognized as a normal, perhaps ubiquitous, component of elliptical galaxies and spiral galaxy bulges. The early evidence is summarized in Kormendy & Richstone (1995) and references therein. Using a heterogeneous set of 36 galaxies, mostly with ground-based spectroscopy and space-based photometry, Magorrian et al. (1998) argue that all hot galaxy components (ellipticals and spiral galaxy bulges) contain central black holes. Kormendy (1993), Kormendy & Richstone (1995), and Magorrian et al. (1998) also find that black hole mass is proportional to galaxy mass or luminosity, although with large scatter (see left panel of Fig. 2). Richstone et al. (1998) outline a plausible physical framework to discuss the connections between current black hole mass, galaxy formation, and quasar evolution. The set of galaxies with reliable black hole masses is growing rapidly, mostly through an aggressive campaign of Hubble Space Telescope (HST) observations, and this set is now large enough to investigate the dependence of on galaxy properties, and thus to provide clues to the role of central black holes in galaxy formation and evolution. In this Letter, we present a new correlation between line-of-sight velocity dispersion and black hole mass that has very little intrinsic scatter (probably less than 40% in ).
2. The Sample
Our sample is restricted to galaxies whose black hole masses and line-of-sight velocity dispersions are well determined. We use only two galaxies with maser masses (NGC 4258 and NGC 1068), since only these have well measured dispersions. We also use six galaxies with black hole masses determined from gas kinematics. Among the galaxies with black hole masses determined from stellar kinematics, we limit our sample to those that have three-integral models with HST spectroscopy (16 galaxies), plus our Galaxy (Ghez et al. 1998; Genzel et al. 2000) and M31 (Dressler & Richstone 1988, Kormendy 1988). We do not use 21 galaxies from the sample of Magorrian et al. (1998) that have only ground-based kinematic data and two-integral dynamical models. Galaxies with black hole detections based on isotropic or spherical models (e.g., NGC 3115: Kormendy et al. 1996a, NGC 4594: Kormendy et al. 1996b, NGC 4486B: Kormendy et al. 1997) are also excluded until they are re-analyzed with three-integral models.
The majority of black hole mass estimates in the present sample (14 out of 26) come from galaxies with HST spectra and preliminary three-integral axisymmetric dynamical models described by Gebhardt et al. (2000a, 2000b) and Richstone et al. (2000). Since all of these galaxies have been observed, analyzed, and modeled with the same procedures, we expect that the scatter due to systematic errors will be smaller than in a more heterogeneous sample.
Table 1 presents the data as follows: galaxy name (Column 1), type (Col. 2), black hole mass and 68% uncertainty (Col. 3), integrated line-of-sight velocity dispersion as defined below (Col. 4), distance in Mpc (Col. 5), and source (Col. 6). The velocity dispersions are from heterogeneous sources with uncertain errors, but probably most are accurate to within 5%. Most distances come from surface brightness fluctuations (Tonry et al. 2000); otherwise we use Virgo infall models to infer the distance (Dekel 2000, private communication), all scaled to a Hubble constant of 80 Mpc-1.
![[Uncaptioned image]](/html/astro-ph/0006289/assets/x1.png)
3. Estimating the Velocity Dispersion
We devote particular care to finding a suitable line-of-sight dispersion. The traditional estimates of galaxy velocity dispersions come from the central regions (Faber et al. 1989; Jørgensen & Franx 1994), but these are affected by in some galaxies. We focus on the aperture dispersion (the luminosity-weighted line-of-sight dispersion inside a radius ), since it has a higher signal-to-noise and is less sensitive to the details of the distribution of orbits (Richstone & Tremaine 1984) than is the central dispersion.
For the 13 galaxies studied by Gebhardt et al. (2000b) and Bower et al. (2000), we have extensive ground-based observations of the line-of-sight dispersion as a function of radius. Figure 1 presents the aperture dispersion for these galaxies as a function of radius, normalized to the effective or half-light radius . The largest variations in the normalized dispersion profile occur in the center () and the outer regions (). The variations among the dispersion profiles in the region are small, generally less than 5%. This result follows because galaxies do not show dramatic radial variations in dispersion, especially when integrated over an aperture; the same is generally true of theoretical models of spherical galaxies. In what follows, we measure “dispersion” by the line-of-sight aperture dispersion within .
![[Uncaptioned image]](/html/astro-ph/0006289/assets/x2.png)
Luminosity-weighted line-of-sight dispersion within an aperture of radius , normalized to its value at the effective radius . Each of the 13 lines represents a galaxy from Gebhardt et al. (2000b) and Bower et al. (2000).
The aperture dispersion includes a contribution from the rotation (i.e., we measure the rms velocity relative to the systemic velocity, not relative to the local mean velocity). The measured dispersion depends on the inclination of the galaxy. The values that we quote should be regarded as dispersions for galaxies as viewed edge-on, since several of the galaxies in the sample with the strongest rotation are nearly edge-on (the Galaxy, M31, NGC 1023, NGC 3377, NGC 3384, and NGC 4342). For the rest, the inclination is not well determined; however, the change in dispersion with viewing angle for ellipticals as judged from models is always 20% and on average is less than 5% (as calculated from van der Marel 1991).
4. Results
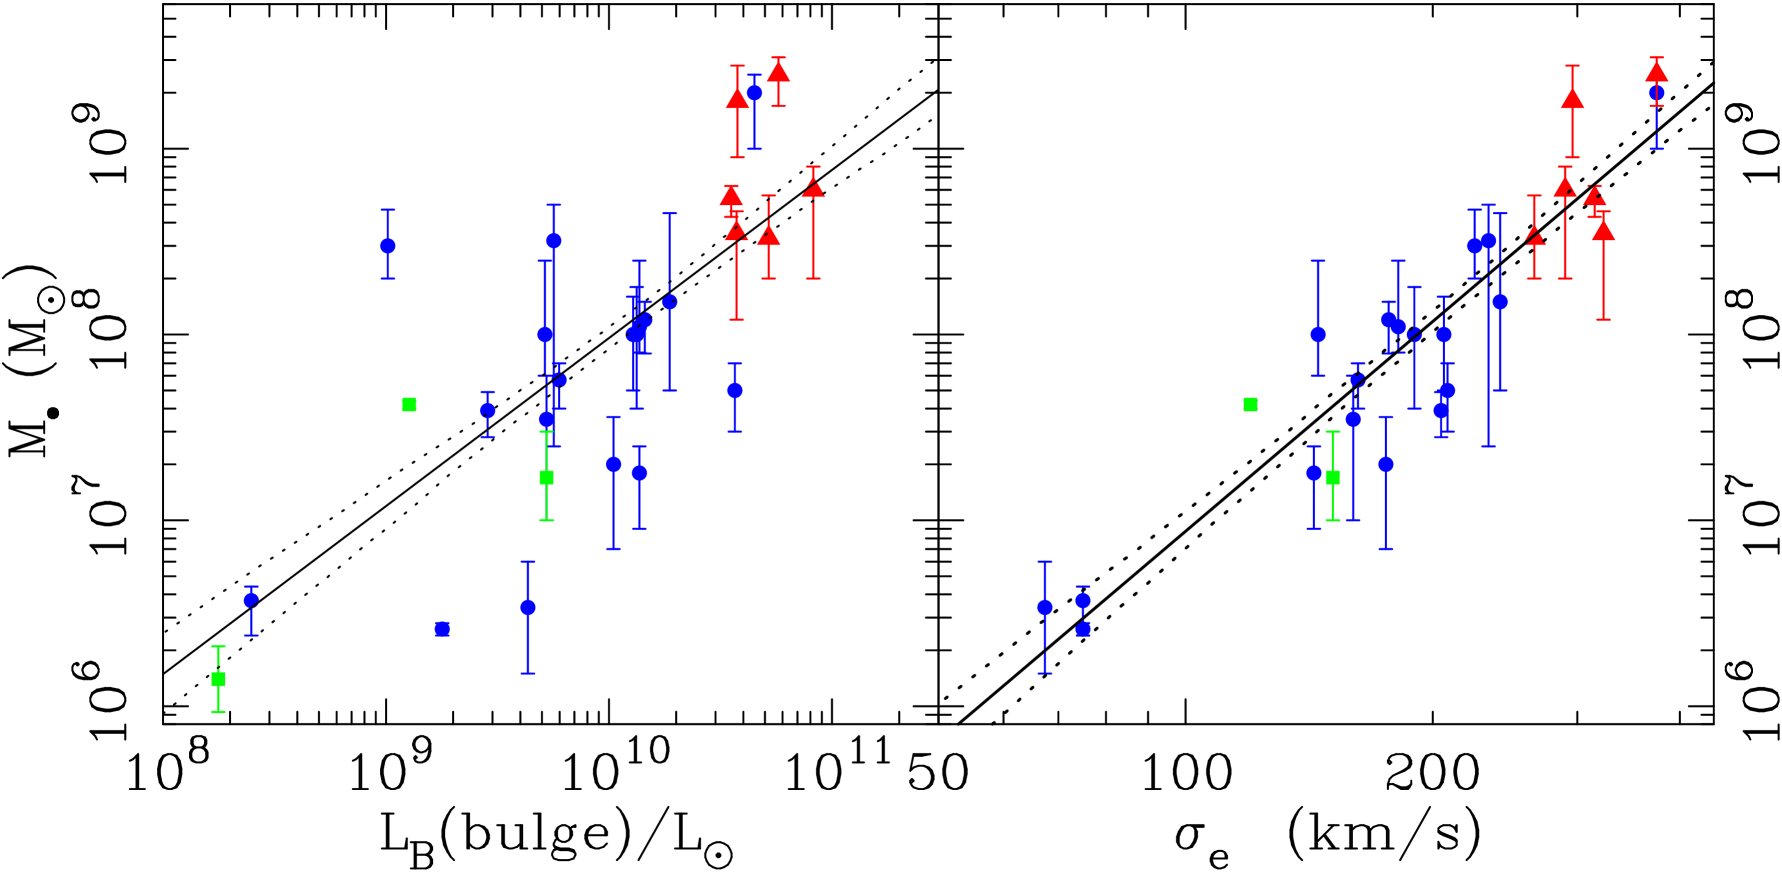
Figure 2 plots the black hole mass versus bulge luminosity and the aperture dispersion at . The bulge luminosity correlation will be discussed in Kormendy et al. (2000b). The correlation with dipersion is extremely strong, with a correlation coefficient of 0.93. By a variety of tests, it is much more significant than the 99% level. Furthermore, the correlation remains present in various subsamples—e.g., only galaxies from Gebhardt et al. (2000b), or only galaxies with gas dynamical or maser mass estimates. The correlation is robust.
The line in the right panel Figure 2 is a fit to the data assuming that errors in dispersion measurements are zero and that errors in are the same for each galaxy. The best-fit line is
| (1) |
We have also measured the relation using the seven galaxies with the best measured masses and dispersions (our Galaxy, M32, N4261, N4486, N4564, N4697, and N7052), and find the same fit within the errors. The 68% confidence limits for the best-fit linear relation come from standard least-squares fitting. The uncertainty, based on Monte Carlo simulations, is in the exponent and 0.057 dex in the normalization at 200 .
The measured scatter is 0.30 dex in black hole mass at fixed dispersion. For the scatter estimate we use the biweight (Beers et al. 1990), and for this sample the biweight value is close to that of the standard deviation. Given the likely measurement errors, the intrinsic scatter is probably 0.15 dex. In fact, the scatter from the seven galaxies with the best-measured quantities is 0.14 dex in black hole mass. More accurate black hole masses are required to better constrain the intrinsic scatter. With present data the intrinsic scatter is consistent with zero.
It is possible that the tight correlation between black hole mass and dispersion arises in part because the sample that we analyze consists mainly of galaxies in HST observing programs that have been chosen to look “normal” (e.g., no unusual morphology, active nuclei, disturbed gas kinematics). It will be important to test the correlation using a broader sample.
The galaxies that have the most leverage on the slope of the best-fit correlation are those at the extremes, both low and high mass. We discuss each of these, but we note that, when the three smallest and two largest black holes are excluded, the best-fit slope still lies within the original error bars. The three galaxies with the smallest black hole masses are the Milky Way, M32, and NGC 7457. The masses for our Galaxy (Ghez et al. 1998; Genzel et al. 2000) and M32 (van der Marel et al. 1998) are among the most accurate of any in the sample. The mass for NGC 7457 (discussed in Gebhardt et al. 2000b) is difficult to measure because there is a point source in the nucleus (Lauer et al. 1991); it may be overestimated. Measuring the line-of-sight dispersions for NGC 7457 and M32 is straightforward (Pinkney et al. 2000b; van der Marel et al. 1998) since in both galaxies the dispersions are nearly independent of radius. The situation for our Galaxy is more difficult since we have to use the near-infrared surface-brightness profile (Kent et al. 1991) and individual stellar velocities (Kent 1991; Genzel et al. 2000) to determine the aperture dispersion. The effective radius of the bulge is uncertain due to disk contamination, but choosing values between 50 and 500 arcseconds provides dispersions between 85 and 65 . We adopt 75 .
The two galaxies with the largest black holes are M87 (NGC 4486) and NGC 4649. The black hole mass in M87 appears well determined. The mass of the black hole in NGC 4649 has substantial uncertainties since its nuclear velocity dispersion is so large that absorption lines in the STIS spectrum are washed out (Gebhardt et al. 2000b). The effective velocity dispersions in both of these galaxies have been measured by several groups with good agreement.
We have looked for ways to reduce the scatter in the relation still further, but without much success. Including the effective radius as an additional parameter does provide a small improvement but only if the dependence is very weak, at fixed . We also examined the correlation of with aperture dispersions within various radii, and find a similar correlation but with slightly larger scatter—by 0.03 dex.
5. Discussion
A preliminary version of these results was presented at the June 2000 American Astronomical Society meeting in Rochester (Kormendy et al. 2000), where we learned of a similar analysis by Ferrarese & Merritt (2000). Their result, based on 12 objects, has a steeper slope (). This difference may be due to different dispersions, black hole masses, or distances for the same objects. Our sample size is larger (26 compared to 12 galaxies), and many of our black hole masses come from as-yet-unpublished high-quality HST data and analyses. For their nearest galaxies (the Galaxy and M32) it is likely that the central dispersions used by Ferrarese & Merritt (2000) are enhanced by the black hole, which in turn creates a steeper slope. If we restrict our sample to the 11 galaxies common to their sample and ours but use our black hole masses and dispersions, we find the same slope as presented here (). Thus, we are confident that our result is robust.
The implications of our results can be discussed in the context of the fundamental plane for galaxies. Roughly speaking, elliptical galaxies and bulges can be described by three parameters: the effective radius , the total luminosity , and the luminosity-weighted velocity dispersion . If these galaxies have similar luminosity and mass distributions and if the mass-to-light ratio is a well behaved function of and , then the virial theorem implies that they occupy a two-dimensional manifold in the three-dimensional space with coordinates ; this is the so-called “fundamental plane” (Dressler et al. 1987; Djorgovski & Davis 1987; Faber et al. 1987). Any two of these variables can be used to predict the value of the third.
Now let us examine the location of elliptical galaxies and bulges in the four-dimensional space with coordinates . The correlation of with that we describe here implies that (i) galaxies are still restricted to a two-dimensional manifold—a fundamental plane—in this four-dimensional space, and (ii) when projected onto the plane, the fundamental plane is viewed nearly edge-on—in other words, contours of constant on the fundamental plane are parallel to contours of constant . It is remarkable that the scatter normal to the plane, 0.05 dex in three dimensions, is increased to only 0.08 dex in four dimensions.
Most earlier discussions of the demography of central black holes focused on the correlation of black hole mass with galaxy luminosity, which can be regarded as a projection of the four-dimensional fundamental plane onto the plane. We now understand that most of the substantial scatter in that relation—0.6 dex in —is not a reflection of stochastic processes that controlled the growth of black holes but arises instead simply because in this projection the fundamental plane is not viewed edge-on. Confirmation of this point is provided by the observation that those galaxies which are outliers in the relation are not outliers in the relation.
The tight correlation between black hole mass and velocity dispersion strongly suggests a causal connection between the formation and evolution of the black hole and the bulge. However, the nature of this connection remains obscure (Haehnelt & Rees 1993; Haiman & Loeb 1998; Silk & Rees 1998; Kauffman & Haehnelt 2000). It is natural to assume that bulges, black holes, and quasars formed, grew, or turned on as parts of the same process, in part because the collapse or merger of bulges might provide a rich fuel supply to a centrally located black hole. The finding that black hole mass correlates more closely with dispersion than total luminosity or other global properties probably reflects the fact that the aperture dispersion is less sensitive to the properties of the outer galaxy.
We have shown that black hole mass is tightly coupled to velocity dispersion of the host galaxy over three orders of magnitude. It remains to be seen whether this correlation applies at still larger or smaller black hole masses. It should be straightforward to explore smaller masses, but examining higher-dispersion galaxies (e.g., cD galaxies) will be challenging because of their low surface brightnesses and large dispersions. We may even speculate whether the correlation extends to stellar systems with dispersions as low as dwarf spheroidal galaxies and globular clusters, although in other respects these objects are quite different from bulges and elliptical galaxies (Kormendy 1985). A typical dwarf spheroidal galaxy or massive globular cluster has a dispersion of about 10 ; if the correlation applies, it suggests a black hole mass of about . It is intriguing that Gebhardt et al. (2000c) measure an increase in the mass-to-light ratio of M15 near its center, consistent with a central mass of 2500 .
References
- (1)
- (2) Beers, T.C., Flynn, K., & Gebhardt, K. 1990, AJ, 100, 32
- (3) Bower, G. et al. 1998, ApJ, 492, 111 (B98)
- (4) Bower, G. et al. 2000, in preparation (B00)
- (5) Cretton, N., & van den Bosch, F. 1999, ApJ, 514, 704 (C99)
- (6) Djorgovski, S., & Davis, M. 1987, ApJ, 313, 59
- (7) Dressler, A., Lynden-Bell, D., Burstein, D., Davies, R. L., Faber, S. M., Terlevich, R., & Wegner, G. 1987, ApJ, 313, 42
- (8) Dressler, A., & Richstone, D.O. 1988, ApJ, 324, 701
- (9) Faber, S. M., Dressler, A., Davies, R. L., Burstein, D., Lynden-Bell, D., Terlevich, R., & Wegner, G. 1987, in Nearly Normal Galaxies: From the Planck Time to the Present, ed. S. M. Faber (Springer, New York), 175
- (10) Faber, S.M., Wegner, G., Burstein, D., Davies, R., Dressler, A., Lynden-Bell, D., & Terlevich, R. 1989, ApJS, 69, 763
- (11) Faber, S.M. et al. 1997, AJ, 114, 1771
- (12) Ferrarese, L., Ford, H.C., & Jaffe, W. 1996, ApJ, 470, 444 (F96)
- (13) Ferrarese, L., & Ford, H.C. 1999, ApJ, 515, 583 (F99)
- (14) Ferrarese, L., & Merritt, D. 2000, ApJ, submitted
- (15) Gebhardt, K. et al. 2000a, AJ, 119, 1157 (G00a)
- (16) Gebhardt, K. et al. 2000b, in preparation (G00b)
- (17) Gebhardt, K., Pryor, C., O’Connell, R.D., Williams, T.B., & Hesser, J.E. 2000c, AJ, 119, 1268
- (18) Genzel, R., Pichon, C., Eckart, A., Gerhard, O., & Ott, T., 2000, MNRAS, submitted (Ge00)
- (19) Ghez, A. M., Klein, B. L., Morris, M., & Becklin, E. E. 1998, ApJ, 509, 678
- (20) Greenhill, L.J., Gwinn, C.R., Antonucci, R., Barvainis, R., 1996, ApJ, 472, L21 (G96)
- (21) Haehnelt, M.G., & Rees, M.J. 1993, MNRAS, 263, 168
- (22) Haiman, Z., & Loeb, A. 1998, ApJ, 503, 505
- (23) Harms, R.J. et al. 1994, ApJ, 435, L35 (H94)
- (24) Hèraudeau, P., Simien, F. 1998, A&AS, 133, 317 (H98)
- (25) Jørgensen, I., & Franx, M. 1994, ApJ, 433, 553
- (26) Kauffmann, G., & Haehnelt, M. 2000, MNRAS, 311, 576
- (27) Kent, S.M. 1991, ApJ, 387, 181
- (28) Kent, S.M., Dame, T., & Fazio, G. 1991, ApJ, 378, 131
- (29) Kleijn, G.V., van der Marel, R.P., Carollo, M., de Zeeuw, P.T. 2000, AJ, submitted (K00)
- (30) Kormendy, J. 1993, in The Nearest Active Galaxies, eds. J. Beckman, L. Colina, & H. Netzer (Madrid: CSIC), 197
- (31) Kormendy, J. 1985, ApJ, 295, 73
- (32) Kormendy, J. 1988, ApJ, 325, 128 (K88)
- (33) Kormendy, J., & Richstone, D. 1995, ARA&A, 33, 581
- (34) Kormendy, J. et al. 1996a, ApJ, 459, L57
- (35) Kormendy, J. et al. 1996b, ApJ, 473, L91
- (36) Kormendy, J. et al. 1997, ApJ, 482, L139
- (37) Kormendy, J., Bender, R., Evans, A., & Richstone, D. 1998, AJ, 115, 1823 (K98)
- (38) Kormendy, J., Gebhardt, K., & Richstone, D. 2000, BAAS 196, 2122
- (39) Kormendy, J. et al. 2000, in preparation
- (40) Lauer, T.R. et al. 1991, ApJ, 369, L41
- (41) Magorrian, J. et al. 1998, AJ, 115, 2285
- (42) Miyoshi, M., et al. 1995, Nature, 373, 127 (M95)
- (43) Nelson, C.H., Whittle, M. 1995, ApJS, 99, 67 (N95)
- (44) Pinkney, J. et al. 2000, in preparation
- (45) Richstone, D. O., & Tremaine, S. 1984, ApJ, 286, 27
- (46) Richstone, D. et al. 1998, Nature, 395, A14.
- (47) Richstone, D. et al. 2000, in preparation
- (48) Silk, J., & Rees, M.J. 1998, A&A, 331, L1
- (49) Smith, E., Heckman, T., & Illingworth, G. 1990, ApJ, 356, 399 (S90)
- (50) Tonry, J., Blakeslee, J., Ajhar, E., & Dressler, A. 2000 ApJ, 530, 625
- (51) van der Marel, R.P., Binney, J.J., & Davies, R.L. 1990, MNRAS, 245, 582 (v90)
- (52) van der Marel, R.P. 1991, MNRAS, 253, 710
- (53) van der Marel, R.P., Evans, N., Rix, H.-W., White, S., & de Zeeuw, P. 1994, MNRAS, 271, 99 (v94)
- (54) van der Marel, R.P. 1994, ApJ, 432, L91 (v94b)
- (55) van der Marel, R.P., Cretton, N., de Zeeuw, P.T., & Rix, H.-W. 1998, ApJ, 493, 613 (v98)
- (56) van der Marel, R.P., & van den Bosch, F. 1998, AJ, 116, 2220 (v98b)
- (57)