Near-infrared photometry of isolated spirals with and without an AGN. II: Photometric properties of the host galaxies. ††thanks: Based on data obtained at: the European Southern Observatory, La Silla, Chile, the Télescope Bernard Lyot, Calar Alto Observatory, Las Campanas Observatory. Also based on observations made with the NASA/ESA Hubble Space Telescope, obtained from the data archive at the Space Telescope Institute
Abstract
We present here the analysis of morphological and photometric properties of a sample of isolated spirals with (18) and without (11) an active nucleus, based on near-infrared imaging in the J and K’ bands (Paper I). The aim of that comparative analysis is to find the differential properties that could be directly connected with the phenomenon of nuclear activity. We stress the importance of using isolated objects for that purpose. Our study shows that both sets of galaxies are similar in their global properties: they define the same Kormendy relation, their disk components share the same properties, the bulge and disk scale lengths are correlated in a similar way, bar strengths and lengths are similar for primary bars. Our results therefore indicate that hosts of isolated Seyfert galaxies have bulge and disk properties comparable to those of isolated non active spirals. Central colors (the innermost 200 pc) of active galaxies are redder than the centers of non active spirals, most probably due to AGN light being re-emitted by the hot dust and/or due to circumnuclear star formation, through the contribution of giants/supergiants.
Central to our analysis is the study of the possible connection between bars and similar non axisymmetric structures with the nuclear fuelling. We notice that only one of the Seyfert galaxies in our sample, namely ESO 139-12, does not present a primary bar. But bars are equally present in active and control objects. The same applies to secondary bars. Not all the active galaxies we have observed have them, and some control galaxies also present such central structures. Secondary central elongations (associated with secondary bars, lenses, rings or disks) may be somewhat different, but this result should be confirmed with larger samples. We note that numerical models indicate that such secondary bars are not strictly necessary to feed the central engine when a primary bar is present. Our results show that down to scales of 100-300 pc, there are no evident differences between active and non active spiral galaxies.
Key Words.:
galaxies: active - galaxies: fundamental parameters - galaxies: photometry - infrared: galaxies1 Introduction
Many studies have been devoted to analyze the properties of Seyfert host galaxies in order to understand the fuelling processes taking place in active galactic nuclei (AGN). At large scale, the fuelling of the active nucleus is supposed to be due to the transport of gas to the central region; this mechanism seems to be connected to the presence of a bar, which provides the non axisymmetric potential invoked in theoretical works (Simkin et al. 1980, Shlosman et al. 1989, Barnes & Hernquist 1991). One of the mechanisms proposed to drive the gas to the very central regions of barred galaxies is that of nested bars (Shlosman et al. 1989; Friedli & Martinet 1993; Combes 1994; Heller & Shlosman 1994), which has been recently proved to fuel molecular gas into an intense central starburst in NGC 2782 (Jogee et al. 1999) and in a Seyfert 2 galaxy, Circinus (Maiolino et al. 1999).
Nevertheless, from the observational side, recent studies (Moles et al. 1995; Ho et al. 1997; Hunt et al. 1999a) based on optical data conclude that barred galaxies are equally found among active and non active galaxies. Therefore, large scale bars are not the specific property that identifies the family of active spiral galaxies. NIR imaging is more reliable in determining the overall mass distribution in galaxies and it has been shown to be more efficient to detect bars (Mulchaey et al. 1997; Seygar & James 1998). From their NIR imaging analysis, McLeod & Rieke (1995) and Mulchaey & Regan (1997) find no evidence for a significant excess of bars in Seyfert galaxies. But a debate still exists on this matter: the analysis by Knapen et al. (2000) of high resolution NIR images by Peletier et al. (1999) points to an excess of bars among Seyferts at a 2.5 level, attributing their different result to their better spatial resolution and better matching of active and control samples than in previous works.
A different approach to the problem, also adopted here, consists in deriving detailed information on a number of selected objects, instead of performing statistics on large samples. Regan & Mulchaey (1999) analyze the HST high resolution dust morphology of 12 Seyferts, searching for central bars. The non-ubiquity of such bars led them to conclude that strongly barred potentials cannot be the only mechanism for driving gas into the nucleus; they propose central spiral dust lanes as an alternative method. In the same vein, Martini & Pogge (1999) analyze HST images of 24 Seyfert 2s and find nuclear spirals in 20 of them but only 5 with nuclear bars, concluding that nuclear spirals may be the channel to feed gas into the central engines.
Following this approach, we have chosen to analyze what the similarities and/or differences are between active and non active spirals. Since gravitational interaction has been invoked to be very efficient to induce the formation of bars or any other non axisymmetric component, we take the approach of only selecting isolated objects, in order to avoid the bias introduced by not taking into account the environmental characteristics of the considered galaxies. The DEGAS project (Dynamics and Nuclear Engine of Galaxies of Spiral type) aims at extending the analysis by Moles et al. (1995) and addresses the morphology of the galaxies, including optical and IR images, and the kinematics of the stars and gas, through long slit, high resolution spectroscopy. In this paper we present the analysis of the NIR imaging, which is particularly important because it allows: 1) to separate the various components (the bulge, disk, bar(s) and spiral arms) with the smallest contribution of the active nucleus; 2) to detect and characterize the properties of bars and other structures close to the nucleus, such as bars within bars, elongated disks, rings or lenses, traced by the old stellar population. We present the analysis based on the data set presented in Márquez et al. (1999), and compare the properties of active and non active galaxies in our sample, and those of our sample galaxies with those found in similar studies based on other samples.
2 The sample and data
The infrared imaging data for 18 active objects and 11 non active galaxies are described in Márquez et al. (1999, hereafter Paper I). The active galaxies have been chosen with the following criteria: (a) Seyfert 1 or 2 from the Véron-Cetty & Véron (1993) catalogue; (b) with morphological information in the RC3 Catalogue; (c) isolated, in the sense of not having a companion within 0.4 Mpc (H0=75 km/s/Mpc) and cz500 km/s, or companions catalogued by Nilson without known redshift; (d) nearby, cz6000 km/s; and (e) intermediate inclination (30 to 65∘). The non active sample galaxies have been selected among spirals verifying the same conditions (b), (c), (d) and (e), and with morphologies (given by the complete de Vaucouleurs coding, not just the Hubble type) similar to those of the active spirals. Thus, all the galaxies in our sample are isolated, in the sense of avoiding possible effects of interactions with luminous nearby galaxies.
In Paper I we already stressed that these non active galaxies are well suited to be used as a control sample. For each object we give in Paper I: the image in the K’ band, the sharp-divided image (obtained by dividing the observed image by a filtered one), the difference image (obtained by subtracting a model to the observed one), the J-K’ color image, the ellipticity and position angle profiles, the surface brightness profiles in J and K’ and their fits by bulge+disk models and the J-K’ color gradient.
The mean resolution of our images is about 1 arcsecond, corresponding to a physical resolution between 100 and 300 parsecs for the closest and the more distant galaxy respectively. This resolution implies that we are able to map the region where the dynamical resonances are expected to occur (see for instance Pérez et al. 2000) and is therefore well suited for our purposes.
3 Results of the photometric bulge+disk decomposition
| Active | Control | |
| 15.24 1.87 | 15.73 2.36 | |
| log R | -0.26 0.42 | -0.24 0.61 |
| 16.97 0.49 | 16.74 1.83 | |
| log R | -0.10 0.44 | -0.25 0.53 |
| 18.57 0.62 | 18.94 0.58 | |
| log R | 0.68 0.17 | 0.67 0.18 |
| 19.54 0.29 | 20.30 0.88 | |
| log R | 0.74 0.23 | 0.60 0.28 |
| 4.27 1.59 | 4.94 1.97 | |
| 0.35 0.17 | 0.45 0.18 | |
| (J-K’)bulge | 1.02 0.70 | 1.25 0.50 |
| (J-K’)disk | 0.78 0.36 | 0.92 0.33 |
| (J-K’)prim.bar | 1.03 0.07 | 1.09 0.07 |
| (J-K’)centre | 1.65 0.44 | 1.14 0.22 |
| 1.28 0.51 | 0.97 0.23 | |
| 0.22 0.16 | 0.28 0.08 | |
| (J-K’)prim.bar | 1.02 0.03 | 1.12 0.06 |
| (J-K’)sec.bar | 1.14 0.10 | 1.29 0.19 |
| (J-K’)centre | 1.50 0.35 | 1.09 0.25 |
Note: Surface brightnesses () are given in mag/ and sizes in kpc. and are deprojected values for the bar (=1 for the primary and =2 for the secondary) semi-major axis and ellipticity ( = ). The second part of the table refers to galaxies with both primary and secondary bars.
The surface brightness profiles derived for all the galaxies together with the best bulge/disk decomposition (1D exponential disk and de Vaucouleurs bulge) are displayed in Figs. 1-28 f-g, and the corresponding observed parameters are given in Table 3 of Paper I. Note that several galaxies (namely the active galaxies NGC 3660 and NGC 5728, and the non active galaxies NGC 151, NGC 2811 and NGC 3571) extend notably further out than the infrared images, so the resulting bulge+disk decomposition cannot be satisfactory. Full 2D fits have not been considered since, as already noticed by de Jong (1996b), they would not be better than 1D fits for the purposes of the present study.
The average bulge and disk effective surface brightnesses and effective radii in J and K’ as well as J-K’ colors are given in Table LABEL:decomp. Magnitudes have been corrected for galactic extinction, inclination (assuming transparent disks) and redshift (we have applied the K correction following Hunt et al. 1997). We note that, at face values, some differences are found between active and control galaxies. However, the application of non-parametric tests shows that those differences are not significant.
With respect to the bulge component, we recall that the parameters derived from the photometric decomposition are more critically dependent on the fitting procedure (see de Jong 1996a; Moriondo et al. 1996); in addition to this, the contribution of the AGN in active galaxies is not easy to extract, so bulge parameters can be less accurate. With these caveats in mind, the differences in the average values reported in Table LABEL:decomp are not conclusive; the Kolmogorov-Smirnoff (KS) test gives a probability greater than 98% for both samples to have the same magnitude, surface brightness and scale-length.

In Fig. 1 the bulge equivalent surface brightness is plotted as a function of equivalent radius (i.e. the Kormendy 1977 relation for bulges) for active and control galaxies. Different symbols were used for the various morphological types. However, since the number of galaxies in our sample is small, it is not possible to define Kormendy relations for the various morphological types. The best fits are and for control and active galaxies respectively ( when the two samples are taken together). The Kormendy relations obtained for similar data in the near infrared by other authors are also drawn in these figures. Our data are in good agreement with these relations, and extend to somewhat smaller bulges.
The Xanthopoulos (1996) relation in the I band for Seyfert 1 vs. Seyfert 2 galaxies is also given for comparison (27 galaxies). Although it is displaced vertically relative to the relations found in K’, as expected, it shows a comparable slope. Therefore, considering that bulge scale-lengths should essentially be the same from I to K’ for a given galaxy (Evans 1994; see also Hunt et al. 1999a and below), this implies that the bulge component of Seyfert spirals would have an essentially uniform I-K’ color ((I-K’) 2.7).
The region occupied by the bulges obtained by de Jong (1996b) is also plotted in Fig. 1. The bulge parameters for our sample galaxies define a narrower relation than that found by de Jong, probably because we select only the most isolated objects. The same conclusion was found by Márquez & Moles (1999) when comparing the bulge parameters of their isolated spirals (Márquez & Moles 1996) with those of de Jong in the B band and Baggett et al. (1998) in the V band.
The main result is therefore that no difference is found between the bulges of active and control galaxies, in agreement with Hunt et al. (1999a). It appears that the bulges of active and control galaxies have totally similar structural properties.

With respect to the disk component, the disk surface brightness as a function of its equivalent radius is plotted in Fig. 2 for active and control galaxies. The best fits are and for active and control galaxies respectively. The slope of the relation is heavily dependent on the very large and uncertain value found for IC 454. If that point is taken out of the relation, we find for control galaxies . Therefore, both control and active galaxies seem to share the same relation ( for both samples simultaneously).
As for bulges, our data on disks are in good agreement with the relations found by Moriondo et al. (1998) and Hunt et al. (1999a) for normal galaxies. The relation is again narrower for our isolated galaxies than for de Jong’s sample, as reported in Márquez & Moles (1999). The relation found by Xanthopoulos (1995) in the I band is parallel to ours; considering the same scale length for the different bands (as for the bulge, also see below), this would imply an essentially uniform value for the disk color of isolated Seyfert spirals ((I-K’) 1.5).
Average values for the J-K’ colors of bulges and disks are given in Table LABEL:decomp. Bulge colors agree with those by Moriondo et al. (1998) who find a mean (J-K)=1.06 0.3 for a sample of 14 early-type non active spirals. They also agree with the results by Hunt el al. (1999a), who found (J-K)=1.04 and (J-K)=1.07 for the bulges of Seyfert 1 and normal Sa galaxies, respectively. Disk colors occupy a narrower range, in good agreement with previous (J-K) determinations (Hunt et al. 1997; Hunt et al. 1999a). There appears to be a trend, with a large spread of values, for the bulges and disks of active galaxies to have smaller J-K’ values than the control sample, but an application of the KS test results in a 99% probability for both samples to have the same disk color distribution.
Bulge equivalent radii in the J and K’ bands follow the same relation for both active and control galaxies: . With respect to the disk equivalent radii in the J and K’ bands: . Both bulge and disk scale lengths appear to be essentially the same in J and K’.
A comparison of the bulge and disk equivalent radii in the J and K’ bands indicates that, again, both active and control galaxies show the same trend: and . This is in agreement with previous results by de Jong (1996b) (mean = 0.14 in K’), Courteau et al. (1996) (mean = 0.13 in R), and Graham & Prieto (1999) (mean = 0.24 in K’ for early spirals). A weak correlation between and is reported by Seygar & James (1998).
In Fig. 3 we show the relation between the bulge and disk absolute magnitudes in K’. Our results are in good agreement with those by de Jong (1996b), considering that we deal with early-type spirals.

Within the spread of values we find no apparent differences in the photometric parameters between the host galaxies of the active and control samples. This is in good agreement with previous results, except for the disk surface brightnesses of Seyfert galaxies. Bulges of Seyferts in our sample cover the same region as those by Bender et al. (1992) and Andreadakis et al. (1995). The disks of both control and active galaxies are similar to those of normal galaxies in Hunt et al. (1999a; taken from de Jong 1996b and Moriondo et al. 1998) as seen in Fig. 2, and also agree with those by Andreadakis et al. (converted to the K band as in Hunt et al. 1999a). Nevertheless, the disk surface brightness of Seyfert galaxies selected from the CfA sample by Hunt et al. (1999a) and from the 12m sample by Hunt et al. (1999b) are about 1 magnitude brighter in K than those of normal early type spirals. However, it has to be noted that their control samples were not specially designed to match the active sample; in particular, some clearly interacting systems are found among the active sample, so interactions may have an effect on the enhanced surface brightness they obtain.
This raises the question of how well the control sample used for comparison matches the active sample. Very recently, Knapen et al. (2000) have reported a higher bar percentage for active spirals with respect to non active ones. We stress that, unlike other authors, we are avoiding the possible effects of any strong interaction on the disk surface brightness. In particular, if our isolation criteria are applied to select only the isolated objects among those analyzed by Knapen et al., their conclusions change: the (small) resulting samples of active and control galaxies (13 and 11 with morphological information on the presence or absence of a bar) do show the same percentage of barred galaxies (8 and 7 galaxies, respectively). This result reinforces the importance of not including objects that could be suffering from a gravitational interaction (as it is the case, for instance, for NGC 7469, which is included in Knapen’s sample and is known to reside in an isolated pair; see, for instance, Márquez & Moles 1994). Since the sample of active galaxies by Hunt et al. (1999a) also comes from the CfA sample, the same considerations should apply and could explain the higher disk surface brightness they found as a result of including interacting objects. This point should be statistically confirmed by using a larger sample of active and non active isolated spirals.
4 Bars and central properties
We discuss here the properties of primary and secondary bars in the studied galaxies. We remind the reader that we refer to secondary bars every time a central elongation is detected, be it a bar, a lens, an inclined disk or a ring. Whether that elongation is actually a bar is a question that will be addressed using kinematic data.
Observed bar lengths and ellipticities are given in Paper I. They have been obtained from the ellipse fitting, corresponding to peaks in ellipticity for constant PA. All the discussion refers to deprojected bar parameters (see Jungwiert et al. 1997).


Regarding the primary, large scale bars, we find that the distribution of sizes is similar for both active and control galaxies. The same result is found when considering relative bar sizes (with respect to the disk size), as shown in Fig. 5. Both histograms are rather flat, and a KS test indicates that they are similar with a probability higher than 99.5%. The strength of the bars has been parametrized with (b/a), with smaller values of (b/a) for stronger bars as discussed by Martinet & Friedli (1997), and Chapelon et al. (1999). It has to be noted that their the criteria to estimate bar lengths and ellipticities are not exactly the same as ours. Nevertheless, we will be comparing active and control galaxies for which the estimations come from the same procedure (ellipse fitting, see above). In Fig. 5 we have plotted the bar strength as a function of the normalized length (). Our results agree with those presented by the quoted authors. The comparison for active and control galaxies, with mean strengths of = 0.68 0.19 and 0.51 0.24, and mean lengths of = 0.29 0.18 and 0.32 0.13 respectively, don’t show any significant difference. Martinet & Friedli (1997) defined strong bars for 0.6 and long bars for . According to this definition, Fig. 5 also shows that the whole range from weak to strong bars is equally represented for both active and control galaxies. The majority of barred galaxies in both samples harbor long bars (this seems to be specially the case for control galaxies).
The fraction of detections of secondary bars is similar for both active and control galaxies. As suggested by Friedli & Martinet (1993), the formation of the secondary bar is mainly driven by the main bar, so in this case we calculate relative sizes of secondary bars with respect to primary ones. The distribution of the relative sizes is shown in Fig. 7. For active galaxies the distribution is more extended, but the differences are not significant. We stress the fact that the presence of secondary bars is not exceptional in non active galaxies.
Finally, the consideration of the primary and secondary bars together doesn’t show any correlation between the properties of both structures, or with the effective radii of the bulges and disks, in agreement with previous findings (Seygar & James 1998). The only hint we find is for a positive correlation between the sizes of the primary and secondary bars, but the scatter is too large and the sample small. In any case this would not be a difference between active and non active galaxies, since it would be present for the whole sample here.

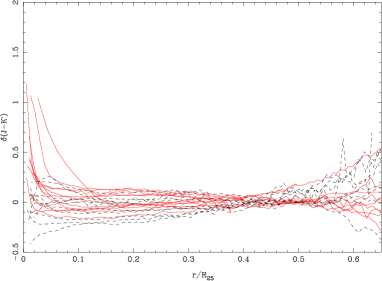
Color gradients as a function of distance to the center (in kpc) are shown in Fig. 7. Disk colors are similar for both samples. Central colors of control galaxies agree with those of typical spirals determined by Griersmith et al. (1982) and Forbes et al. (1992). We have computed a normalized color gradient (J-K’)(u) = (J-K’)(u) - (J-K’), where is the distance to the center in units of R25, =r/R25 so that (J-K’) is the color at a fixed relative distance of 0.5R25, which corresponds to the region were color gradients are reliable (see Paper I). This color gradient is plotted in Fig. 8 for active and control galaxies. Note than only three galaxies harbor bars longer than 0.5R25 (namely NGC 4785, NGC 5728 and NGC 151), which have been excluded from the plot, so Fig. 8 shows colors inside the bar region. It can be seen that (J-K’)(0.5) = 0 within the photometrical errors. (J-K’)(u) values depart from (J-K’)(u)=0 further out, mostly due to the background subtraction difficulties reported in Paper I. The differences in the behaviours of central regions of active and control galaxies are well visualized in this plot. In the innermost 0.1R25, active galaxies are generally redder than control galaxies (the reddest active galaxy is 1 magnitude redder than the reddest control galaxy). We also note that three control galaxies (namely NGC 2712, NGC 3835 and NGC 6155) show bluer colors inside 1 kpc, whereas none of the active galaxies becomes bluer in the center. Shaw et al. (1995) found that 19 out of a non-complete sample of 32 large barred galaxies show blue nuclei. Among them, only four were Seyferts. The result of non active galaxy with blue nucleus among isolated spirals should be confirmed with larger samples.

The average J-K’ colors of the central region (the innermost 200 pc) and of the primary bar are given in Table LABEL:decomp for all the galaxies of our sample that have a bar. The colors of the primary bars appear to be similar in active and non active galaxies, and also to be similar to the J-K’ value of the central region of the control sample. On the other hand, the central regions of the active sample have larger J-K’ values than the control one, in agreement with Kotilainen & Ward (1994). This difference cannot be explained as due to differential contributions of the nebular continuum in the J and K’ bands produced by the NLR of active galaxies. 111We have estimated that the central J-K’ colors change only by less than 10% if the color of each active galaxy is corrected for the nebular continuum contribution, estimated from the H or fluxes of the nucleus reported in the literature. It could be understood as coming either from an important contribution of active star forming regions usually found associated with the presence of the active nucleus in active galaxies (Rodríguez-Espinosa et al. 1987; Wilson 1988; Hunt & Giovanardi 1992) through the contribution of giants/supergiants (Shaw et al. 1995) or from dust re-emission in a dusty starburst or from the AGN illumination (Seygar & James 1999).
5 Discussion and Conclusions
Our analysis is intended to detect the differential properties between isolated active and non active spiral galaxies. We have considered here the large scale, global properties as well as the detailed morphology of the central regions, down to 100-300 pc. Our results show that there are no sizeable differences between active and non active isolated spiral galaxies in the volume limited sample considered here. By this, we mean that the global properties are similar, and none of the detected structures is exceptionally present or absent in one of the groups. Our results concerning the global properties, refer to a rather small sample and are in general agreement with previous ones, reinforcing our conclusion that hosts of isolated Seyfert galaxies have bulge and disk properties comparable to those of isolated non active spirals. In particular:
- both samples define the same (Kormendy) relation between and for bulges ;
- disk components also share the same properties. This contradicts the result by Hunt et al. (1999a, 1999b) that Seyfert disks are about 1 magnitude brighter than the disks of non active spirals. This discrepancy may be explained in terms of a possible contamination by interacting objects in their sample;
- bulge and disk scale lengths are correlated, with ;
- central colors of active galaxies are redder than the centers of non active spirals, most probably due to the AGN light re-emitted by the hot dust and/or to the presence of active star formation in circumnuclear regions.
It is generally admitted that the mechanism responsible for the transport towards the center and the possible onset of nuclear activity could be related with the presence of bars or other non axysimmetric structures. Regarding the primary bars, we know that the fraction of barred galaxies is not different among active and non active spiral galaxies (Mc Leod & Rieke 1995, Moles et al. 1995, Ho et al. 1997, Mulchaey & Regan 1997, Hunt & Malkan 1999). We notice that only one of the active galaxies in our sample, namely ESO 139-12, does not harbor a primary bar. This exception could however be of some interest since it raises the question of what kind of mechanism could produce non circular gas motions in an isolated object with no large-scale bar. Our results also show that primary bars have the same mean strength and length in both families.
The difference could reside in the properties of secondary central elongations (bars, inclined disks or rings, see Paper I). The complete analysis has to include photometric and kinematic information, in order to see what specific processes are taking place and whether they differ between active and control galaxies. But even with only the morphological information we report here, we can already derive some conclusions, keeping in mind the limitations imposed, in particular by the resolution reached by the IR images we have studied. Our result is that, down to scales of 100-300 pc, the detection rate of secondary bars is not different for active and control galaxies. Admittedly our sample is too small to allow strong statistical conclusions. But the fact is that the presence of secondary bars is not exceptional among non active galaxies. On the other hand, there is a number of active spirals in our sample with no detected secondary bar.
There remains the question of whether differences would be found at smaller scales, in particular those related to the presence of different nuclear structures. Even if this point is out of the scope of this paper, we note that HST images are only available for one of the galaxies in the control sample, so no comparison between active and non active galaxies can be attempted at this stage. In this respect, we stress that the feedback from numerical simulations is crucial to understand the mechanisms that are at the origin of the nuclear activity, and the scale at which they should operate. Thus, nuclear bars have been searched for in active galaxies because they were needed to provide the second step to transport gas from the circumnuclear region to the AGN (Shlosman et al. 1989; Friedli & Martinet 1993; Combes 1994; Heller & Shlosman 1994). As stated by Maiolino et al. (2000), the interpretation of the data depends on both the spatial resolution and the colours used to detect nuclear bars. In addition to this, the interpretation of the data within numerical model predictions is not straightforward. Regan & Mulchaey (1999) and Martini & Pogge (1999) indeed searched for straight dust lanes, considered as tracers of nuclear bars; however, the gas morphology strongly depends on the bar pattern speed, with straight shocks occurring only when the bar is rapidly rotating (Maciejewski & Sparke 1999). Therefore, slow rotating nuclear bars could also lead to the “spiraling” structure described by Regan & Mulchaey (1999) and Martini & Pogge (1999), therefore increasing the number of Seyfert galaxies hosting nuclear bars.
For Seyfert galaxies with no nuclear bar, different mechanisms have to be invoked, such as the presence of nuclear spirals (Martini & Pogge 1999; Englmaier & Shlosman 2000). Recent numerical simulations are beginning to predict an efficient enough transport of matter to the center in spiral galaxies with only a primary bar (Maciejewski, private communication), as should be the case for barred Seyferts with no nuclear bar.
The detailed analysis of such nuclear features requires in any case, in addition to the morphological information, a full kinematic characterization. In particular, in the case of NGC 6951 (Pérez et al. 2000) we have shown that no nuclear bar is detected in the HST images, but that there seems to be a nuclear spiral; this spiral structure is most probably residing in a nuclear disk, kinematically decoupled from the large-scale disk of the galaxy; the strong molecular gas accumulation could have destroyed a pre-existing nuclear bar and eventually may result in the dilution of the primary bar.222We note that the question of gas concentration cannot be addressed through molecular gas mapping since at this stage, no CO maps are available for the remaining galaxies in our samples. The kinematic characterization of the central regions is expected to shed light on the question of how the central kinematics are related to the fuelling mechanisms in active galaxies. In the same fashion as for NGC 6951, we are now analyzing in detail the morphological and kinematical properties of the galaxies in our sample.
Acknowledgements.
I. Márquez acknowledges financial support from the Spanish Ministerio de Educación y Ciencia (EX94-8826734). This work is financed by DGICyT grants PB93-0139, PB96-0921, PB98-0521 and PR95-329. Financial support to develop the present investigation has been obtained through the Junta de Andalucía, the French-Spanish grants HF1996-0104 and HF1998-0052, from the Picasso program of the French Ministry of Foreign Affairs, and from the Chilean-Spanish bilateral agreement CSIC-CONICYT 99CL0018. We also acknowledge financial support from INSU-CNRS for several observing trips.References
- (1) Andreadakis Y.C., Peletier, R.F., Balcells M., 1995, MNRAS 275, 874
- (2) Baggett W.E., Baggett S.M., Anderson K.S.J., 1998, AJ 116, 1626
- (3) Barnes J.E., Hernquist L.E., 1991, ApJ 370, 65
- (4) Bender R., Burstein D., Faber S.M., 1992, ApJ 399, 462
- (5) Chapelon S., Contini T., Davoust E., 1999, A&A 345, 81
- (6) Combes F., 1994 in Mass Transfer Induced Activity in Galaxies, ed. I. Shlosman (Cambridge University Press), 170
- (7) Courteau S., de Jong, R.S., Broeils A.H. 1996, ApJ 457, L73
- (8) de Jong R.S, van der Kruit P.C., 1994, A&AS 106, 451
- (9) de Jong R.S., 1996a, A&AS 313, 45
- (10) de Jong R.S., 1996b, A&AS 118, 557
- (11) Englmaier P., Shlosman I., 2000, ApJ 528, 677
- (12) Evans R., 1994, MNRAS 266, 511
- (13) Forbes D., Ward M., DePoy D., Boisson C., Smith M., 1992, MNRAS 254, 509
- (14) Friedli D., Martinet L., 1993, A&A 277, 27
- (15) Graham A.W., Prieto M., 1999, ApJ 524, L23
- (16) Griersmith D., Hyland A., Jones T., 1982, AJ 87, 1106
- (17) Heller C.H., Shlosman I., 1994, ApJ 424, 84
- (18) Ho L.C., Filippenko A.V., Sargent L.W., 1997, ApJ 487, 591
- (19) Hunt L.K., Giovanardi C., 1992, AJ 104, 1018
- (20) Hunt L.K., Malkan M.A., Salvati M. et al., 1997, ApJS 109, 229
- (21) Hunt L.K., Malkan M.A., 1999, ApJ 516, 660
- (22) Hunt L.K., Malkan M.A., Moriondo G., Salvati M., 1999a, ApJ 510, 637
- (23) Hunt L.K., Malkan M.A., Rush B. et al., 1999b, ApJS 125, 349
- (24) Jogee S., Kenney J.D.P., Smith B.J., 1999, ApJ 526, 665
- (25) Jungwiert B., Combes F., Axon D.J., 1997, A&AS 125, 479
- (26) Knapen J.H., Shlosman I., Peletier R.F., 2000, ApJ 529, 93
- (27) Kormendy J., 1977, ApJ 218, 333
- (28) Kotilainen J.K. , Ward M.J., 1994 MNRAS 266, 953
- (29) Maciejewsky W., Sparke L.S., 1999, MNRAS (in press)
- (30) Maiolino R., Rieke G.H., 1995, ApJ 454, 95
- (31) Maiolino R., Alonso-Herrero A., Anders S. et al., 1999, astro-ph/9910160
- (32) Márquez I., Moles M., 1994, AJ 108, 90
- (33) Márquez I., Moles M., 1996, A&AS 120, 1
- (34) Márquez I., Moles M., 1999, A&A 344, 421
- (35) Márquez I., Durret F., González Delgado R.M. et al., 1999, A&AS 140, 1 (Paper I)
- (36) Martinet L., Friedli D., 1997, A&A 323, 363
- (37) Martini P., Pogge R.W., 1999, AJ 118, 2646
- (38) McLeod K.K., Rieke G.H., 1995, ApJ 441, 96
- (39) Moles M., Márquez I., Pérez E., 1995, ApJ 438, 604
- (40) Moriondo G., Giovanardi C., Hunt L.K., 1998, A&AS 130, 81
- (41) Mulchaey J.S., Wilson A.S., 1996, ApJ 455, L17
- (42) Mulchaey J.S., Wilson A.S., Tsvetanov Z., 1996, ApJS 102, 309
- (43) Mulchaey J.S., Regan M.W., 1997, ApJL 482, L135
- (44) Mulchaey J.S., Regan M.W., Kundu A., 1997, ApJS 110, 299
- (45) Peletier R.F., Knapen J.H., Shlosman I., 1999 ApJS 125, 363
- (46) Pérez E., Márquez I., Marrero I. et al., 2000, A&A 353, 893
- (47) Regan M.W., Mulchaey J.S., 1999, AJ 117, 2676
- (48) Rodríguez-Espinosa J.M., Rudy R.J., Jones B., 1987, ApJ 312, 555
- (49) Seygar M.S., James P.A., 1999, MNRAS 299, 672
- (50) Shaw M.A., Combes F., Axon D.J., Wright G.S., 1993, A&A 273, 31
- (51) Shaw M.A., Axon D.J., Probst R., Gatley I., 1995, MNRAS 274, 369
- (52) Shlosman I., Frank J. and Begelman, M. 1989, Nature 338, 45
- (53) Simkin S.M., Su H.J, Schwarz M.P., 1980, ApJ 237, 404
- (54) Sofue Y., Yoshida S., Aoki T. et al., 1994, PASJ 46, 1
- (55) Véron-Cetty M.P., Véron P., 1993, “A catalogue of Quasars and Active Nuclei”, 6th Edition, ESO Scientific Report #13
- (56) Wilson A.S., 1988, A&A 206, 41
- (57) Wozniak H., Friedli D., Martinet L., Martin P., Bratschi P., 1995, A&AS 111, 115
- (58) Xanthopoulos E., 1996, MNRAS 280, 6
- (59) Yee H.K.C., 1983, ApJ 272, 473