The Highest Redshift Radio Galaxies
Abstract
At low redshifts powerful radio sources are uniquely associated with massive galaxies, and are thought to be powered by supermassive black holes. Modern 8m – 10m telescopes may be used used to find their likely progenitors at very high redshifts to study their formation and evolution.
Keywords: High redshift, radio galaxies, massive galaxies, black holes
1 Why the highest redshift radio galaxies are interesting
Within standard Cold Dark Matter scenarios the formation of galaxies is a hierarchical and biased process. Large galaxies are thought to grow through the merging of smaller systems, and the most massive objects form in over–dense regions, which will eventually evolve into the clusters of galaxies seen today (e.g. Ref. [1]). It has also been suggested that the first massive black holes may grow in similar hierarchical fashion together with their parent galaxies (e.g. Ref. [2]) or, because of time scale constraints, may precede galaxy formation and be primordial (e.g. Ref. [3]). It is therefore of great interest to find the progenitors of the most massive galaxies and their AGN (active massive black holes) at the highest possible redshifts and to study their properties and cosmological evolution.
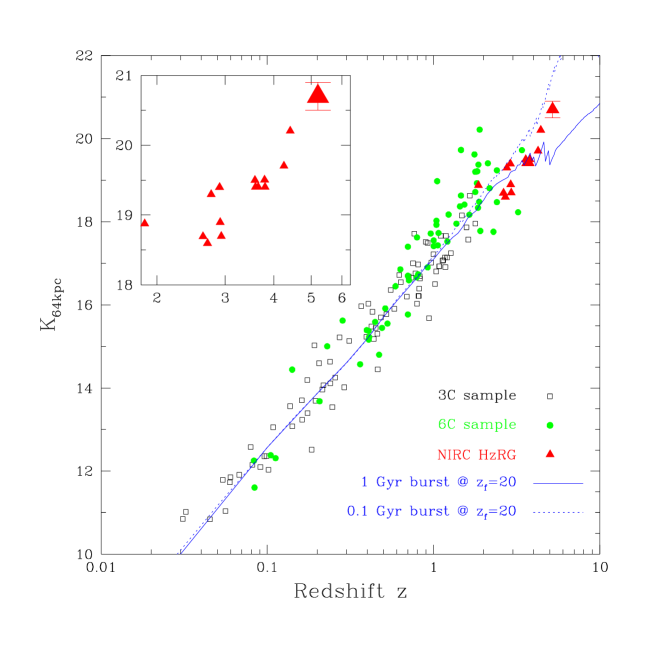
Radio sources are convenient beacons for pinpointing massive elliptical galaxies, at least up to redshifts (Ref. [4]; Ref. [5]). The near–infrared ‘Hubble’ relation for such galaxies appears to hold up to , despite large K–correction effects and morphological changes (Ref. [6]; Fig. 1). This suggests that radio sources may be used to find massive galaxies and their likely progenitors out to very high redshift through near–IR identification.
While optical, ‘color–dropout’ techniques have been successfully used to find large numbers of ’normal’ young galaxies (without dominant AGN) at redshifts even surpassing those of quasars and radio galaxies (Ref. [7]), the radio and near–infrared selection technique has the additional advantage that it is unbiased with respect to the amount of dust extinction. High redshift radio galaxies are therefore also important laboratories for studying the large amounts of dust (e.g. Ref. [8]) and molecular gas (Ref. [9]), which are observed to accompany the formation of the first forming massive galaxies. Indeed, a significant part of the scientific rationale for building future large mm-arrays is based on the expectation that to understand galaxy formation will ultimately require understanding their cold gas and dusty environments.
Finally, it has been claimed that the (co–moving) space densities of the most powerful radio galaxies and quasars were much higher near , but that they drop off precipitously at even higher redshifts (Ref. [10]; Ref. [11]). However, using recently completed studies of moderately faint radio galaxies (Ref. [12]) it has been argued that here is no such evidence for a redshift cut–off and that these previous results have been biased due to unknown radio K–correction, and thus radio spectral index, trends and associated selection effects.
2 How to find the Highest Redshift Radio Galaxies
The near–infrared ‘Hubble’ relation for radio galaxies (Fig. 1) provides a convenient tool for finding radio galaxies at ever larger redshifts. This was shown convincingly for the first time by Lilly (Ref. [13]) who found that one of the faintest near-IR radio source identifications in a complete, flux limited sample of objects, B3 0924+34, was a redshift .
Unfortunately in complete, flux–limited samples the vast majority of the sources will be relatively nearby, or at only modest redshifts. Lilly (Ref. [13]) in his survey found only 1 / 70 radio galaxies at , and McCarthy et al. in a similar but times larger survey also only found one (Ref. [16]). However, one can pre-select very good HzRG candidates from the radio catalogs, before even going to the telescope, by choosing sources with ultra–steep radio spectra or ‘red radio color’. It is already known more than 20 years that the identification fraction of radio sources on the POSS plates decreases with increasing spectral index (Ref. [17]). One had to wait for the much more sensitive CCD detectors before further progress in identifying ultra-steep spectrum (USS) sources could be made. One of the first HzRGs which was then found, using the Kitt Peak 4m, was the radio galaxy 4C41.17, at (Ref. [18]). This source was the record holder for many years, until it was by-passed, using the same USS method, by 8C 1435+635 (; Ref. [19]) and 6C 0140+326 (; Ref. [20]).
Together with graduate student C. De Breuck and colleagues at Leiden Observatory we therefore defined the ‘ultimate’ USS source sample by using several new, large radio surveys (De Breuck et al. 2000 [astro-ph/0002297]). The sample consists of 669 sources with extremely steep radio continuum spectra (; Table 1; Fig. 3), at 10 – 100 times lower flux density limits than has been possible before (Ref. [21]; Ref. [22]; Ref. [23]). To identify these sources we first looked at the POSS and found that approximately 15% of the sources could be identified, usually with moderately bright galaxies in galaxy clusters. This identification fraction appears to be independent of spectral index (Fig. 3), at least for , in support of the idea that these are mostly foreground objects.
| Sample | Density | Spectral Index | Flux Limit | # of Sources |
|---|---|---|---|---|
| sr-1 | () | mJy | ||
| WN | 151 | 10 | 343 | |
| TN | 48b | 10 | 268 | |
| MP | 26 | S; S | 58 |
| a See De Breuck et al. 2000 (astro-ph/0002297) for catalogs used and other details. |
| b Due to the characteristics of the Texas survey, the TN sample is only complete. |
The USS selection proved to be extremely efficient. Attempts to obtain optical identifications of USS sources using 3m–4m–class telescopes () were largely unsuccessful. Also near–IR imaging would be very difficult, given the typically expected values of high redshift radio galaxies . We therefore decided to entirely skip the optical identification program at Lick Observatory and go straight to near–IR imaging at the Keck I telescope.
3 Morphological evolution of the highest redshift radio galaxies
When we started our near–IR imaging program at Keck our first order of business was to observe high redshift radio galaxies with known redshifts to investigate their morphological evolution and to obtain more accurate photometry to study the Hubble diagram at the highest redshifts. We obtained near–IR images of 15 HzRGs with with the Near Infrared Camera (NIRC, Ref. [24]) at the Keck I telescope. The images show that there is strong morphological evolution at rest–frame optical (Å) wavelengths (Ref. [14]; Fig. 4). At the highest redshifts, , the rest–frame visual morphologies exhibit structure on at least two different scales: relatively bright, compact components with typical sizes of (10 kpc) surrounded by large–scale ( 50 kpc) diffuse emission. The brightest components are often aligned with the radio sources, and their individual luminosities are to For comparison, present–epoch L⋆ galaxies and, perhaps more appropriately, ultraluminous infrared starburst galaxies, have, on average, . The total, integrated rest–frame B–band luminosities are magnitudes more luminous than present epoch galaxies.
At lower redshifts, , the rest–frame optical morphologies become smaller, more centrally concentrated, and less aligned with the radio structure. Galaxy surface brightness profiles for the HzRGs are much steeper than those of at . We attempted to fit the surface brightness profiles with a de Vaucouleurs r1/4 law and with an exponential law, the forms commonly used to fit elliptical and spiral galaxy profiles, respectively. We demonstrate the fitting for our best resolved object at , 3C 257 at (Fig. 4). Within the limited dynamical range of the data, both functional forms fit the observed profiles—neither is preferred. Interestingly, despite this strong morphological evolution the Hubble diagram for the most luminous radio galaxies remains valid even at the highest redshifts, where a large fraction of the K-band continuum is due to a radio–aligned component.
Having established that the diagram for high redshift radio galaxies holds even at the highest known redshifts we embarked on our identification program of USS selected sources. Our typical method of observation would be to begin with 16 x 1 minute exposures (1 minute consisting of 2 or 3 co–added frames), start a second 16 x 1 minute run while reducing the first set of observations using DIMSUM. (DIMSUM is the Deep Infrared Mosaicing Software package, developed by P. Eisenhardt, M. Dickinson, A. Stanford, and J. Ward, which is available as a contributed package in IRAF.) If we could identify our target we would break off our second observation, or, if the identification was faint, would let it finish and then go on to the next target. This ‘on–line’ way of observing turned out to be very efficient and resulted in a 100% identification rate with good photometric magnitudes and has provided excellent high redshift radio galaxy candidates using the Hubble diagram (Fig. 1; Fig. 5). Often more than a dozen near–IR identifications could be obtained this way in a single night.
4 Spectroscopy of the highest redshift radio galaxies
As with our near–IR imaging program, our first spectroscopic observations, using the Low Resolution Imaging Spectrograph (LRIS, Ref. [25]) were made of high redshift radio galaxies with known redshifts. The main purpose, initially, was to determine the origin of the radio–aligned optical / near–IR features using spectro–polarimetry. As is now well–known the rest–frame optical continua of high redshift radio galaxies are often clumpy and aligned with their associated radio sources (Ref. [26]; Ref. [27]). This suggested that there must be a causal connection between their optical morphological appearance and the collimated outflow and/or ionizing radiation from their AGN. The most popular explanations for such an alignment effect are scattered light from hidden or mis–aligned quasars, jet–induced star formation or nebular continuum emission. Evidence for each of these processes has been found. In particular, and most high redshift radio galaxies are strongly polarized, indicating that a large fraction of the optical continuum is due to scattered light from hidden or mis–aligned quasars (Ref. [28]; Ref. [29];Ref. [30]). However, deep spectropolarimetry observations of two radio galaxies (4C 41.17 at and 6C J1908+722 at ) show no polarized continua but instead show evidende for absorption lines from young hot stars (Ref. [29]). It suggests that at the highest redshifts radio galaxy hosts are dominated by massive starbursts, possibly induced by radio jets (Ref. [31];Ref. [32]) and not by scattered light from their AGN.
Subsequently our spectroscopic observations focused on the newly identified USS high redshift radio galaxy candidates. At the present time we have observed and analyzed 34 USS high redshift radio galaxies with the following results. Only 5 of the sources have , 8 have , 9 have and 3 sources have , including one at . At least 3 sources were not detected in optical continuum, despite 1 hr or longer integrations with LRIS. All we know of these objects is that they are detected in the near-IR at , and have a radio source identified with them. They may be extremely obscured, or at record high redshifts, with Ly- redshifted to near-IR wavelengths (). Future observations with near–IR spectrographs may tell. We also found 6 sources with only a continuum detection and no emission–lines. These were all extremely compact USS sources, and may be moderately high redshift () BL Lac objects, ‘emission–line free quasars’ (cf. Ref. [33]), or even pulsars (which typically have , Ref. [34], and are faint optically).
The high redshift radio galaxy spectra, when obtained with sufficient spectral resolution, show nearly all very strong blueward asymmetries in the Ly- emission lines (Ref. [29]; Ref. [35]; De Breuck et al. 2000 (in preparation); Fig. 6. This is almost certainly due to the presence of cold gas (HI) and dust in the vicinity of the radio galaxies, not just because of cosmological Ly- ‘forest’ absorption in the foreground (although this will contribute as well). Spatially resolved emission line regions show that this absorption can occur over the entire region (up to 50 kpc; Fig. 6), and is strongest in the smallest radio sources (Ref. [35]). There is much additional evidence for the presence of large amounts of cold gas in dust in high redshift radio galaxies . Many of the highest redshift radio galaxies have been detected at sub–mm wavelengths, both in continuum (e.g.Ref. [8]; Archibald et al. 2000 [astro-ph/0002083]) and molecular lines (e.g.Ref. [9]). These observations indicate total dust masses of 108 – 109 , and star formation rates of more than 1000 /yr. Thus high redshift radio galaxies indeed appear to be massive forming systems.
One object deserves special mention: 6C J1908+722 at (Ref. [29]; Fig. 8). The source shows very broad absorption lines in several of its UV resonant lines (CIV, SIV, NV, Ly- ; Fig. 8). This was interpreted as being caused by outflow, similar to the classical Broad Absorption Line quasars. However, it is interesting to note that this Broad Absorption Line Radio Galaxy (BALRAG) is hosted by a Ultra Luminous Infrared Galaxy with in dust, in molecular gas, and has an estimated star formation rate of /yr (Ref. [9]). The observed velocity range of the gas is large (530 ), and could be even larger: for another high redshift radio galaxy , 4C60.07 at , Papadopoulos et al. find that the molecular gas is distributed over at least two major components, with a total velocity range .
Thus it could very well be that the broad, rest–frame UV, absorption lines in 6C J1908+722 may be due to absorption within the parent galaxy. The large BAL velocity range (Fig. 8) could then be caused by a number of cold gas components in the foreground to 6C J1908+722, and which could be falling in or merging with the galaxy. In that case one would expect that the BAL system would be resolved at higher spectral resolution and observations at Keck to test this are planned.
5 The Highest Redshift Radio Galaxies
5.1 TN J13381942 at
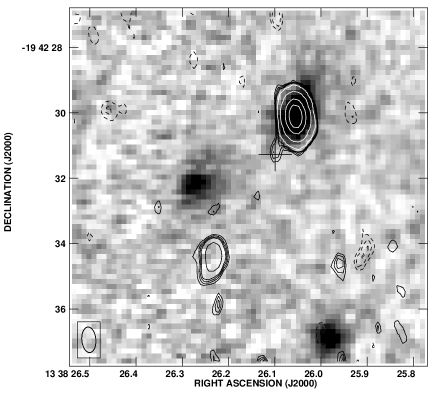
The first USS radio galaxy discovered by us was TN J13381942. The initial identification was made with the ESO 3.6m at R–band, and subsequent spectroscopy with that same telescope showed that the radio galaxy has a redshift of , based on a strong detection of Ly- , and weak confirming C 1549 and He 1640 (Ref. [36]).
Subsequently we obtained a deep K–band image (rest–frame B–band) at Keck, shown in Fig. 10 overlaid with a VLA radio image (Ref. [36]). The Ly- and rest–frame optical emission appear co–spatial with the brightest radio hotspot of this very asymmetric radio source. Such asymmetric radio sources are not uncommon, even in the local Universe, and are usuallly thought to be due to strong interaction of one of its radio lobes with very dense gas. A similar asymmetric radio/optical/emission-line morphology has also been seen in the radio galaxy 4C41.17, where it has been interpreted as being caused by jet-induced star formation (Ref. [31];Ref. [32]; Bicknell et al. 2000 [astro-ph/9909218]).
With the Keck K-band the identification and astrometry for TN J13381942 secured we next obtained a high signal–to–noise, medium resolution (5.5 Å FWHM) spectrum using the VLT Antu telescope (Ref. [36]; Fig. 10). The spectrum of TN J13381942 is dominated by a bright Ly- line ( = 210Å) which shows deep and broad ( ) blue–ward absorption, and relatively bright (Jy) UV-continuum. In fact, at optical wavelengths, TN J13381942 turned out to be the most luminous of its kind (Table 2). If all the UV continuum in TN J13381942 would be due to young O–B stars the implied SFR, based on the optical data alone and without correction for extinction, would be several hundred /yr, similar to 4C41.17. TN J13381942 might be another example of a very HzRG in which jet-induced star formation might occur.
The Ly- is spatially extended by 4 (30 kpc) and has a spectral profile that is very asymmetric with a deficit towards the blue. This blue-ward asymmetry is probably due to absorption of the Ly- photons by cold gas in a turbulent halo surrounding the radio galaxy. Using a simple model, and fitting the Ly- profile with a Gaussian emission function and a single Voigt absorption function, De Breuck et al. estimate that the neutral hydrogen column density must be in the range cm-2, and a total mass of .
The bright optical continuum and high S/N data also allowed a measurement of the Lya forest continuum break ( Ly- ’discontinuity’, ), and the Lyman limit. The measured value, , is lower than the values found for quasars at comparable redshifts. This might perhaps be due due to a bias towards large introduced in high–redshift quasar samples that are selected on the basis of large color gradients. The true space density of optically selected quasars, – and Lyman break galaxies –, may have been underestimated and the average HI column density along cosmological lines of sight might have been overestimated. Because of their radio-based, non–color selection, radio galaxies may be excellent objects for investigating statistics.
5.2 TN J09242201 at
TN J09242201 is one of the steepest spectrum sources in our USS sample () and therefore was one of our primary targets for near–IR identification. A deep K–band image at Keck showed indeed a very faint (), multi–component object at the position of the small (1.2) radio source (Fig. 12). The expected redshift on the basis of the diagram was , and spectroscopic observations at Keck showed that this was indeed the case (Fig. 12), based on a single emission line at Å which we identified as Ly- at (Ref. [6]; none of the galaxies have more than one line detection).
Among all radio selected high redshift radio galaxies TN J09242201 is fairly typical in radio luminosity, equivalent width and velocity width (Table 2). It does have the steepest radio spectrum, consistent with the relationship for powerful radio galaxies (e.g. Ref. [37]), and also has the smallest linear size. The latter may be evidence of its ‘inevitable youthfulness’ or a dense confining environment, neither of which would be surprising because of its extreme redshift (Ref. [38]; Ref. [35]). Among the radio selected high redshift radio galaxies TN J09242201 appears underluminous in Ly- , together with 8C 143563, which might be caused by absorption in an exceptionally dense cold and dusty medium. Evidence for cold gas and dust in several of the most distant high redshift radio galaxies has been found from sub–mm continuum and CO–line observations (e.g.Ref. [8]; Ref. [9]).
The second highest redshift radio galaxy currently known listed in Table 2 is VLA J123642+621331 at (Ref. [39]). This source was not USS selected and provides a view on the possible selection effects of our USS high redshift radio galaxies . The source is an asymmetric double and although its radio luminosity is about a factor 1000 times lower than that of its much more luminous brothers at similar redshifts, it is still radio loud, with a radio luminosity close to the FRI / FRII break at 408 MHz ( erg s-1 Hz-1). Its radio spectrum is steep (, using the flux densities given by Waddington et al. ), but not as steep as our USS selected high redshift radio galaxies , and the Ly- luminosity is a factor 5 – 10 times less. Apart from the luminosity these properties are not hugely different from expected on the basis of radio selection. It suggests that less extreme steep spectrum selected samples () at much lower flux densities ( mJy) might be used to find many more high redshift radio galaxies at very high redshifts, although with lower efficiency, we suspect, than USS selected samples.
| Name | a | a | a | Size a | Ref. b | |||
|---|---|---|---|---|---|---|---|---|
| TN J09242201 | 5.19 | 1.3 | 7.5 | 1.63 | 115 | 1500 | 8 | WvB99 |
| VLA J1236+6213 | 4.42 | 0.2 | 0.0035 | 0.96 | 50 | 440 | Wad99 | |
| 6C 0140326 | 4.41 | 16 | 1.3 | 1.15 | 700 | 1400 | 19 | DeB00 |
| 8C 143563 | 4.25 | 3.2 | 11 | 1.31 | 670: | 1800 | 28 | Spin95 |
| TN J13381942 | 4.11 | 25 | 2.3 | 1.31 | 200 | 1000 | 37 | DeB99 |
| 4C 41.17 | 3.798 | 12 | 3.3 | 1.25 | 100 | 1400 | 99 | Dey97 |
| 4C 60.07 | 3.79 | 16 | 4.1 | 1.48 | 150 | 2900: | 65 | Röt97 |
| a In units of erg s-1 (), erg s-1 Hz-1 (), restframe velocity width km , and linear size in kpc (respectively) |
| b Most recent references quoted only: WvB99 = Ref. [6]; Wad99 = Ref. [39]; DeB00 = De Breuck et al. 2000 (in preparation); Spin95 = Ref. [40]; DeB99 = Ref. [36]; Dey97 = Ref. [31]; Röt97 = Ref. [37]. |
Our observations of TN J09242201 extend the Hubble diagram for powerful radio galaxies to , as shown in Fig. 1. Simple stellar evolution models are shown for comparison. Despite the enormous –correction effect (from at to at ) and strong morphological evolution (from radio–aligned to elliptical structures), the diagram remains a powerful phenomenological tool for finding radio galaxies at extremely hy redshifts. Deviations from the relationship may exist Ref. [15]; but see Ref. [41]), and scatter in the values appears to increase with redshift. Part of this may be due to lack of S/N or contamination by strong line emission in some of the measurements.
The clumpy morphology resembles that of other high redshift radio galaxies (Ref. [32]; Ref. [42]) and if it is dominated by star light we derive a SFR of 200 M⊙ yr-1, without any correction for extinction, which may be a factor of several. TN J09242201 may be a massive, active galaxy in its formative stage, in which the SFR is boosted by jet–induced star formation. For comparison other, ‘normal’ star forming galaxies at have 10 – 30 times lower SFR ( /yr).
At the time of its discovery, December 1998, TN J09242201 was the most distant AGN known, surpassing even quasars for the first time since their discovery 36 years ago. The recent, serendipitous discovery of a color–selected quasar (Stern et al. 2000 [astro-ph/0002338]) returned the record to optically selected quasars. The presence of AGN at such early epochs in the Universe (1 Gyr in most cosmogonies) poses interesting challenges to common theoretical wisdom, which assumes, at least for radio loud AGN, that they are powered by massive (billion solar mass), active black holes. The question how these can form so shortly after the putative Big Bang may prove even more challenging then that of the formation of galaxies (e.g.Ref. [3]).
ACKNOWLEDGMENTS
WvB thanks his many collaborators for stimulating discussions and fun observing runs. Special thanks to C. De Breuck, who has done much of the work as part of his thesis research, and A. Dey for permission to use Fig. 6, Fig. 8 and Fig. 8. The work by W.v.B. at the University of California Lawrence Livermore National Laboratory was performed under the auspices of the US Department of Energy under contract W-7405-ENG-48. W.v.B. also acknowledges support from several NASA grants in support of high redshift radio galaxy research with HST.
References
- [1] S. D. M. White, “The physical origin of galaxy scaling relations,” in Galaxy Scaling Relations: Origins, Evolution and Applications, pp. 3+, 1997.
- [2] G. Kauffmann and M. Haehnelt, “A unified model for the evolution of galaxies and quasars,” MNRAS 311, pp. 576–588, jan 2000.
- [3] A. Loeb, “Cosmological formation of quasar black holes,” ApJ 403, pp. 542–551, feb 1993.
- [4] S. J. Lilly and M. S. Longair, “Stellar populations in distant radio galaxies,” MNRAS 211, pp. 833–855, dec 1984.
- [5] P. N. Best, M. S. Longair, and H. J. A. Rottgering, “Hst, radio and infrared observations of 28 3cr radio galaxies at redshift z approximately equal to 1. ii - old stellar populations in central cluster galaxies,” MNRAS 295, pp. 549+, apr 1998.
- [6] W. J. M. van Breugel, C. D. Breuck, S. A. Stanford, D. Stern, H. J. A. Rottgering, and G. K. Miley, “A radio galaxy at z = 5.19,” ApJL 518, pp. L61–L64, jun 1999.
- [7] R. J. Weymann, D. Stern, A. Bunker, H. Spinrad, F. H. Chaffee, R. I. Thompson, and L. J. Storrie-Lombardi, “Keck spectroscopy and nicmos photometry of a redshift z = 5.60 galaxy,” ApJ 505, pp. L95–L98, oct 1998.
- [8] R. J. Ivison, J. S. Dunlop, D. H. Hughes, E. N. Archibald, J. A. Stevens, W. S. Holland, E. I. Robson, S. A. Eales, S. Rawlings, A. Dey, and W. K. Gear, “Dust, gas, and evolutionary status of the radio galaxy 8c 1435+635 at z = 4.25,” ApJ 494, pp. 211+, feb 1998.
- [9] P. P. Papadopoulos, H. J. A. Rottgering, P. P. van Der Werf, S. Guilloteau, A. Omont, W. J. M. van Breugel, and R. P. J. Tilanus, “Co (4-3) and dust emission in two powerful high-z radio galaxies, and co lines at high redshifts,” ApJ 528, pp. 626–636, jan 2000.
- [10] J. S. Dunlop and J. A. Peacock, “The redshift cut-off in the luminosity function of radio galaxies and quasars,” MNRAS 247, pp. 19+, nov 1990.
- [11] P. A. Shaver, J. V. Wall, K. I. Kellermann, C. A. Jackson, and M. R. S. Hawkins, “Decrease in the space density of quasars at high redshift,” Nature 384, pp. 439–441, 1996.
- [12] M. J. Jarvis, S. Rawlings, C. J. Willott, K. M. Blundell, S. Eales, and M. Lacy, “No evidence for a ‘redshift-cutoff’ for the most powerful classical double radio sources,” in The Hy-Redshift Universe: Galaxy Formation and Evolution at High Redshift, A. J. Bunker and W. J. M. van Breugel, eds., ASP Conf. Series 193, pp. 90+, 1999.
- [13] S. J. Lilly, “Discovery of a radio galaxy at a redshift of 3.395,” ApJ 333, pp. 161–167, oct 1988.
- [14] W. J. M. van Breugel, S. A. Stanford, H. Spinrad, D. Stern, and J. R. Graham, “Morphological evolution in high-redshift radio galaxies and the formation of giant elliptical galaxies,” ApJ 502, pp. 614+, aug 1998.
- [15] S. Eales, S. Rawlings, D. Law-Green, G. Gotter, and M. Lacy, “A first sample of faint radio sources with virtually complete redshifts. i - infrared images, the hubble diagram and the alignment effect,” MNRAS 291, pp. 593+, nov 1997.
- [16] P. J. McCarthy, V. K. Kapahi, W. J. M. van Breugel, S. E. Persson, R. Athreya, and C. R. Subrahmanya, “The molonglo reference catalog/1 jansky radio source survey. i. radio galaxy identifications,” ApJS 107, pp. 19+, nov 1996.
- [17] A. G. G. M. Tielens, G. K. Miley, and A. G. Willis, “Westerbork observations of 4c sources with steep radio spectra,” A&ASup 35, pp. 153+, feb 1979.
- [18] K. C. Chambers, G. K. Miley, and W. J. M. van Breugel, “4c 41.17 - a radio galaxy at a redshift of 3.8,” ApJ 363, pp. 21–39, nov 1990.
- [19] M. Lacy, G. Miley, and S. R. et. al., “8c 1435+635: a radio galaxy at z=4.25,” MNRAS 271, pp. 504–512, nov 1994.
- [20] S. Rawlings, M. Lacy, K. M. Blundell, S. A. Eales, A. J. Bunker, and S. T. Garrington, “A radio galaxy at redshift 4.41.,” Nature 383, pp. 502–505, 1996.
- [21] K. C. Chambers, G. K. Miley, W. J. M. van Breugel, and J. S. Huang, “Ultra–steep-spectrum radio sources. i. 4c objects,” ApJS 106, pp. 215+, oct 1996.
- [22] H. J. A. Rottgering, M. Lacy, G. K. Miley, K. C. Chambers, and R. Saunders, “Samples of ultra-steep spectrum radio sources,” A&ASup 108, pp. 79–141, nov 1994.
- [23] K. M. Blundell, S. Rawlings, S. A. Eales, G. B. Taylor, and A. D. Bradley, “A sample of 6c radio sources designed to find objects at redshift z 4 - i. the radio data,” MNRAS 295, pp. 265–279, apr 1998.
- [24] K. Matthews and B. T. Soifer, “The near infrared camera on the w. m. keck telescope,” Experimental Astronomy 3, pp. 77–84, 1994.
- [25] J. B. Oke, J. G. Cohen, M. Carr, J. Cromer, A. Dingizian, F. H. Harris, S. Labrecque, R. Lucinio, W. Schaal, H. Epps, and J. Miller, “The keck low-resolution imaging spectrometer,” PASP 107, pp. 375+, apr 1995.
- [26] P. J. McCarthy, W. J. M. van Breugel, H. Spinrad, and S. Djorgovski, “A correlation between the radio and optical morphologies of distant 3cr radio galaxies,” ApJL 321, pp. L29–L33, oct 1987.
- [27] K. C. Chambers, G. K. Miley, and W. J. M. van Breugel, “Alignment of radio and optical orientations in high-redshift radio galaxies,” Nature 329, pp. 604–606, oct 1987.
- [28] A. Cimatti, S. di Serego Alighieri, J. Vernet, M. H. Cohen, and R. A. E. Fosbury, “No signs of starbursts in z 2.5 radio galaxies,” in The Most Distant Radio Galaxies, H. J. A. Rottgering, P. N. Best, and M. D. Lehnert, eds., KNAW Colloq 49, pp. 195+, 1999.
- [29] A. Dey, “The early history of powerful radio galaxies,” in The Most Distant Radio Galaxies, H. J. A. Rottgering, P. N. Best, and M. D. Lehnert, eds., KNAW Colloq 49, pp. 19+, 1999.
- [30] J. Vernet, R. A. E. Fosbury, M. Villar-Martin, M. H. Cohen, S. di Serego Alighieri, and A. Cimatti, “Keck spectropolarimetry of radio galaxies,” in The Hy-Redshift Universe: Galaxy Formation and Evolution at High Redshift, A. J. Bunker and W. J. M. van Breugel, eds., ASP Conf. Series 193, pp. 102+, 1999.
- [31] A. Dey, W. J. M. van Breugel, W. D. Vacca, and R. Antonucci, “Triggered star formation in a massive galaxy at z = 3.8: 4c 41.17,” ApJ 490, pp. 698+, dec 1997.
- [32] W. J. M. van Breugel, A. S. Stanford, and A. D. et. al., “Induced star formation and morphological evolution in very high redshift radio galaxies,” in The Most Distant Radio Galaxies, H. J. A. Rottgering, P. N. Best, and M. D. Lehnert, eds., KNAW Colloq 49, pp. 49+, 1999.
- [33] X. Fan, M. A. Strauss, and J. E. G. et. al., “The discovery of a high-redshift quasar without emission lines from sloan digital sky survey commissioning data,” ApJL 526, pp. L57–L60, dec 1999.
- [34] D. L. Kaplan, J. J. Condon, Z. Arzoumanian, and J. M. Cordes, “Pulsars in the nrao vla sky survey,” ApJS 119, pp. 75–82, nov 1998.
- [35] R. van Ojik, H. J. A. Rottgering, G. K. Miley, and R. W. Hunstead, “The gaseous environments of radio galaxies in the early universe: kinematics of the lyman-a emission and spatially resolved h i absorption,” A&A 317, pp. 358–384, jan 1997.
- [36] C. D. Breuck, W. J. M. van Breugel, D. Minniti, G. K. Miley, H. Rottgering, S. A. Stanford, and C. Carilli, “Vlt spectroscopy of the z=4.11 radio galaxy tn j13381942,” A&A 352, pp. L51–L56, dec 1999.
- [37] H. J. A. Rottgering, R. van Ojik, G. K. Miley, K. C. Chambers, W. J. M. van Breugel, and S. de Koff, “Spectroscopy of ultra-steep spectrum radio sources: a sample of z 2 radio galaxies,” A&A 326, pp. 505–527, oct 1997.
- [38] K. M. Blundell and S. Rawlings, “The inevitable youthfulness of known high-redshift radio galaxies,” Nature 399, pp. 330–332, may 1999.
- [39] I. Waddington, R. A. Windhorst, S. H. Cohen, R. B. Partridge, H. Spinrad, and D. Stern, “Nicmos imaging of the dusty microjansky radio source vla j123642+621331 at z = 4.424,” ApJL 526, pp. L77–L80, dec 1999.
- [40] H. Spinrad, A. Dey, and J. R. Graham, “Keck observations of the most distant galaxy: 8c 1435+63 at z = 4.25,” ApJL 438, pp. L51–L54, jan 1995.
- [41] P. McCarthy, “Recent results from the mrc/1jy survey,” in The Most Distant Radio Galaxies, H. J. A. Rottgering, P. N. Best, and M. D. Lehnert, eds., KNAW Colloq 49, pp. 5+, 1999.
- [42] L. Pentericci, H. J. A. Rottgering, and G. K. M. et. al., “Hst images of the extremely clumpy radio galaxy 1138-262 at z =2.2,” ApJ 504, pp. 139+, sep 1998.


This figure is available as fig4.jpg
This figure is available as fig5.jpg
This figure is available as fig6.jpg


This figure is available as fig11.jpg
