A Dust Cloud of Ganymede Maintained by Hypervelocity Impacts of Interplanetary Micrometeoroids
H. Krüger111Correspondence to: Harald Krüger, Postfach 10 39 80, 69029 Heidelberg, Germany, Tel.: +49-6221-516-563, Fax: +49-6221-516-324, E-Mail: Harald.Krueger@mpi-hd.mpg.de, A. V. Krivov2,3, E. Grün1
| 1) | Max-Planck-Institut für Kernphysik, 69029 Heidelberg, Germany |
| 2) | Max-Planck-Institut für Aeronomie, 37191 Katlenburg-Lindau, Germany |
| 3) | On leave from Astronomical Institute, St. Petersburg University, |
| 198904 St. Petersburg, Russia |
Abstract
A dust cloud of Ganymede has been detected by in-situ measurements with the dust detector onboard the Galileo spacecraft. The dust grains have been sensed at altitudes below five Ganymede radii (Ganymede radius = ). Our analysis identifies the particles in the dust cloud surrounding Ganymede by their impact direction, impact velocity, and mass distribution and implies that they have been kicked up by hypervelocity impacts of micrometeoroids onto the satellite’s surface. We calculate the radial density profile of the particles ejected from the satellite by interplanetary dust grains. We assume the yields, mass and velocity distributions of the ejecta obtained from laboratory impact experiments onto icy targets and consider the dynamics of the ejected grains in ballistic and escaping trajectories near Ganymede. The spatial dust density profile calculated with interplanetary particles as impactors is consistent with the profile derived from the Galileo measurements. The contribution of interstellar grains as projectiles is negligible. Dust measurements in the vicinities of satellites by spacecraft detectors are suggested as a beneficial tool to obtain more knowledge about the satellite surfaces, as well as dusty planetary rings maintained by satellites through the impact ejecta mechanism.
Keywords: a. Asteroids, comets, meteoroids
1 Introduction
Since December 1995 the Galileo spacecraft has been on a bound orbit about Jupiter and performs regular close flybys of the Galilean satellites. With the dust detector onboard (Grün et al., 1992), at least three populations of dust have been identified in the Jovian system (Grün et al., 1997, 1998): 1) Streams of ten-nanometre grains were detected throughout the Jovian magnetosphere and were recognizable even in interplanetary space out to 2 AU from Jupiter (Grün et al., 1993). Recently, it has been shown that these streams originate from Io, the ultimate source probably being the most powerful of its volcanic plumes (Graps et al., 2000). 2) Bigger micrometre-sized particles form a tenuous dust ring between the Galilean satellites (Colwell et al., 1998; Thiessenhusen et al., 2000; Krivov et al., 2000). 3) In the close vicinity of the Galilean satellites (i.e. within several satellite radii) strong sharp peaks were seen in the dust impact rate. The spatial location of the events, as well as the impact velocities, establish a genetic link between the detected dust grains and the satellites. Here we analyse this third population of dust in the close vicinity of the moons. First results have been published by Krüger et al. (1999a). In this paper we present the detailed data analysis and the model for a dust cloud surrounding Ganymede.
The most important question addressed here is: what is the physical mechanism that ejected the grains off the moons? Were these particles kicked up by hypervelocity impacts, presumably of interplanetary micrometeoroids or tiny interstellar projectiles, onto the surface of the satellites? If this is true, we can treat the dust measurements made by Galileo at the Galilean satellites as a unique natural impact experiment which, for the first time, leads to the detection of the ejecta of hypervelocity impacts in space. This process has been suggested as being responsible for maintaining both the Jovian ring (Morfill et al., 1980; Horányi and Cravens, 1996; Ockert-Bell et al., 1999, Burns et al., 1999) and Saturn’s E ring (Horányi et al., 1992; Hamilton and Burns, 1994). Our in-situ measurements in space give us a chance to gain more insight into the fundamental properties of hypervelocity impacts, for which the laboratory experiments on Earth still do not yield a comprehensive picture.
Between December 1995 and April 2000 the Galileo spacecraft had a total of 26 targeted encounters with all 4 Galilean satellites: 4 with Io, 11 with Europa, 4 with Ganymede and 7 with Callisto. In addition to the 4 Ganymede flybys which occurred in 1996 and 1997 (encounters G1, G2, G7 and G8) two more are planned for the year 2000 (G28 and G29). Due to the spacecraft orientation, however, the population of grains existing in the close vicinity of Ganymede will not be detectable during these two encounters. Hence, the data set of dust particles detected with Galileo during flybys at Ganymede will not be extended in the future. Furthermore, the analysis of the data obtained from the whole Galileo mission shows that the mass and velocity calibration of the dust instrument is subject to a radiation-related ageing effect which affects data obtained after 1996 and which is still under investigation. For these two reasons, we here focus our attention on the dust grains detected near Ganymede during the four close encounters with this satellite. Detailed investigations of the dust clouds surrounding Europa and Callisto will be the subject of a future paper.
We begin with a description of the Galileo data and their processing (Section 2). Section 3 presents the impact model that we use to interpret the data. A comparison of the data and modelling results is made in Section 4. Section 5 contains a summary and discussion of our findings.
2 Dust impacts detected close to Ganymede
Dust impact detection
The dust detector onboard the Galileo spacecraft is a multi-coincidence impact ionisation dust detector which measures submicrometre- and micrometre-sized dust particles (Grün et al., 1992; 1995). The instrument is identical with the dust detector onboard Ulysses.
For each dust grain hitting the detector target three independent measurements of the impact-created plasma cloud are used to derive the impact speed and the mass of the particle. The charge released upon impact on the target depends on the mass and the speed of the impacting grain according to: . The calibrated velocity range of the instrument is 2 to . The coincidence times of the three charge signals are used to classify each impact into one of four categories. Class 3 impacts have three charge signals, two are required for a class 2 and class 1 events, and only one for class 0. Class 3, our highest class, are real dust impacts and class 0 are noise events. Class 1 and class 2 events have been true dust impacts in interplanetary space (Baguhl et al., 1993, Krüger et al., 1999c).
Within about 15 distance from Jupiter energetic particles from the Jovian plasma environment cause an enhanced noise rate in class 2 and the lower quality classes. By analysing the properties of the Io stream particles and comparing them with the noise events, the noise could be eliminated from the class 2 data (Krüger et al., 1999d), but class 1 shows signatures of being all noise in the Jovian environment. This algorithm, however, applies to the stream particles and cannot per se be applied to other populations of grains. Furthermore, the denoising technique uses statistical arguments and is applicable to large data sets. Individual dust impacts may be erroneously classified as noise and vice versa. The analysis of the data sets from the flybys of all three satellites (Europa, Ganymede and Callisto) implies a slightly modified algorithm for the rejection of noise events in the flyby data of Europa (Krüger et al., 2000).
To check for a possible contamination by noise in the data set used for our analysis, we take all class 3 (dust impacts) and all class 2 events (dust and noise) and compare this total number with the number of class 2 events classified as noise by the standard algorithm (Krüger et al., 1999d) and by the modified algorithm applicable to the Europa data (Krüger et al., 2000), respectively. A total of 27 % of the events (10 out of 36) would be classified as noise in the first case and 14 % (5 out of 36) in the second one. Even the higher possible noise contamination in the first case does not affect the conclusions of this paper. In addition, Ganymede’s orbital radius is at from Jupiter at the edge of the noisy region where the noise contamination is relatively small anyway.
We therefore consider class 3 and all class 2 data for our analysis. It should be noted that there is no physical difference between dust impacts categorised into class 2 and class 3.
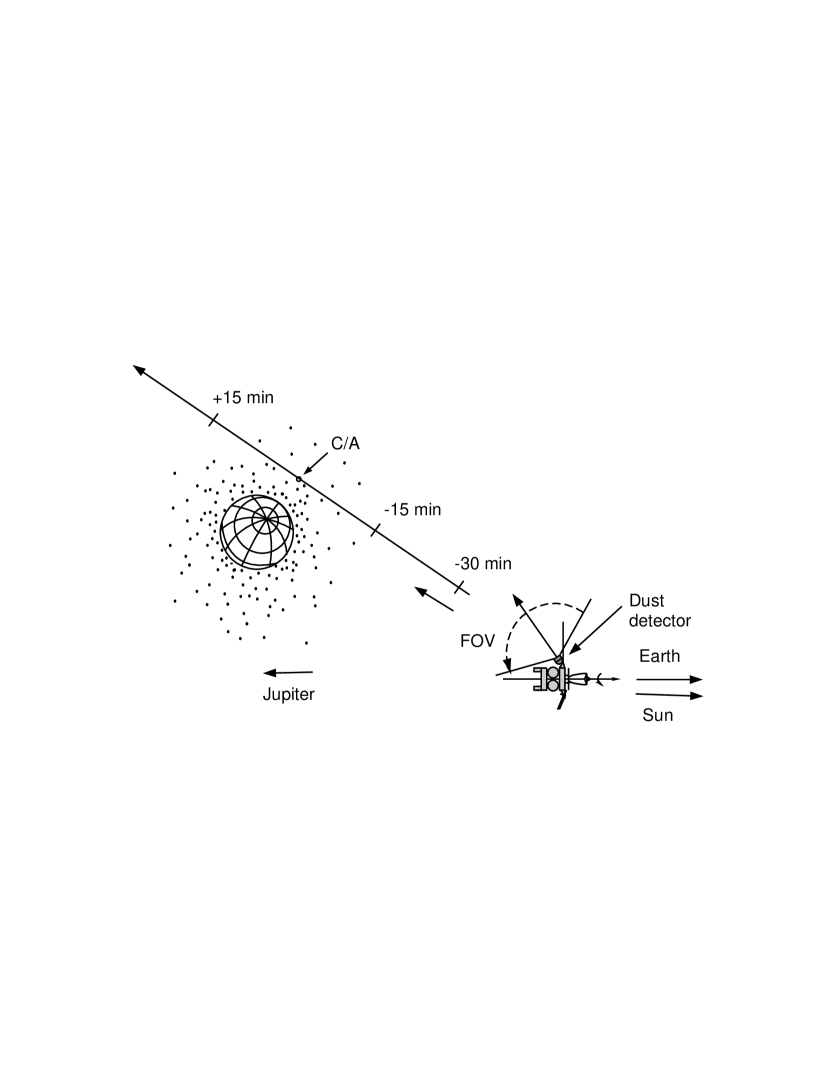
Galileo is a dual-spinning spacecraft, with an antenna that points antiparallel to the spacecraft positive spin axis. During most of the orbital tour around Jupiter, the antenna points towards Earth. The dust instrument is mounted on the spinning section of the spacecraft and its sensor axis is offset by an angle of from the spin axis (Fig. 1; an angle of was erroneously stated earlier).
The rotation angle, , measures the viewing direction of the dust sensor at the time of particle impact. During one spin revolution of the spacecraft, the rotation angle scans through . Rotation angles for the Galileo dust instrument, however, are reported opposite to that of the actual spacecraft rotation direction. This is done to easily compare Galileo results with the dust detector data taken on the Ulysses spacecraft, which, unlike Galileo, has the opposite spin direction. Zero degrees of rotation angle is taken when the dust sensor points close to the ecliptic north direction. At rotation angles of and the sensor axis lies nearly in the ecliptic plane (which corresponds roughly to Jupiter’s equatorial plane). The dust instrument has a wide field of view (FOV). Dust particles which arrive within of the positive spin axis can be sensed at all rotation angles, while those that arrive at angles from to from the positive spin axis can only be sensed over a limited range of rotation angles.
Insert Figure 1
Because Galileo’s high-gain antenna did not open completely, the spacecraft has a very low data transmission capability. For the dust instrument this means that the full set of parameters measured during a dust particle impact (rotation angle, impact charges, charge rise times, etc.) can only be transmitted to Earth for a limited number of particles. During the times considered in this paper these limits are between one particle per minute and one particle per 21 minutes (Krüger et al., 2000). During periods of higher impact rates, the full set of parameters is not transmitted to Earth for all particles. All particles, however, are counted with one of 24 accumulators (Grün et al., 1995). This allows for the determination of reliable impact rates during the satellite flybys.
Impact direction
In Fig. 2 we show the impact direction (rotation angle) of those particles detected within about two hours around closest approach to Ganymede for which the complete set of measured impact parameters has been transmitted to Earth. During the first three flybys (G1, G2, G7) particles with rotation angles between and were strongly concentrated towards Ganymede. Most of them were detected at altitudes below (Ganymede radius ). During the G1 and G2 flybys the large number of particles with rotation angles between and are streams of ten-nanometre-sized dust grains which have been detected throughout the Jovian system (see Grün et al., 1998, for a detailed analysis). The direction from which these dust streams were observed varied during Galileo’s path through the Jovian system: when Galileo approached the inner Jovian system rotation angles around were observed. Shortly before closest approach to Jupiter the rotation angle changed to . Therefore, depending on when the satellite flyby occurred, stream particles approached from the corresponding direction: in the case of G1, G2 and G7, and during G8. The stream particles can, in general, be identified by their calibrated impact velocities as will be shown further below. The detection geometry is sketched in Fig. 1.
At G1 and G2 an apparent concentration of particles with within about altitude is due to a higher data transmission rate for about an hour around Ganymede closest approach (cf. Fig. 2). During this time period the number of particles for which their complete information has been transmitted to Earth is increased by about a factor of ten. At the G7 encounter almost all particles with were detected within altitude. Only one stream particle was detected. During the G8 encounter the stream particles approached with rotation angles between and , and an apparent increase in the number of particles within about altitude is again due to an enhanced data transmission rate.
Insert Figure 2
The first three panels of Fig. 2 (G1, G2 and G7) show that particles detected with during the satellite flybys were concentrated towards Ganymede. They approached the dust sensor from a direction opposite to that of the dust stream particles.
We have analysed the velocity vector of Ganymede in a coordinate system fixed to Galileo in order to find out if the grains detected with are compatible with a Ganymede origin. This shows that particles approaching the sensor from Ganymede’s direction which have a low velocity relative to Ganymede could be detected from a direction corresponding to about rotation angle during all four encounters. Rotation angles of about are not compatible with the Ganymede direction. Taking into account the sensor field of view of , particles detected during the G1, G2 and G7 encounters with rotation angles between and are compatible with an origin from Ganymede itself. In the following we will call them Ganymede particles.
A total number of 36 Ganymede particles has been identified below altitude during these three encounters purely by their impact direction (cf. Tab. 1). For our further analysis we use a cut-off altitude of because this is close to the extension of the Hill sphere of Ganymede (). For G1 and G2 the numbers of identified Ganymede particles are lower limits to the true numbers of detected grains because the complete set of parameters measured upon impact could be transmitted to Earth for only a fraction of all impacts. At G7, however, the complete set of parameters for all particles detected within a two hour period around closest approach has been transmitted.
Insert Table 1
Ganymede particles from the G8 encounter cannot be identified by their impact direction alone because both stream particles and Ganymede particles approached the sensor from the same direction. We therefore have to use an additional criterion to separate Ganymede particles at G8.
Impact velocity
If the Ganymede particles truly originate from the satellite itself and belong to a steady-state dust cloud they should impact the detector with roughly the velocity of the spacecraft relative to the moon. During all four flybys this encounter velocity was close to (see Tab. 1) which is well above the detection threshold of the dust instrument for micrometre-sized grains (). In contrast to the Ganymede particles, stream particles have velocities in excess of (Zook et al., 1996). Therefore, the impact velocity should be a good parameter to separate both populations of grains.
Calibrated impact velocities are derived from the rise-time of the impact charge signal by an empirically derived algorithm. Such impact velocities could be determined for 29 Ganymede particles detected below altitude during the G1, G2 and G7 flybys (velocity error factor ; Grün et al., 1995). In Fig. 3 we compare the calibrated impact velocities of these Ganymede particles with those of the stream particles detected in the same time period. Because the distribution shows a bimodal structure, we can separate two statistical subsets: nearly all of the stream particles have calibrated velocities in excess of , whereas Ganymede particles are slower. The true impact velocities of the stream particles are much higher than the upper limit of the calibrated velocity range of the dust instrument (). Thus, the values derived from the instrument calibration are by far too low.
Insert Figure 3
The mean velocity of the 29 Ganymede particles in Fig. 3 is (). Given a typical uncertainty for an individual velocity measurement of a factor of two, this value is in good agreement with the velocity of Galileo relative to Ganymede (about ). It supports the picture that the particles detected belong to a dust cloud surrounding the moon. It also shows that the empirical velocity calibration of the instrument can be applied to the Ganymede particles, although one knows that it is not valid for the much smaller stream particles. Furthermore, and much more important for our analysis here, the calibrated impact velocities can be used to identify particles belonging to a dust cloud when such grains cannot be identified by their impact direction. It should be noted, however, that the two velocity distributions in Fig. 3 overlap which leads to some ambiguity in the identification of individual grains.
In Fig. 2 we have marked particles according to their calibrated velocities: those with impact speeds below are shown as circles, faster grains as crosses. For G8 (bottom panel) the majority of particles with have calibrated impact velocities above : they are classified as stream particles and are rejected. Only 9 particles with remain below altitude and a velocity below . Only particles with an altitude below are considered for further analysis because we want to minimise the contamination by stream particles: a few stream particles in Fig. 3 have calibrated velocities below and would erroneously be classified as Ganymede particles. Such a cutoff altitude is implied by the absence of Ganymede particles during the G7 flyby when the full data set for all particles has been transmitted. The mean velocity of the 9 particles from G8 is which is close to the value derived for the three earlier encounters.
At the G8 encounter the identified Ganymede particles show a slight concentration towards the satellite. Together with the 36 particles identified by their impact direction during the three earlier flybys, we have identified a total set of 45 Ganymede particles from all four encounters.
Impact rate
Early analyses of the impact rate of dust particles measured with the Galileo dust detector during approaches to the Galilean moons showed a sharp peak within about half an hour of closest approach to the moon (cf. Grün et al., 1997, 1998; Krüger et al., 1999b). This indicated the existence of concentrations of dust particles within a few satellite radii above the satellites’ surfaces.
With the data set for Ganymede particles detected during all four encounters we can now calculate the impact rate of dust grains in the close vicinity of the moon (Fig. 4). To obtain the impact rate we define distance bins equally spaced on a logarithmic scale and divide the number of particles for which the complete set of parameters has been transmitted to Earth in a given distance bin by the time Galileo has spent in this bin (dotted lines).
Insert Figure 4
To correct for incomplete data transmission, we then multiply bin by bin the impact rate with the ratio between the number of counted particles and the number of particles for which the complete data set has been transmitted. The impact rates corrected for incomplete data transmission are shown as solid lines. In cases where only a solid line is visible no correction was applied because the complete information of all particles in that bin is available (G1 and G7).
During the first three encounters (G1, G2 and G7) the impact rate increases towards Ganymede. Note specifically that for G7 no correction for incomplete transmission is needed because the full data set for all detected particles has been transmitted. Also, G1 needs only a correction in the innermost bins which steepens the slope slightly. Thus, G1 and G7 probably give the most reliable slopes for the spatial distribution of the grains in the dust cloud. Both fits give power law slopes steeper than .
For the fourth encounter (G8) no concentration of particles towards Ganymede is seen after correction for incomplete transmission. Note that a slight concentration is obvious in the uncorrected rate (dotted curve). This indicates that the slopes for the corrected curves have to be taken with some caution. Interestingly, the flattest slopes have been found for the encounters with the largest corrections for incomplete transmission (G2 and G8). On the other hand, the G2 flyby was the one which occurred closest to the north pole of Ganymede ( latitude). We do not investigate variations of the slopes between individual encounters because of the large statistical uncertainties. Spatial variations with respect to the flyby position relative to the satellite will be addressed in a future investigation which will include data from Galileo’s Europa and Callisto flybys.
Mass distribution
The charge released by an impact of a dust particle onto the target depends on the mass and the velocity of the grain (Grün et al., 1995). Thus, in order to calculate the particle mass from the measured impact parameters one has to know the impact velocity. In Fig. 5 we show the mass distribution of the particles from all four Ganymede flybys for which the velocity could be reliably determined (; 38 particles in total).
Insert Figure 5
In the upper panel of Fig. 5 the impact velocities derived from the instrument calibration have been used to obtain the particle mass. With this method the uncertainty of the impact velocity is typically a factor of 2 and that of the mass is a factor of 10.
The dust detector has a velocity-dependent detection threshold (Grün et al., 1995). The threshold for particles approaching with is shown as a dashed line. The mass distribution is incomplete around and below this value.
The mass distribution is also affected by the low data transmission capability of Galileo and the data storage scheme in the instrument memory. As a result, nearly all particles lost in G1, G2 and G8 are in the mass range below . If we assume that the lost particles are equally distributed over the mass bins below this value, the maximum of the mass distribution is artificially too low by less than a factor of 2.
If the individual impact velocities were known with a higher accuracy than the typical factor of 2 uncertainty from the instrument calibration, the uncertainty in the mass determination could be reduced. Because the mean values of the measured impact velocities are in good agreement with the velocities of Galileo relative to Ganymede for the individual encounters (Tab. 1), we assume the latter ones as the particles’ impact velocities and re-calculate the particle mass. This method has also successfully been applied to the mass distribution of interstellar dust particles (Landgraf et al., 2000). The lower panel of Fig. 5 shows the result for the Ganymede particles. The width of the mass distribution is significantly smaller than that derived from the calibrated impact velocities.
The mass distribution of the grains allows for a simple check for the compatibility of the data with the hypothesis of the impact origin of the detected particles. We took the mass distributions shown in Fig. 5 and show linear fits to the cumulative distributions in Fig. 6. We only considered grains, the masses of which were definitely well above the detector threshold (). The slopes are in good agreement with the typical slopes one expects for the impact ejecta (; see, e.g., Krivov and Jurewicz, 1999).
Insert Figure 6
3 Model for the Impact Ejecta from Ganymede
Detections of dust near Ganymede, and our results of the data processing which reveal the concentration of dust towards Ganymede, give rise to the following question: what is the physical mechanism that produces the dust material? A possibility of capturing the grains by the gravity of Ganymede is dynamically ruled out. In the 3-body problem “dust grain – Ganymede – Jupiter”, a close encounter of a grain with Ganymede may convert a hyperbolic orbit with respect to Jupiter to an elliptical one, but still bound to Jupiter and not to Ganymede. Under some conditions, it is possible that interplanetary dust grains are trapped in Jovian magnetosphere by electromagnetic forces (Colwell et al., 1998; Thiessenhusen et al., 2000); but a strong concentration of dust towards Ganymede requires additional mechanisms connected with Ganymede itself. The recently discovered own magnetic field of Ganymede (Kivelson et al., 1998) seems to be too weak to do the job. One could claim that geysers or volcanoes loft dust off Ganymede, but this is very unconvincing and unsupported by the observations which show no activity of this kind. One could argue for a self-sustained distribution of dust which was suggested to take place in Saturn’s E ring (Hamilton and Burns, 1994), but the strong gravity of Ganymede makes that improbable. A conceivable guess one could make about the origin of the Ganymede grains is their production via continuous bombardment by interplanetary micrometeoroids.
In what follows, we construct a model to predict the density of the dust cloud of Ganymede, produced by continuous hypervelocity impacts of interplanetary projectiles onto the moon’s surface. We start with the main simplifying assumptions. Two populations of the debris particles are considered: those which move on ballistic trajectories and therefore fall back to the satellite shortly after they are ejected, as well as those which are fast enough to escape from Ganymede into circumjovian space. We assume that these ejecta move in Keplerian trajectories — pieces of ellipses and hyperbolas, respectively. This is justified by estimates of the perturbing forces. The tidal gravity of Jupiter is only important outside the Hill sphere (). Next, for the grains with masses greater than , to which we confine our analysis, the radiation pressure force is less than 10% of Ganymede’s gravity even at from the moon. The Coriolis force is comparable to the satellite gravity at , but it cannot change appreciably the radial distribution of the ejecta. The only force that can possibly make the motion essentially non-Keplerian is the Lorentz force. Still this force, which is very important for grains moving about Jupiter (Colwell et al., 1998; Krivov et al., 2000), can probably be neglected for short-living grains in the vicinity of Ganymede. Assuming a strength of the Jovian magnetic field at Ganymede of , the velocity of the grains to be equal to the Ganymede velocity relative to the corotating jovian magnetic field (), and electrostatic potentials of grains of (Horányi et al., 1993), we find that at the Lorentz force amounts to % of the satellite gravity. The intrinsic magnetic field of Ganymede is ten times stronger (; Kivelson et al., 1998), but the velocity of the grains relative to Ganymede and its magnetic field is only of the order of , which means that the relative strength of the Lorentz force caused by the satellite’s magnetic field is one order of magnitude weaker. We conclude, especially taking into account the uncertainty in grains’ charges, that under some conditions the Lorentz force might lead to noticeable effects. However, incorporation of the electromagnetic effects into the model would require an extensive dedicated modelling, including implementation of models of Ganymede’s magnetosphere and performing the charging calculations. This would make little sense in view of the scarcity of the Galileo dust data. Thus this task is beyond the scope of the present paper.
We also assume that the circumsatellite dust cloud is in a steady state. Finally, we neglect possible effects of non-isotropy of the impactor flux (e.g., Colwell, 1993) and assume that the cloud is spherically symmetric. Thus, in this paper we do not consider variations in the spatial density from flyby to flyby which may be caused by spatial or temporal variations of the dust cloud surrounding Ganymede. Again, such an investigation is not possible with the present data set of 45 ejecta grains.
Impactor flux and ejecta yield
To predict the flux of the interplanetary impactors, we use Divine’s (1993) model. We have calculated the fluxes of interplanetary grains onto a sphere with unit cross section (), moving around the Sun in a circular Keplerian orbit with a radius of (heliocentric distance of Jupiter). Figure 7 shows, as a function of particle’s mass, the cumulative flux onto this sphere, the differential flux per mass decade, as well as the differential mass flux per mass decade. For comparison, the same fluxes at are also shown. The total mass flux at “far” from Jupiter (i.e., before its gravity is taken into account) is . It is dominated by grains with masses (or with sizes ).
Insert Figure 7
The main contribution to the flux and mass flux is made by the “halo population” (Divine, 1993), composed of particles in orbits with moderate eccentricities, but randomly distributed inclinations between and (thus including grains in both prograde and retrograde orbits). The velocities of interplanetary grains with respect to the Sun are very high: . Their mean velocity relative to Jupiter, because of the random distribution of inclinations, is nearly the same, . Obviously, the dispersion is also high: since the orbital velocity of Jupiter round the Sun is , the velocities of individual particles may range from to . For comparison, Colwell and Horányi (1996) adopt for this “Oort cloud population” of grains the velocity range of 8 to with a mean of .
We have to take into account the gravitational focussing by Jupiter, which increases the interplanetary flux at Ganymede (): (i) the speed of the grains becomes larger than that far from the planet, , and (ii) the spatial density of dust gets larger than the one far from Jupiter, . Assuming and applying the energy integral, we find and . The velocity has the meaning of the mean velocity of impactors with respect to Jupiter at Ganymede’s distance. Nevertheless, since the incoming directions of the projectiles are broadly distributed, we can roughly take this value as the mean projectile velocity with respect to Ganymede. We note, however, that the velocities of individual grains striking Ganymede may range from nearly zero to about . The former takes place when Ganymede is at opposition to the Sun for the prograde particles hitting its trailing hemisphere; the latter is attained at the same moment for retrograde particles impacting the leading hemisphere. Next, using the formulae by Colombo et al. (1966), we find . Therefore,
| (1) |
so that the mass flux at Ganymede is .
We consider the impact ejecta production now. The efficiency of the material ejection in a cratering event is characterised by , the characteristic yield, defined as the ratio of the ejected mass to the projectile mass. For hypervelocity impacts into ices, the typical yields were reported to range from to (e.g., Lange and Ahrens, 1987; Koschny, priv. comm.).From (Koschny, priv. comm.),for pure ice, for impactors, and for an impact speed of , the yield is . The mass production rate from Ganymede’s surface is then
| (2) |
where is the cross section area of Ganymede.
The mass distribution of the ejecta is commonly represented by a power law: , where is the grain mass and is the number of particles with masses ejected from the moon per second. The distribution is normalised to the total amount of the ejecta :
| (3) |
where is the largest mass of the ejecta. A plausible slope of the ejecta mass distribution is (e.g., Koschny, priv. comm.; Krivov and Jurewicz, 1999) which is consistent with the exponent found from the Galileo data (Fig. 6). For the heaviest ejecta fragment, we take , which is close to the typical mass of the impactors (the dependence of this parameter is weak though). In what follows, we always calculate , which correspond to the grains “safely” above the detection threshold, cf. Fig. 5).
Ejecta speed distribution
In this study, we assume no dependence between the speeds of the ejected grains and their masses, because laboratory experiments still do not evidence any strong correlation between the two quantities (e.g., Nakamura and Fujiwara, 1991). Thus, regardless of how massive the ejecta are, we take the ejecta speed distribution in the form (see, e.g., Stöffler et al., 1975, Hartmann, 1985)
| (4) |
where is the fraction of the material ejected at speeds .
This adds two parameters to the model: the “lower cut-off velocity” and the distribution slope . The values of these parameters were determined in impact experiments. A plausible range for could be from a few to several hundred (e.g., Stöffler et al., 1975; Hartmann, 1985). The slope of the speed distribution may range from 1 to somewhat greater than 2 (e.g., Frisch, 1992; see also a discussion in Colwell and Esposito, 1993).
A remark should be made about the directions of the ejecta velocities. From the laboratory experiments it is known that even oblique impacts lead to ejection of the surface material into a cone normal to a target surface (Nakamura and Fujiwara, 1991). By numerical experiments, we have checked that the spatial distribution of the ejecta depends only weakly on the opening angle of this cone. Also, laboratory measurements suggest that most of the debris are ejected at high angles to the surface — such as (Koschny, priv. comm.;Burchell et al., 1998; also M. J. Burchell, priv. comm.) or even (Frisch, 1992). Besides, some authors observed vertical plumes of fast ejecta (Hartmann, 1985). For these reasons, and to alleviate the analytical derivations, we assume for simplicity that the trajectories of the ejecta are straight lines normal to the surface of Ganymede (“degenerate Keplerian ellipses”).
Energy constraints on the model parameters
The model as a whole contains five parameters. Three parameters come from the ejecta mass distribution (characteristic yield , slope , and the maximum mass of a fragment ), while two others pertain to the ejecta speed distribution (the lower cut-off velocity and the slope ). The dependence of the results on and is only moderate, and besides, changes in their values can always be absorbed in a value of the characteristic yield. This leaves , , and as the three most important model parameters. Of course, the parameters describing the projectile flux, most notably the mass flux of the impactors , are implicit in the results.
Some constraints on the parameters , , and can be placed by considering the energy balance. The ratio of the kinetic energy carried by the ejecta cloud, , to the impactor’s kinetic energy, , must be less than unity, because part of is spent for comminution and heating. The ratios determined in the hypervelocity impact experiments vary from to (e.g., Asada, 1985; Hartmann, 1985). We assume .
Let us express and through the parameters of the model. Obviously, , and
| (5) |
where is the impactor mass, is its speed, is the speed of the fastest ejecta fragments, and (hereafter prime means derivative) is the differential speed distribution, with being the cumulative distribution given by Eq. (4). We have:
| (6) |
(If , a logarithmic dependence results.) In Fig. 8, the lines are plotted on the -plane for several values of . For , which we have chosen as the most plausible value, and for , 1.6, and 2.0, one gets , 30, and , respectively. In these calculations, we assumed . The results do not depend on this speed severely. For example, with , for the same and one gets , 27, and . The values of that we derived are consistent with impact experiment data (e.g., Stöffler et al., 1975; Hartmann, 1985).
Insert Figure 8
Number density of dust
Given a dust production rate , which can be calculated using Eq. (3), and assuming the ejecta speed distribution (Eq. 4), we compute now the steady-state number density of the ejecta, , as a function of , the distance from the centre of Ganymede.
Consider first the ejecta in bound orbits, i.e., the grains ejected at speeds , where is the escape velocity from Ganymede’s surface. Remember that we assume the grains to move in rectilinear Keplerian trajectories. As follows from Eq. (4) and from the energy integral of the two-body problem, the fraction of ejecta, ejected in orbits with semimajor axes , is
| (7) |
The steady-state number of grains with semimajor axes at distances from Ganymede’s centre, where , equals
| (8) |
where the factor 2 appears because a grain reaches the distance twice — moving from and back to the moon, and is the time interval it takes for a grain to move from to . Dividing Eq. (8) by the volume of a spherical layer and integrating over semimajor axes of grains that reach distance , one finds the steady-state number density of grains at distance :
| (9) |
From the energy integral,
| (10) |
Inserting Eq. (7) and Eq. (10) into Eq. (9), and using a new integration variable , after some algebra we find
| (11) |
Now we perform a similar derivation for the escaping grains with velocities at the surface. The steady-state number of grains ejected at speeds () at distances from Ganymede’s centre is
| (12) |
where is again the time that a grain needs to move from to . Dividing Eq. (12) by the volume of a spherical layer and integrating over there results:
| (13) |
Here,
| (14) |
Substituting Eq. (4) and Eq. (14) into Eq. (13), and using an integration variable , after some transformations one obtains
| (15) |
Let us discuss some properties of the functions (Eq. 11) and (Eq. 15). To get the actual number density at a distance , we sum up the two contributions: . As seen from Eqs. (11) and (15), decreases faster with increasing than , so that the relative contribution of escaping grains increases with distance. However, how large is this contribution at a given distance from the satellite? For one set of the model parameters, namely and , we made calculations by using both Eqs. (11) and (15) and found that the number densities of the escaping grains and the particles falling back to the moon become comparable at the altitude of from Ganymede (Fig. 9a). As the Galileo detections have been made closer to the moon, we can conclude that the majority of the ejecta particles identified by the dust instrument, if they had not been caught by the detector, eventually would have fallen back onto Ganymede.
Somewhat counterintuitively, the radial slope of the number density is not very sensitive to . For all reasonable values of the ejecta distribution slope , the number density is close to a power law with to (see Fig. 9b for grains in bound orbits and Fig. 9c for escaping grains).
Remember that, in derivation of Eqs. (11) and (15), we assumed the ejecta to move radially from and to the surface of Ganymede. This assumption is partly reflected by the lower integration limit of 1 in Eq. (11). We calculated the integral with integration limits greater than unity, to simulate the particles leaving the surface not vertically. The results (Fig. 9d) show that at small altitudes the number density gets smaller as compared to the case of vertical ejections, and the curves slope more gently.
Insert Figure 9
4 Comparison of the Model with Galileo Data
Comparison of the available data with theory is accomplished by constructing the dependencies of the frequency of the detections as a function of radial distance from the moon. To reach this goal, we use the impact rates depicted by solid lines in Fig. 4. Dividing the rates by the effective spin-averaged detector area, we obtain the fluxes . Then we divide the results by the mean impact velocity for a given flyby, which results in mean number densities in various distance bins explained in Sect. 2.
On the other hand, we use our model to predict the number density as a function of distance. We used Eqs. (3), (11) and (15). As discussed above, we chose the yield and took parameters , and in the ranges compatible with laboratory impact experiments, using the values that satisfy the relation . As regards two other, less important, model parameters, the values and (cf. Asada, 1985; O’Keefe and Ahrens, 1985; Koschny, priv. comm.) were used.
The results (both the data points and theoretical curves) are displayed in Fig. 10, showing a reasonably good agreement between the data and the model. For example, , , and are quite compatible with the data for G1 and G7, which represent the most reliable number density slopes. We cannot leave without notice, however, that the theoretical curves seem to be somewhat steeper than the distribution of the data points for G2 and G8. Either this effect is caused by statistical errors (see Section 2), or it may be attributed to some simplifying assumptions of our model (see Sections 3 and 5). Note that using the lower integration limit in Eq. (11) larger than 1, which simulates the oblique ejections from the surface, decreases the predicted number density at lower altitudes, resulting in a better compatibility with some of the data points (e.g., leftmost G2 point in Fig. 10).
Insert Figure 10
It should be emphasised that in the present paper, we do not make any systematic attempt to constrain the poorly known parameters of the model from the data. One reason for that is scarcity of the data. Another one is that some of the parameters (such as , , and ) affect the modelling results only slightly, while the others (such as , , and the parameters describing the impactor flux) are strongly cross-correlated and cannot be constrained independently. A weak dependence of the predicted number density on some of the parameters would certainly be a serious handicap, if our goal were to retrieve the poorly known parameters. However, the same circumstance — a weak sensitivity of the model results to the model parameters — turns to a serious advantage, if we are merely checking the compatibility of the data with our model. The fact that the model agrees with the data over a wide range of the parameters strengthens our conclusion about the likelihood of the impact origin of the detected grains.
In addition to the study of the debris produced by impacts of interplanetary grains, we have also estimated a possible effect of interstellar grains as impactors. The result is that their contribution is negligible. The reason is that, although the flux of interstellar grains at the heliocentric distance of Jupiter is known to exceed that of the interplanetary particles, the mass flux in the considered mass range is about 4 orders of magnitude smaller (Landgraf et al., 2000). Hence the flux of the ejecta produced by interstellar grains is also substantially smaller than the one caused by interplanetary projectiles.
5 Conclusions and Discussion
In this paper we examined the dust impacts registered by the Galileo dust detector in the immediate vicinity of Ganymede during four close flybys of this Jovian moon. Analyzing impact directions and velocities and the mass distribution, as well as spatial locations of the events, we have evidenced that the particles did originate from the moon. In an attempt to find out the specific physical mechanism that ejected the particles off the surface, we checked whether these “Ganymede dust grains” are impact debris produced by hypervelocity impacts and, which impactors are responsible for the ejections. To do so, we have constructed a model for the impact ejecta from Ganymede and compared the modelling results with the data. The comparison made it clear that the data are fully compatible with the impact origin of the Ganymede dust grains. Of course, this result cannot be treated as an evidence of the impact origin of the detected dust. With our modelling, we have only demonstrated that the data do not contravene the impact scenario, given our current knowledge of the physical conditions in the Jovian system as well as available laboratory data of hypervelocity impacts.
If the impact scenario is true, then the class of projectiles responsible for the formation of a circumsatellite cloud of dust grains, several tens of which were sensed by the detector onboard Galileo, is almost definitely interplanetary micrometeoroids. The derived mass distribution of the detected grains, as well as the impact rates actually measured by the dust instrument, are in fairly good agreement with what we get from the model of hypervelocity impacts of interplanetary dust particles (IDPs), assuming contemporary models of IDP flux at a heliocentric distance of Jupiter and a low-temperature ice target. The interstellar grains should be much less efficient as impactors in producing the collisional debris, because of the much lower mass influx of interstellar dust onto the Ganymede surface compared to that of the IDPs.
As follows from elementary estimates, the particles that reach an altitude of one satellite radius must have a starting velocity in excess of . This confirms laboratory results that some of the hypervelocity impact ejecta from icy targets attain very high speeds (Frisch, 1992). Nevertheless, more than a half of the grains which could be found (and have been actually detected by Galileo) at altitudes less than about eight satellite radii above the surface, are not the particles escaping into Jovian space. They are slower ejecta, destined to fall back to Ganymede typically within several minutes to several hours after ejection. Such grains surround the satellite all the time as a result of continuous bombardment of the surface by IDPs. Further out, starting from distances of , the escaping grains start to dominate the number density.
It seems useful to give some general estimates concerning the mass budget of the dust cloud of Ganymede. The mass flux of IDPs bombarding the satellite surface is estimated to be (dominated by IDPs with ). With the characteristic yields of , we then estimate that as much as to of the moon’s surface material, is ejected into space. Depending on the ejecta speed distribution adopted, the mean lifetime of the ejecta ranges from tens of seconds to several hundred seconds. Note that these values are dominated by the slowest ejecta — for the grains that reach the altitudes of several satellite radii the flight times are rather several hours. We therefore get an estimate of the total amount of dust contained in a steady-state cloud around Ganymede: 1 to 100 tons. Next, about to of the ejecta escape from the satellite. It gives the injection rate of the material into circumjovian space of to , which may be comparable with the influx rate of IDPs to the Ganymede surface.
Remember that, in our data interpretation, we assumed no time variations of the incoming impactor flux, so that the dust cloud was assumed to be in a steady state. It would be interesting to lift this assumption and to estimate possible time variations — e.g., temporary enhancements of number density caused by hits of more massive meteorites, treated as individual events. It should be noted, however, that no pronounced enhancements of concentration of micrometre-sized debris are expected (Krivov and Jurewicz, 1999).
Another, and possibly more restrictive simplification that we made is the spherical symmetry of the dust cloud, which implies an isotropy of the impactor flux. The mean speed of IDPs with respect to Jupiter at the distance of Ganymede is about (see Section 3). Jupiter’s motion about the Sun (with the velocity of ) and the orbital motion of the moon about Jupiter () make the distribution of impactors at Ganymede highly unisotropic. Considering the geometry of the orbital motions of Jupiter, Ganymede, and IDPs, it is easy to show that velocities of the grains with respect to Ganymede vary from nearly zero to about , depending on the position of Ganymede on its orbit and the directions of the particle velocities. As explained in Section 3, these extreme velocity values are attained when Ganymede is at opposition to the Sun, at which moment we can expect a very high asymmetry of the dust cloud above the leading and trailing hemispheres of the moon. The effect gets smaller at Ganymede’s conjunction, when the prograde particles hit the trailing hemisphere with and retrograde grains reach the leading side with , but still many more impacts are expected on the leading edge of Ganymede than on the trailing edge. Therefore, we predict a marked and time-variable hemispheric asymmetry. Unfortunately, given the large statistical uncertainties due to the small number of detected particles, no obvious spatial and/or temporal variation could be found in the present data. For this reason, we do not undertake detailed modelling for the angular distribution of impactors and ejecta similar to what has been done in different problems (e.g., Zook, 1992; Colwell, 1993). We hope to address these issues in future investigations of the full data set for all Galilean moons.
Much of the dust ejected from Ganymede is launched into bound orbits and falls back to the moon. A complex of these short-living, but continuously replenished grains forms what we call an ejecta dust cloud of Ganymede. Obviously, all massive satellites which lack gaseous atmospheres should own an ejecta dust cloud. Before Galileo, there were few attempts of direct in-situ detections of large ejecta close to satellites — most notably, near the Moon (Iglseder et al., 1996); these experiments did not bring up definite results, however. Here we present the successful measurements of the satellite ejecta in the vicinity of a source moon. We also present a dynamical model for an ejecta dust cloud of a massive satellite.
A tiny fraction of impact debris is ejected at speeds sufficient to escape from Ganymede entirely. As shown above – within the error bars – the ejected mass is comparable with the incoming flux of IDP imactors. The ejected material goes into orbit around Jupiter and most of it will eventually be swept up by one of the Galilean satellites. These escaping grains are probably responsible for some of the impact events detected by the dust instrument in the inner Jovian system between the Galilean satellites (Grün et al., 1997, 1998; Krivov et al. 2000). Unfortunately, the ring of material formed by these grains escaping from Ganymede is far too tenuous to be detected optically. However, the fraction of debris escaping a satellite is a steeply decreasing function of satellite mass, so steep that despite their reduced cross sections, small moons may be better sources of dust than large satellites. Indeed, many small moons have been proved to be, or are supposed to be, sources of material for tenuous dusty rings surrounding all giant planets (Burns et al., 1984) and presumably Mars (Soter, 1971; Krivov and Hamilton, 1997). In the Jovian system, four innermost moons are sources for the dust halo, the main ring, and the two-component gossamer ring (Ockert-Bell et al., 1999; Burns et al., 1999). A variety of examples can be found in the Saturnian system, which is especially important in view of the Cassini mission. Enceladus supplies material to the huge E ring (Hamilton and Burns, 1994). Irregularly-shaped icy Hyperion is believed to be a source of icy ejecta which arrive at Titan, possibly affecting the complex chemistry of its dense nitrogen atmosphere (Banaszkiewicz and Krivov, 1997; Krivov and Banaszkiewicz, 2000). Yet farther out from Saturn, the outermost retrograde moon Phoebe emits dust which is thought to be deposited on the leading side of Iapetus, producing its observed brightness asymmetry (Burns et al., 1996). All these cases exemplify the same mechanism of dust production as the one discussed here for Ganymede.
Therefore, spacecraft measurements near the satellites, i.e. very close to the sources of dust, would be of primary importance to gain more insight into the properties of satellite surfaces and the dusty rings these moons maintain. We believe the technique of processing and interpretation of spacecraft data which we proposed here and tested on Ganymede can be directly applied to data from the dust experiment onboard the Cassini spacecraft which are to be obtained during its flybys of the Saturnian moons.
The Galileo dust measurements at Ganymede presented in this paper can be considered as a unique natural impact experiment. They complement laboratory experiments in an astrophysically relevant environment. Laboratory impact experiments have significant deficiencies in many respects, in the speeds of the projectiles and the mass and speed ranges in which ejecta particles can be observed. Furthermore, there is the always pending question of the astrophysical relevance of the materials used. Although far from being perfect impact experiments, the Galileo results offer two extremely important improvements over laboratory experiments: 1) the projectile and target materials and projectile speeds are astrophysically relevant, and 2) the masses and speeds of the ejecta particles can be determined in an important region of parameter space (micrometre sizes and speeds).
Acknowledgements. We thank Andreas Heck and Valeri Dikarev for valuable discussions and the Galileo project at JPL for effective and successful mission operations. Thorough reviews by Herbert Zook, Markus Landgraf, Joshua Colwell, and an anonymous referee are appreciated. A. K. greatly thanks his colleagues of the Heidelberg dust group for their warm hospitality and funding his stay at MPIK. The final stage of the work was done during A. K.’s Alexander von Humboldt fellowship at MPAe. This work has been supported by Deutsches Zentrum für Luft- und Raumfahrt e.V. (DLR).
References
Asada, N. Fine fragments in high-velocity impact experiments. J. Geophys. Res., 90, 12,445–12,453, 1985.
Baguhl, M., Grün, E., Linkert, G., Linkert, D., Siddique, N. and Zook, H., Identification of ”small” dust impacts in the Ulysses dust detector data, Planet. Space Sci., 41, 1085-1098, 1993
Banaszkiewicz, M. and Krivov, A. V., Hyperion as a dust source in the saturnian system. Icarus, 129, 289–303, 1997.
Burchell, M. J., Brooke-Thomas, W., Leliwa-Kopystynski, J., and Zarnecki, J. C., Hypervelocity impact expreiments on solid targets. Icarus, 131, 210–222, 1998.
Burns, J. A., Showalter, M. R., and Morfill, G. E., The ethereal rings of Jupiter and Saturn. In Greenberg, R. and Brahic, A., Eds., Planetary Rings, pp. 200–272. University of Arizona Press, Tucson, 1984.
Burns, J. A., Hamilton, D. P., Mignard, F., and Soter, S., The contamination of Iapetus by Phoebe dust. In Gustafson, B. A. S. and Hanner, M. S., Eds, Physics, Chemistry, and Dynamics of Interplanetary Dust (ASP Conf. Series, vol. 104), pp. 179–182. Kluwer, Dordrecht, 1996.
Burns, J. A., Showalter, M. R., Hamilton, D. P., Nicholson, P., D., de Pater, I., Ockert-Bell, M. E., Thomas, P., C., The formation of Jupiter’s faint rings, Science, 284, 1146-1150, 1999.
Colombo, G., Lautman, D. A., and Shapiro, I. I. The Earth’s dust belt: Fact or fiction? 2. Gravitational focusing and Jacobi capture. J. Geophys. Res., 71, 5,705–5,717, 1966.
Colwell, J. E., A general formulation for the distribution of impacts and ejecta from small planetary satellites. Icarus, 106, 536–548, 1993.
Colwell, J. E. and Esposito, L. W. Origins of the rings of Uranus and Neptune. II — Initial conditions and ring moon populations. J. Geophys. Res., 98, 7387–7401, 1993.
Colwell, J. E. and Horányi, M. Magnetospheric effects on micrometeoroid fluxes. J. Geophys. Res., 101, 2,169–2,175, 1996.
Colwell, J. E., Horányi, M., and Grün, E., Capture of interplanetary and interstellar dust by the Jovian magnetosphere, Science 280, 88–91, 1998.
Divine, N. Five populations of interplanetary meteoroids. J. Geophys. Res., 98, 17,029–17,048, 1993.
Frisch, W., Hypervelocity impact experiments with water ice targets. In McDonnell, J. A. M., Ed., Hypervelocity Impacts in Space, pp. 7–14. University of Kent, Canterbury, Great Britain, 1992.
Graps, A., Grün, E., Svedhem, H., Krüger, H., Horányi, M., Heck, A. and Lammers, S., Io as a source of the Jovian dust streams, Nature, 405, 48–50, 2000.
Grün, E., Fechtig, H., Zook, H. A., and Giese, R. H., Collisional balance of the meteoritic complex. Icarus, 62, 244–272, 1985.
Grün, E., Fechtig, H., Hanner, M. S., Kissel, J., Lindblad, B.-A., Linkert, D., Linkert, G., Morfill, G. E., and Zook, H., The Galileo dust detector, Space Sci. Rev., 60, 317-340, 1992.
Grün, E., Zook, H. A., Baguhl, M., Balogh, A., Bame, S. J., Fechtig, H., Forsyth, R., Hanner, M. S., Horányi, M., Kissel, J., Lindblad, B.-A., Linkert, D., Linkert, G., Mann, I., McDonnell, J. A. M., Morfill, G. E., Phillips, J. L., Polanskey, C., Schwehm, G., Siddique, N., Staubach, P., Svestka, J., and Taylor, A. Discovery of jovian dust streams and interstellar grains by the Ulysses spacecraft. Nature, 362, 428–430, 1993.
Grün, E., Baguhl, M., Fechtig, H., Hamilton, D.P., Kissel, J., Linkert, D., Linkert, G. and Riemann, R., Reduction of Galileo and Ulysses dust data. Planet. Space Sci. 43, 941-951, 1995.
Grün, E., Krüger, H., Dermott, S., Fechtig, H., Graps, A., Gustafson, B. A., Hamilton, D. P., Hanner, M. S., Heck, A., Horányi, M., Kissel, J., Lindblad, B.-A., Linkert, D., Linkert, G., Mann, I., McDonnell, J. A. M., Morfill, G. E., Polanskey, C., Schwehm, G., Srama, R. and Zook, H. A. Dust measurements in the jovian magnetosphere. Geophys. Res. Lett. 24, 2171-2174, 1997.
Grün, E., Krüger, H., Graps, A., Hamilton, D. P., Heck, A., Linkert, G., Zook, H. A., Dermott, S., Fechtig, H., Gustafson, B. A., Hanner, M. S., Horányi, M., Kissel, J., Lindblad, B.-A., Linkert, D., Mann, I., McDonnell, J. A. M., Morfill, G. E., Polanskey, C., Schwehm, G., Srama, R. Galileo Observes Electromagnetically Coupled Dust in the Jovian Magnetosphere. J. Geophys. Res., 103, 20,011-20,022, 1998.
Hamilton, D. P. and Burns, J. A., Origin of Saturn’s E ring: Self-sustained, naturally. Science, 264, 550–553, 1994.
Hartmann, W. K. Impact experiments. 1. Ejecta velocity distributions and related results from regolith targets. Icarus, 63, 69–98, 1985.
Horányi, M., Burns, J. A. and Hamilton, D. P. The dynamics of Saturn’s E ring particles. Icarus, 97, 248-259, 1992.
Horányi, M., Morfill, G. and Grün, E., Mechanism for the acceleration and ejection of dust grains from Jupiter’s magnetosphere, Nature, 363, 144–146, 1993
Horányi, M. and Cravens, T. E., The structure and dynamics of Jupiter’s ring, Nature, 381, 293-295, 1996.
Iglseder, H., Uesugi, K., and Svedhem, H., Cosmic dust measurements in lunar orbit. Advances in Space Research, 17(12), 177–182, 1996.
Kivelson, M. G., Warnecke, J., Bennett, L., Joy, S., Khurana, K. K., Linker, J. A., Russell, C. T., Walker, R. J., and Polanskey, C. Ganymede’s magnetosphere: Magnetometer overview. J. Geophys. Res., 103, 19,963–19,972, 1998.
Krivov, A. V., On the dust belts of Mars. Astron. Astrophys., 291, 657–663, 1994.
Krivov, A. V. and Banaszkiewicz, M., Unusual origin, evolution, and fates of icy ejecta from Hyperion. Icarus, submitted, 2000.
Krivov, A. V. and Hamilton, D. P., Martian dust belts: Waiting for discovery. Icarus, 128, 335–353, 1997.
Krivov, A. V. and Jurewicz, A., The ethereal dust envelopes of the Martian moons. Planet. Space Sci., 47, 45–56, 1999.
Krivov, A. V., Krüger, H., Grün, E., Thiessenhusen, K.-U. and Hamilton, D. P., Evidence for a new dust ring of Jupiter between the Galilean satellites, Geophys. Res. Letters, submitted, 2000.
Krüger, H., Krivov, A. V., Hamilton, D. P., Grün, E., Detection of an impact-generated dust cloud around Ganymede, Nature, 399, 558-560, 1999a.
Krüger, H., Grün, E., Graps, A., Lammers, S., Observations of electromagneticlly coupled dust in the Jovian magnetosphere, Astrophys. and Space Sci., 264, 247 – 256, 1999b.
Krüger, H., Grün, E., Hamilton, D. P., Baguhl, M., Dermott, S., Fechtig, H., Gustafson, B. A., Hanner, M. S., Heck, A., Horányi, M., Kissel, J., Lindblad, B.-A., Linkert, D., Linkert, G., Mann, I., McDonnell, J. A. M., Morfill, G. E., Polanskey, C., Riemann, R., Schwehm, G., Srama, R. and Zook, H. A., Three years of Galileo dust data: II. 1993 to 1995. Planet. Space Sci., 47, 85–106, 1999c.
Krüger, H., Grün, E., Heck, A., Lammers, S., Analysis of the sensor characteristics of the Galileo dust detector with collimated Jovian dust stream particles, Planet. Space Sci., 47, 1015–1028, 1999d.
Krüger, H., Grün, E., Graps, A., Bindschadler, D., Dermott, S., Fechtig, H., Gustafson, B. A., Hamilton, D. P., Hanner, M. S., Horányi, M., Kissel, J., Lindblad, B.-A., Linkert, D., Linkert, G., Mann, I., McDonnell, J. A. M., Morfill, G. E., Polanskey, C., Schwehm, G., Srama, R. and Zook, H. A., One year of Galileo dust data from the Jovian system: 1996. Planet. Space Sci., in prep., 2000.
Landgraf, M., Baggeley, W. J., Grün, E., Krüger, H. and Linkert, G., Aspects of the mass distribution of interstellar dust grains in the solar system, J. Geophys. Res., 105, No. A5, 10, 343, 2000.
Lange, M. A. and Ahrens, T. J., Impact experiments in low-temperature ice. Icarus, 69, 506–518, 1987.
Morfill, G. E., Grün, E., Johnson, T. V., Dust in Jupiter’s magnetosphere: Origin of the ring, Planet. Sp. Sci., 28, 1,101-1,110, 1980.
Nakamura, A. and Fujiwara, A., Velocity distribution of fragments formed in a simulated collisional disruption. Icarus, 92, 132–146, 1991.
Ockert-Bell, M. E., Burns, J. A., Daubar, I. J., Thomas, P. C., Veverka, J., and Belton, M. A. S., The structure of Jupiter’s ring system as revealed by the Galileo imaging experiment. Icarus, 138, 188–213, 1999.
O’Keefe, J. D. and Ahrens, T. Impact and explosion crater ejecta, fragment size, and velocity. Icarus, 62, 328–338, 1985.
Soter, S., The dust belts of Mars. Report of Center for Radiophysics and Space Research No. 462, 1971.
Stöffler, D., Gault, D. E., Wedekind, J., and Polkowski, G. Experimental hypervelocity impact into quartz sand: Distribution and shock metamorphism of ejecta. J. Geophys. Res., 80, 4042–4077, 1975.
Thiessenhusen, K.-U., Krüger, H., Spahn, F., Grün, E., Dust grains around Jupiter — the observations of the Galileo dust detector, Icarus, 144, 89–98, 2000.
Zook, H. A., Grün, E., Baguhl, M., Hamilton, D. P., Linkert, G., Liou, J.-C., Forsyth, R. and Phillips, J. L., Solar wind magnetic field bending of jovian dust trajectories, Science 274, 1,501-1,503, 1996.
Zook, H. A. Deriving velocity distribution of meteoroids from the measured meteoroid impact directionality on the various LDEF surfaces. In A. S. Levine, Ed., LDEF – 69 Months in Space (First Post-Retrieval Symposium, NASA CP-3134, Part 1, 569-579, 1992.


| Flyby | Date | Altitude | Spacecraft | Average | Particles | Corrected | Slope of |
|---|---|---|---|---|---|---|---|
| (year-day) | velocity | particle | with full | number of | impact | ||
| velocity | data set | particles | rate | ||||
| (km) | () | () | |||||
| (1) | (2) | (3) | (4) | (5) | (6) | (7) | (8) |
| G1 | 96-179.270 | 844 | 7.8 | 15 | 30 | ||
| G2 | 96-250.791 | 262 | 8.0 | 10 | 48 | ||
| G7 | 97-095.299 | 3,095 | 8.5 | 11 | 11 | ||
| G8 | 97-127.665 | 1,596 | 8.6 | 49 |
*Only particles with impact velocity
v and below altitude included.