Galaxies Behind the Milky Way and the Great Attractor 11institutetext: Departamento de Astronomía, Universidad de Guanajuato, Apartado Postal 144, 36000 Guanajuato GTO, Mexico
Galaxies Behind the Milky Way
and the Great Attractor
Abstract
Dust and stars in the plane of the Milky Way create a ”Zone of Avoidance” in the extragalactic sky. Galaxies are distributed in gigantic labyrinth formations, filaments and great walls with occasional dense clusters. They can be traced all over the sky, except where the dust within our own galaxy becomes too thick – leaving about 25% of the extragalactic sky unaccounted for. Our Galaxy is a natural barrier which constrains the studies of large-scale structures in the Universe, the peculiar motion of our Local Group of galaxies and other streaming motions (cosmic flows) which are important for understanding formation processes in the Early Universe and for cosmological models.
Only in recent years have astronomers developed the techniques to peer through the disk and uncover the galaxy distribution in the Zone of Avoidance. I present the various observational multi-wavelength procedures (optical, far infrared, near infrared, radio and X-ray) that are currently being pursued to map the galaxy distribution behind our Milky Way, including a discussion of the (different) limitations and selection effects of these (partly) complementary approaches. The newly unveiled large-scale structures are discussed and compared to predictions from theoretical reconstructions of the mass density field. Particular emphasis is given to discoveries in the Great Attractor region – a from streaming motions predicted huge overdensity centered behind the Galactic Plane. The recently unveiled massive rich cluster A3627 seems to constitute the previously unidentified core of the Great Attractor.
1 The Zone of Avoidance
A first reference to the Zone of Avoidance (ZOA), or the “Zone of few Nebulae” was made in 1878 by Proctor Pro78 , based on the distribution of nebulae in the “General Catalogue of Nebulae” by Sir John Herschel Her64 . This zone becomes considerably more prominent in the distribution of nebulae presented by Charlier Char22 using data from the “New General Catalogue” by Dreyer Dre88 ; Dre95 . These data also reveal first indications of large-scale structure: the nebulae display a very clumpy distribution. Currently well-known galaxy clusters such as Virgo, Fornax, Perseus, Pisces and Coma are easily recognizable even though Dreyer’s catalog contains both Galactic and extragalactic objects as it was not known then that the majority of the nebulae actually are external stellar systems similar to the Milky Way. Even more obvious in this distribution, though, is the absence of galaxies around the Galactic Equator. As extinction was poorly known at that time, no connection was made between the Milky Way and the “Zone of few Nebulae”.
A first definition of the ZOA was proposed by Shapley Sha61 , as the region delimited by “the isopleth of five galaxies per square degree from the Lick and Harvard surveys” (compared to a mean of 54 gal./sq.deg. found in unobscured regions by Shane & Wirtanen Sha67 ). This “Zone of Avoidance” used to be “avoided” by astronomers interested in the extragalactic sky because of the inherent difficulties in analyzing the few obscured galaxies known there.
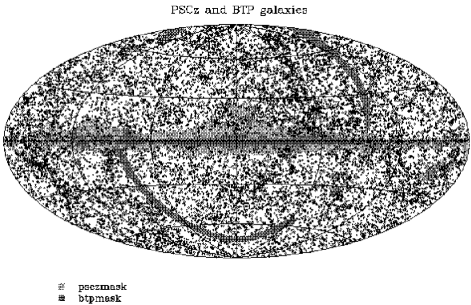
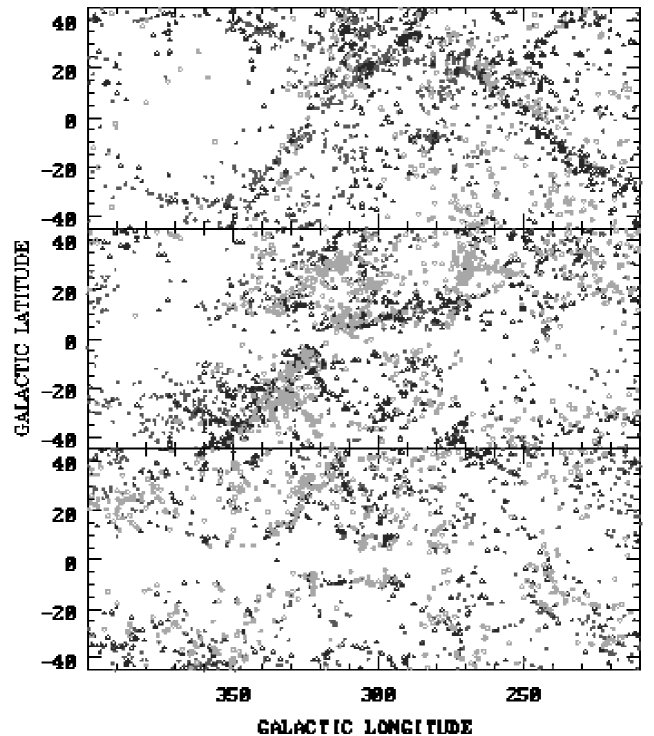
Merging data from more recent galaxy catalogs, i.e. the Uppsala General Catalog UGC Nil73 for the north (), the ESO Uppsala Catalog Lau82 for the south (), and the Morphological Catalog of Galaxies MCG Vor63 for the strip inbetween (), a whole-sky galaxy catalog can be defined. To homogenize the data determined by different groups from different survey material, the following adjustments have to be applied to the diameters: and Fou85 . According to Hudson & Lynden-Bell Hud91 this “whole-sky” catalog then is complete for galaxies larger than .
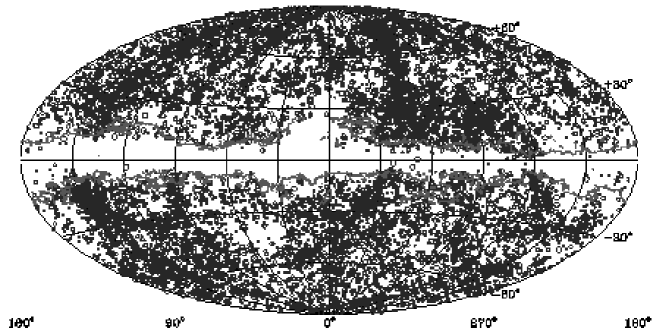
The distribution of these galaxies is displayed in Galactic coordinates in Fig. 1 in an equal-area Aitoff projection centered on the Galactic Bulge (). The galaxies are diameter-coded, so that structures relevant for the dynamics in the local Universe stand out accordingly. Most conspicuous in this distribution is, however, the very broad, nearly empty band of about 20∘. Why this Zone of Avoidance? Optical galaxy catalogs are limited to the largest galaxies. They therefore become increasingly incomplete close to the Galactic Equator where the dust thickens. This diminishes the light emission of the galaxies and reduces their visible extent. Such obscured galaxies are not included in diameter- or magnitude-limited catalogs because they appear small and faint – even though they might be intrinsically large and bright. A further complication is the growing number of foreground stars close to the Galactic Plane (GP) which fully or partially block the view of galaxy images.
Comparing this “band of few galaxies” with the currently available dust extinction maps of the DIRBE experiment Sch98 , we can see that the ZOA – the area where the galaxy counts become severely incomplete – is described almost perfectly by the absorption contour in the blue of (where is 4.14 times the extinction Car89 ). This contour matches the ZOA defined by Shapley Sha61 closely.
1.1 Constraints due to the Milky Way
Why is the distribution of galaxies behind the Milky Way important, and why is it not sufficient to study galaxies and their large-scale distribution away from the foreground “pollution” of the Milky Way?
In the last 20 years, enormous effort and observation time has been devoted to map the galaxy distribution in space. It was found that galaxies are located predominantly in clusters, sheets and filaments, leaving large areas devoid of luminous matter (see Fai98a for a detailed observational description of “Large-Scale Structures in the Universe”).
Our Galaxy is part of the Local Group (LG) of galaxies, a small, gravitationally bound group of galaxies consisting of a few bright spiral galaxies and about 2 dozen dwarf galaxies. Our LG lies in the outskirts of the Local Supercluster, a flattened structure of about 30 Mpc, centered on the Virgo galaxy cluster with a few thousand galaxies (including its numerous dwarfs). Many such superclusters have meanwhile been charted. The nearby ones can actually be identified in the 2-dimensional galaxy distribution of Fig. 1: the Local Supercluster is visible as a great circle (the Supergalactic Plane) centered on the Virgo cluster at , the Perseus-Pisces supercluster which bends into the ZOA at and , and the general galaxy overdensity in the Great Attractor (GA) region (). Most of these superclusters and wall-like structures have massive clusters at their centers.
The lack of data in the ZOA severely constrains the studies of these structures in the nearby Universe, the origin of the peculiar velocity of the Local Group, and other streaming motions. Such studies are dependent on an accurate description of the whole sky distribution of galaxies, as described in the following sections.
Peculiar Motion of the Local Group of Galaxies.
The Cosmic Microwave Background radiation (CMB) of K – the relic radiation of the hot early Universe – shows a dipole of about 0.1%. This dipole is explained by a peculiar motion of the LG on top of the uniform Hubble expansion of 630 km s-1 towards the Galactic coordinates Kog93 induced by the gravitational attraction of the irregular mass distribution in the nearby Universe (see Fig. 1). Part of this motion can be explained by the acceleration of the LG towards Virgo, the center of the Local Supercluster ( km s-1 towards ). The remaining component of km s-1 towards San84 ; Sha84 hence must arise from other mass concentrations and/or voids in the nearby Universe. The determination of the peculiar motion on the LG, i.e. its net gravity field, requires whole-sky coverage. Here, the lack of data in about 25% of the optical extragalactic sky is a severe handicap.
Various dipole determinations have assumed a uniformly filled ZOA or have used cloning methods which transplant the fairly well-mapped adjacent regions into the ZOA. Both procedures are unsatisfactory, because inhomogeneous data coverage will introduce non-existing flow fields. The derived results on the apex of the LG motion, as well as the distance at which convergence is attained, still are controversial. Kolatt et al.Kol95 , for instance, have shown that the mass distribution within the inner of the ZOA – as derived from theoretical reconstructions of the density field (see Sect. 7) – is crucial to the derivation of the gravitational acceleration of the LG: the direction of the motion measured within a volume of 6000 km s-1 will change by when the (reconstructed) mass within the ZOA is included. Care should therefore be taken on how to extrapolate the galaxy density field across the ZOA. Obviously, a reliable consensus on the galaxy distribution in the ZOA is important to minimize these uncertainties.
Nearby Galaxies.
In this context, not only the identification of unknown and suspected clusters, filaments and voids are relevant, but also the detection of nearby smaller entities. The peculiar velocity of the LG, , is proportional to the net gravity field , which can be determined by summing up the masses of the individual galaxies at their distances :
where is the density parameter and the bias parameter. The gravity field as well as the light flux of a galaxy decreases with . The direction and amplitude of the peculiar velocity therefore is directly related to the sum of the apparent magnitudes of the galaxies in the sky through
for a constant mass-to-light ratio. This has important implications and suggests, for instance, that the galaxy Cen A with an absorption-corrected magnitude of exerts a stronger luminosity-indicated gravitational attraction on the Local Group than the whole Virgo cluster. However, in this context, the question whether the mass-to-light ratio is constant, i.e. no biasing occurs, is doubtful, a problem inherent to all cumulative dipole determinations. These calculations also predict that the 8 apparently brightest galaxies – which are all nearby ( km s-1) – are responsible for 20% of the total dipole as determined from optically known galaxies within km s-1. Hence, a major part of the peculiar motion of the LG is generated by a few average, but nearby galaxies.
In this sense, the detection of other nearby galaxies hidden by the obscuration of the Galaxy can be as important as the detection of entire clusters at larger distances. The expectation of finding additional nearby galaxies in the ZOA is not unrealistic. Six of the nine apparently brightest galaxies are located in the ZOA: IC342, Maffei 1 and 2, NGC4945, CenA and the recently discovered galaxy Dwingeloo 1 (see Sect. 5.1). Moreover, the presence of an unknown Andromeda-like galaxy behind the Milky Way would have implications for the internal dynamics of the LG, the mass determination of the LG, and the present density of the Universe from timing arguments Pee94 .
Cosmic Flow Fields such as in the Great Attractor Region.
Density enhancements locally decelerate the uniform expansion field, as has been observed within our own Local Supercluster. Vice versa, systematic streaming motions over and above the uniform expansion field usually indicate mass overdensities (accelerations) or voids (decelerations). Knowing (a) the observed recessional velocity of a galaxy through its redshift
where is the rest wavelength, and is the observed wavelength, and (b) a redshift-independent distance estimate , the peculiar motion of a galaxy due to the underlying mass density field can be determined:
where is the recession velocity a galaxy would have in an unperturbed expansion field (). In this manner, the mass density field can be determined independent of the galaxy distribution and/or an assumption on the mass-to-light ratio.
Based on these considerations, Dressler et al.Dre87 identified a systematic infall pattern from peculiar velocities of about 400 elliptical galaxies which was interpreted as being due to a hypothetical Great Attractor with a mass of , at a position in redshift space of km s-1) Lyn88 . A more recent study by Kolatt et al.Kol95 , based on a larger data set (elliptical and spiral galaxies) and the potential reconstruction method POTENT (see Sect. 7 and Fig. 17) place the center of the GA right behind the Milky Way. Recent consensus is that the GA is an extended region () of moderately enhanced galaxy density centered behind the Galactic Plane. Although there is a considerable excess of optical galaxies and IRAS-selected galaxies in this region (see Fig. 1 and Fig. 9), no dominant cluster or central peak can been seen. However, a major part of the GA is hidden by the Milky Way.
Connectivity of Superclusters Across the ZOA.
Various large-scale structures are ‘bisected’ by the Milky Way. What is their true extent? These large-scale structures, their sizes, and the distribution of the various galaxy types within these structures, carry information on the conditions and formation processes of the early Universe, providing important constraints which must be reproduced in cosmological models. It is therefore valuable to fully outline these superclusters across the ZOA.
It is curious, that the two major superclusters in the local Universe, i.e. Perseus-Pisces and the Great Attractor overdensity, lie at similar distances on opposite sides of the LG, and that both are partially obscured by the ZOA. It is therefore of particular interest to map these structures in detail, determine their extent and masses, in order to find out which one of the two is dominant in the tug-of-war on the Local Group.
1.2 Unveiling Large-Scale Structures Behind the Milky Way
For all of the above reasons, the unveiling of galaxies behind the Milky Way has turned into a research field of its own in the last ten years. In the following, I discuss all the various observational multi-wavelength techniques that are currently being employed to uncover the galaxy distribution in the ZOA such as deep optical searches, far-infrared and near-infrared surveys, systematic blind radio surveys and searches for hidden massive X-ray clusters. I will describe the different limitations and selection effects inherent to each method and present results obtained with these various methods – describing the results and discoveries in detail for the Great Attractor region. Predictions from reconstructions of the density field in the ZOA are also presented and compared with observational evidence. The comparison between reconstructed density fields and the observed galaxy distribution are important as they allow derivations of the density and biasing parameters and .
2 Optical Galaxy Searches
Systematic optical galaxy catalogs are generally limited to the largest galaxies (typically with diameters , e.g. Lau82 ). These catalogs become, however, increasingly incomplete for galaxies the closer they are to the Galactic Plane. With the thickening of the dust layer, the absorption increases and reduces the brightness of the galaxies and their ‘visible’ extension. Obviously such galaxies are not intrinsically faint; they only appear faint because of the dimming by the dust. Systematical deeper searches for partially obscured galaxies – down to fainter magnitudes and smaller dimensions compared to existing catalogs – have been performed on sky surveys with the aim of reducing this ZOA.
2.1 Early Searches and Results
One of the first attempts to detect galaxies in the ZOA was carried out by Böhm-Vitense in 1956 Boh56 . She did follow-up observations in selected fields in the GP in which Shane & Wirtanen Sha54 found objects that ”looked like extragalactic nebulae” but were not believed to be galaxies because they were so close to the dust equator. She confirmed many galaxies and concluded that the obscuring matter in the plane must be extremely thin and full of holes between -.
Because extinction was known to be low in Puppis, Fitzgerald Fit74 performed a galaxy search on a field there () and discovered 18 small and faint galaxies. Two years later, Dodd & Brand Dod76 examined 3 fields adjacent to this area () and detected another 29 galaxies. Kraan-Korteweg & Huchtmeier Kra92 observed these galaxies at radio wavelengths with the 100 m radio telescope at Effelsberg in Germany. This method was chosen because extinction is unimportant at these long wavelengths and the neutral gas of spiral galaxies can easily be observed at 21 cm (see Sect. 5). With these observations, a previously unknown nearby cluster at ( km s-1) could be identified. Adding far-infrared data (see Sect. 3), it was shown that this Puppis cluster is comparable to the Virgo cluster and that it contributes a significant component to the peculiar motion of the LG Lah93 .
During a search for infrared objects Weinberger et al.Wei76 , detected two galaxy candidates near the Galactic Plane () which Huchra et al.Huc77 confirmed in 1977 to be the brightest members of a galaxy cluster at 4200 km s-1. This discovery led Weinberger Wei80 to start the first systematic galaxy search. Using the red prints of the Palomar Sky Survey, he covered the whole northern GP (-) in a thin strip . He found 207 galaxies, the distribution of which is highly irregular: large areas disclose no galaxies, the ”hole” pointed out by Böhm-Vitense was verified, but most conspicuous was a huge excess of galaxies around -. In 1984, Focardi et al.Foc84 made the connection with large-scale structures: they interpreted the excess as the possible continuation of the Perseus-Pisces cluster [PP] across the plane to the cluster A569. Radio-redshift measurements by Hauschildt Hau87 established that the PP cluster at a mean redshift of km s-1 extends to the cluster 3C129 in the GP (). Additional H I and optical redshift measurements of Zwicky galaxies by Chamaraux et al.Cham90 indicate that this chain can be followed even further to the A569 cloud at km s-1 on the other side of the ZOA.
These early searches proved that large-scale structure can be traced to very low Galactic latitudes despite the foreground obscuration and its patchy nature which shows clumpiness and clustering in the galaxy distribution independent of large-scale structure. The above investigations did confirm suspected large-scale features across the plane through searches in selected regions and follow-up redshift observations. To study large-scale structure, systematically broader latitude strips covering the whole Milky Way, respectively the whole ZOA (see Fig. 1) are required.
2.2 Status of Systematic Optical Searches
Using existing sky surveys such as the first and second generation Palomar Observatory Sky Surveys POSS I and POSS II in the north, and the ESO/SRC (United Kingdom Science Research Council) Southern Sky Atlas, various groups have performed systematic deep searches for “partially obscured” galaxies. They catalogued galaxies down to fainter magnitudes and smaller dimensions () than previous catalogs. Here, examination by eye remains the best technique. A separation of galaxy and star images can as yet not be done on a viable basis below - by automated measuring machines such as e.g. COSMOS Dri95 or APM Lew96 and sophisticated extraction algorithms, nor with the application of Artificial Neural Networks. Thus, although surveys by eye clearly are both very trying and time consuming – and maybe not as objective – they currently still provide the best technique to identify partially obscured galaxies in crowded star fields.
Meanwhile, through the efforts of various collaborations, nearly the whole ZOA has been surveyed and over 50000 previously unknown galaxies could be discovered in this way. These surveys are not biased with respect to any particular morphological type. The various surveyed regions are displayed in Fig. 2. Details and results on the uncovered galaxy distributions can be found in the respective references listed below:
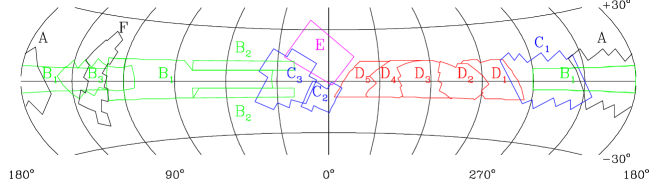
A: the Perseus-Pisces Supercluster by Pantoja Pan97 ; B1-3: the northern Milky Way (B1 by Seeberger et al.See94 ; See96 ; See98 , Lercher et al.Ler96 , and Saurer et al.Sau97 , from POSS I; B2 by Marchiotto et al.Mar99 also from POSS II; B3 by Weinberger et al.Wei99 from POSS II);
C1-3: the Puppis region by Saito et al.Sai90 ; Sai91
[C1], the Sagittarius/Galactic region by Roman et al.Rom98 [C2], and the Aquila and Sagittarius region by Roman et al.Rom96 [C3];
D1-5: the southern Milky Way (the Hydra to Puppis region [D1]
by Salem & Kraan-Korteweg Sal00 , the Hydra/Antlia Supercluster
region [D2] by Kraan-Korteweg Kra00 , the Crux region [D3] by
Woudt Wou98 , Woudt & Kraan-Korteweg Wou00a , the GA region [D4] by Woudt Wou98 , Woudt & Kraan-Korteweg Wou00b , and the Scorpius region
[D5] by Fairall & Kraan-Korteweg Fai00 ; E: the Ophiuchus Supercluster by Wakamatsu et al.Wak94 ,Hasegawa et al.Has00 ;F: the northern GP/SGP crossing by Hau et al.Hau95 .
2.3 The Galaxy Distribution in the Great Attractor Region
Most of these searches have quite similar characteristics. As an example, I discuss in the following the optical galaxy search performed by our group in the Great Attractor region (D1-5).
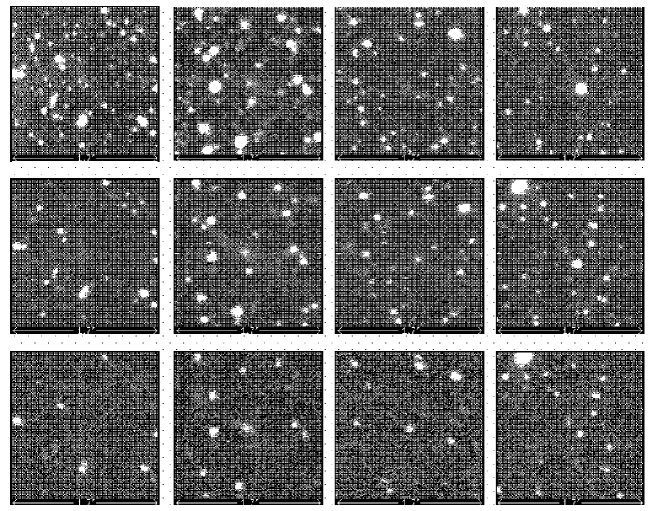
The tools for this galaxy search were simple. It comprised a viewer with the ability to magnify 50 times and the IIIaJ film copies of the ESO/SRC survey. The viewer projects an area of on a screen, making the visual, systematic scanning of these plates quite straightforward and comfortable.
Even though Galactic extinction effects are stronger in the blue, the IIIaJ films were searched rather than their red counterparts. Comparison between the various surveys demonstrated that the hypersensitized and fine grained emulsion of the IIIaJ films go deeper and show higher resolution. Even in the deepest extinction layers of the ZOA, the red films were found to have no advantage over the IIIaJ films.
A diameter limit of was imposed. Below this diameter the reflection crosses of the stars disappear, making it hard to differentiate consistently between stars or blended stars and faint galaxies. The positions of all the galaxies are measured with the Optronics, a high precision measuring machine, at ESO (European Southern Observatories) in Garching, Germany. The accuracy of these positions is about . For every galaxy we recorded the major and minor diameter, an estimate of the average surface brightness and the morphological type of the galaxy. From the diameters and the average surface brightness a magnitude estimate was derived. A surprisingly good relation was found for the estimated magnitudes, with no deviations from linearity even for the faintest galaxies, and a scatter of only Kra00 . In this manner over 17 000 galaxies in about 1800 sq. deg. could be identified, of which 97% were previously unknown. Their distribution is displayed in Fig. 3 together with all the Lauberts galaxies larger than (diameter-coded as in Fig. 1) as well as the DIRBE foreground extinction contours of , and .
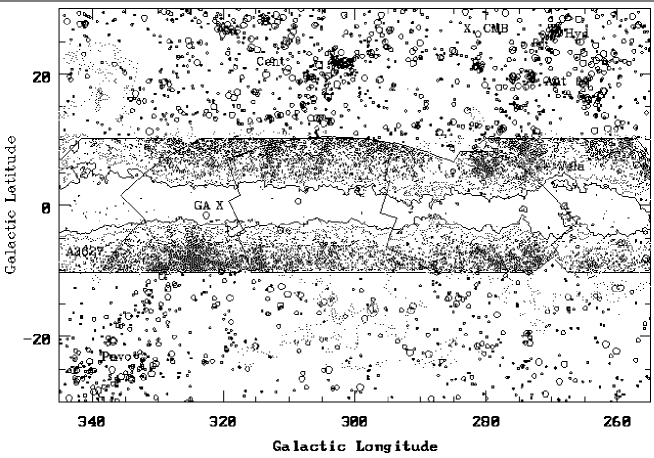
The distribution reveals that galaxies can easily be traced through obscuration layers of 3 magnitudes, thereby narrowing the ZOA considerably. A few galaxies are still recognizable up to extinction levels of and a handful of very small galaxy candidates have been found at even higher extinction levels. The latter most likely indicate holes in the dust layer. Overall, the mean number density follows the dust distribution remarkably well at low Galactic latitudes. The contour level of , for instance, is nearly indistinguishable from the galaxy density contour at 0.5 galaxies per square degree.
At intermediate extinction levels (between the outer and second extinction contour ), distinct under- and overdensities are noticeable in the unveiled galaxy distribution that are uncorrelated with the foreground obscuration. They must be the signature of large-scale structures.
The most extreme overdensity is found at ). It is at least a factor 10 denser compared to regions at similar extinction levels. This galaxy excess is centered on the cluster A3627. It is the only cluster out of 4076 clusters in the Abell cluster catalog Abe89 .Although it is (a) classified as a rich, nearby cluster, (b) the only Abell cluster identified below , and (c) within a few degrees of the predicted center of the GA Kol95 , this cluster had not received any attention. This is mainly due to the foreground obscuration. A3627 is hardly discernable in, for instance, the distribution of Lauberts galaxies: the observed diameters of the galaxies in this density peak are just below the Lauberts diameter limit (due to the obscuration). This cluster is not evident in the far infrared (see Sect. 3). This can be explained by the predominance of early-type galaxies (50% in the core of this cluster, 25% within its Abell radius) which do not radiate in the far infrared but are a clear signature of rich clusters. The new data support the classification of A3627 as a rich cluster: over 600 likely new cluster members were identified compared to the 50 larger galaxies noted by Abell.
The galaxies detected in these searches are quite small () and faint () on average. So the question arises whether these new galaxies and the newly uncovered over- and underdensities are relevant at all to our understanding of the dynamics in the local Unverse. To assess this, we have to understand the effects of extinction: galaxies are diminished by at least of foreground extinction at the highest latitudes () of the search areas. These effects increase considerably closer to the Galactic Equator. The effects of the absorption on the observed parameters of these low-latitude galaxies is reflected clearly in Fig. 4. Here, the magnitudes and major diameters of galaxies in the Hydra/Antlia search region (D2) are plotted against the Galactic extinction derived from the 100 micron DIRBE dust maps Sch98 . The top panels show the observed magnitudes (left) and diameters (right).
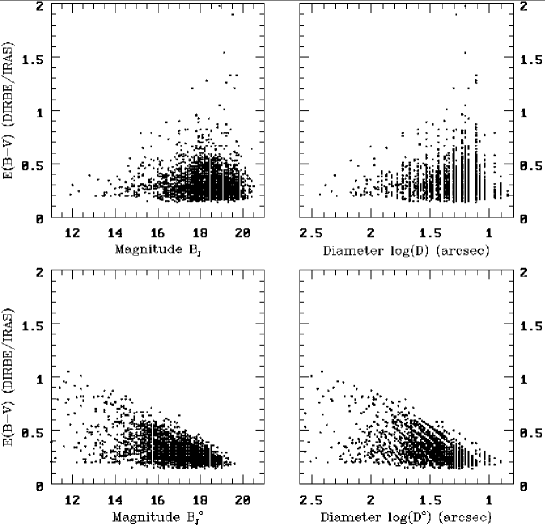
The distribution of both the observed magnitudes and diameters show a distinct cut-off as a function of extinction – all the galaxies lie in the lower right triangle of the diagram, leaving the upper left triangle empty. At low extinction values, bright and faint galaxies can be identified, whereas apparently faint and small galaxies remain visible only at higher extinction values. The division in the diagram defines an upper envelope of the intrinsically brightest and largest galaxies. This fiducial line, i.e. the shift to fainter apparent magnitudes of the intrinisically brightest galaxies, is a direct measure of the absorption . In fact, this shift in magnitude is tightly correlated with the absorption in the blue . The galaxies at these extinction levels are not intrinsically faint. They must in fact be intrinsically very bright galaxies to still be visible through the murk of the Milky Way.
The obscuration effects on the parameters of galaxies have been studied in detail by Cameron Cam90 who simulated the effects of absorption on the brightness profiles of various Virgo galaxies. This led to analytical descriptions of the diameter and isophotal magnitude corrections given in Table 1 for early-type and spiral galaxies:
| Reduction factor | Additional m | |
|---|---|---|
| ellipticals/lenticulars | ||
| spirals |
For example, a spiral galaxy, seen through an extinction of , is reduced to of its unobscured size. Only of a (spiral) galaxy’s original dimension is seen when it is observed through , and its isophotal magnitude will be diminished by . Applying these corrections to the optical ZOA galaxy samples invert the trends in the magnitude and diameter distributions. This can be verified in the lower panels of Fig. 4 where the extinction-corrected magnitudes and diameters are plotted. At high extinction only the intrinsically bright galaxies can be identified. These deep optical galaxy searches hence do uncover intrinsically bright galaxies at lower latitudes.
Correcting the galaxies identified in deep optical searches for absorption partially lifts the veil of the Milky Way. Without the extinction layer, the Lauberts catalog would have, for instance, found 139 galaxies with within the Abell radius Mpc for A3627 compared to the previously identified 31 galaxies, where , the dimensionless Hubble parameter is 1 for a Hubble constant of km s-1 Mpc-1 ( km s-1 Mpc-1). This makes this cluster the most prominent overdensity in the southern sky. Were it not for the obscuration, it most likely would have been the best-studied cluster in the Universe.
2.4 Redshift Follow-ups and the Cluster A3627
Analazing the galaxy density as a function of the galaxy size, magnitude and/or morphology in combination with the foreground extinction has led to the identification of various important large-scale structures in the ZOA and their approximate distances. Redshift observations must be obtained to map the large-scale structures in redshift space. So far, this has been pursued extensively in the Perseus-Pisces supercluster Pan97 , the Puppis region Cham99 , the Ophiuchus supercluster behind the Galactic Bulge area Has00 and the southern ZOA. Here again, I concentrate on the results from various observing programs in the Great Attractor region. For a listing of the mapping of other large-scale structures and references see Kraan-Korteweg & Woudt Kra99 .
For the survey regions D1-5 we use complementary observing approaches to obtain the redshifts (see Kra94a for a more detailed description):
– multifiber spectroscopy with the MEFOS instrument Fel97 at the 3.6m telescope of ESO. This instrument has the ability to obtain 29 spectra simultaneously within a one-degree circular field; ideally suited to probe the densest regions in the uncovered galaxy distribution,
– individual spectroscopy of all the brighter galaxies (, depending on the central surface brightness of a galaxy) with the 1.9m telescope of the South African Astronomical Observatory (SAAO) Kra95 ; Fai98b ; Wou99 . This method allows homogeneous coverage over the whole search area, – 21cm observations of extended, low surface-brightness spiral galaxies with the 64m radio telescope in Parkes, Australia Kra97 . The radio observations are an important addition as it is impossible to obtain good signal-to-noise optical spectra for highly obscured low-surface brightness galaxies whereas the 21cm radiation is not influenced by the dust.
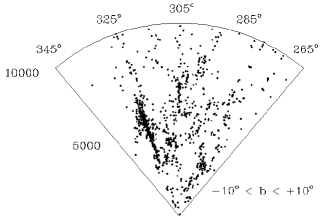
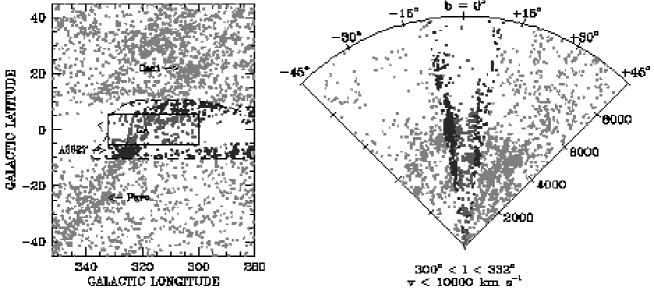
With the above observations, we typically obtain redshifts of of the galaxies and can trace large-scale structures out to recession velocities of km s-1. To focus again on the GA region, a redshift “slice” (the distribution of a certain region on the sky as a function of redshift) out to 10000 km s-1 is shown in the left-hand panel of Fig. 5 for our optical survey region (, ): a region that previously was largely blank now reveals clusters, superclusters and voids. In this illustration, the ZOA is now comparable to other unobscured regions of the sky. The radially very extended feature at – the location of the cluster A3627 – is the signature of a galaxy cluster: the “finger of God” feature due to the velocity dispersion of a virially bound cluster.
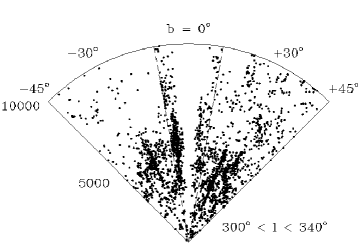
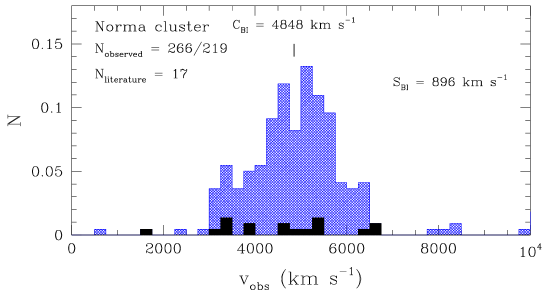
On the right-hand panel, all structures within the general GA region () are displayed with structures adjacent to the Milky Way (). Here we can clearly discern the Hydra (), Antlia () and bimodal Centaurus clusters on the northern side of the Galactic Plane and the Pavo cluster () on the southern side. It is impressive to note that the new redshifts in the A3627 cluster area prove this cluster to be the dominant structure within the general GA overdensity. While this cluster includes the well-researched radio galaxy PKS1610601, relatively few redshifts of other cluster members were known beforehand. Adding, however, the new ZOA redshift data, we find a near Gaussian distribution of the velocities, resulting in a mean observed velocity of km s-1 and a velocity dispersion of km s-1. This is displayed in Fig. 6 where the dark shaded histogram identifies previously known galaxies and the light shaded histogram the redshift data from our ZOA program.
The large dispersion suggests A3627 to be a massive cluster. The dynamical mass within a radius Sar86 is given by
where is the measured line-of-sight velocity dispersion (corrected for the errors in the velocity measurements), is the core radius Kin62 , G is the gravitational constant, and .
With a core radius of 0.29 Mpc, a virial mass within the Abell radius Mpc of
is found for A3627. This mass is typical of rich clusters, and comparable, for instance, to the well-studied Coma cluster Hug90 ; Whi93 . The latter was already identified in 1906 by Wolf Wol06 in the distribution of nebulae (galactic and extragalactic). With a mean redshift of 6960 km s-1, the Coma cluster counted as the nearest rich cluster. At a mean redshift of 4848 km s-1, this place is now being usurped by the A3627 cluster, also called Norma cluster for the constellation it lies in.
Rich massive clusters generally are strong X-ray emitters (see Sect. 6) and were identified early on with X-ray satellites (Einstein, HEAO, Uhuru) – except for A3627. However, A3627 was detected in a whole-sky survey by the X-ray satellite ROSAT, in which the Norma cluster ranks as the 6th brightest X-ray cluster in the sky compared to Coma, which ranks 4 Boh96 .
The mean velocity of the Norma cluster puts it well within the predicted velocity range of the GA. Including the new results from the deep optical galaxy search, the Norma cluster now is the most massive galaxy cluster in the GA region known to date. It most likely marks the previously unidentified but predicted density-peak at the bottom of the potential well of the GA overdensity.
The mass excess of the GA is presumed to arise within an area of radius of about 20 Mpc Lyn91 . These extended potential wells generally have a rich cluster at their center. This actually matches the emerging picture quite well: A3627 appears to lie at the center of an apparent “great wall”-like structure, similar to Coma in the (northern) Great Wall. The right-hand redshift slice of Fig. 5 suggests a very large-scale coherent structure, starting at Pavo () and moving towards the density peak of A3627 at slightly larger velocities. This supercluster then seems to bend towards or merge with the Vela supercluster at km s-1) postulated by Kraan-Korteweg et al.Kra94a .
One can, however, not exclude the possibility that other unknown rich clusters reside in the GA region, as the ZOA has not been fully mapped with the optical galaxy searches (see Fig. 3 and right panel of Fig. 5). Finding a further uncharted, rich cluster of galaxies at the heart of the GA would have serious implications for our current understanding of this massive overdensity in the local Universe. Various indications suggest, for instance, that PKS1343601, the second brightest extragalactic radio source in the southern sky, might form the center of yet another highly obscured rich cluster Kra99 , particularly as it also shows significant X-ray emission. At (, this radio galaxy lies behind an obscuration layer of about 12 magnitudes of extinction in the B-band, hence optical surveys are ineffective. Still, West & Tarenghi observed this source in 1989 Wes89 : with an extinction-corrected diameter of and a recession velocity of km s-1 this galaxy appears to be a giant elliptical galaxy and giant ellipticals are mainl found at the cores of clusters.

Since PKS1343601 is so heavily obscured, little data are available to substantiate the existence of this prospective cluster. In Fig. 7 the A3627 cluster at a mean extinction as seen in deep optical searches is compared to the prospective PKS1343 cluster at ( km s-1) with an extinction of 12m. One can clearly see, that at the low Galactic latitude of the suspected cluster PKS1343, the optical galaxy survey could not retrieve the underlying galaxy distribution, especially not within the Abell radius of the suspected cluster (the inner circle in the right panel of Fig. 7). To verify this cluster, other observational approaches are necessary. Interestingly enough, deep H I observations did uncover a significant excess of galaxies at this position in velocity space (see Sect. 5.3) although a “finger of God”, the characteristic signature of a cluster in redshift space, is not seen. Hence, the Norma cluster A3627 remains the best candidate for the center of the extended GA overdensity.
2.5 Completeness of Optical Galaxy Searches
In order to merge the various deep optical ZOA surveys with existing galaxy catalogs, Kraan-Korteweg Kra00 and Woudt Wou98 have analyzed the completeness of their ZOA galaxy catalogs as a function of the foreground extinction. By studying the apparent diameter distribution as a function of the extinction, as shown in Fig. 4, as well as the location of the flattening in the slope of the cumulative observed and extinction-corrected diameter curves and for various extinction intervals (cf. Fig. 6 in Kra00 ), they concluded that the optical ZOA surveys are complete to an apparent diameter of – where the diameters correspond to an isphote of 24.5 mag/arcsec2 – for extinction levels less than (see also Fig. 4).
What about the intrinsic diameters, i.e. the diameters galaxies would have if they were unobscured? Applying the Cameron corrections, it was found that at , an obscured spiral or an elliptical galaxy at the completeness limit would have an intrinsic diameter of , respectively . At extinction levels higher than , an elliptical galaxy with would appear smaller than the completeness limit and might have gone unnoticed. These optical galaxy catalogs should therefore be complete to for all galaxy types down to extinction levels of , with the possible exception of extremely low-surface brightness galaxies. Only intrinsically very large and bright galaxies – particularly galaxies with high surface brightness – will be recovered in deeper extinction layers. This completeness limit could be confirmed by independently analyzing the diameter vs. extinction and the cumulative diameter diagrams for extinction-corrected diameters.
We can thus supplement the ESO, UGC and MCG catalogs (see Fig. 1), which are complete to , with galaxies from optical ZOA galaxy searches that have and . As our completeness limit lies well above the ESO, UGC and MCG catalogs, we can assume that the other similarly performed optical galaxy searches in the ZOA should also be complete to for extinction levels of .
With Fig. 8, the first attempt has been made to arrive at an improved whole-sky galaxy distribution with a reduced ZOA. In this Aitoff projection all the UGC, ESO, MCG galaxies that have extinction-corrected diameters are plotted [remember that galaxies adjacent to the optical galaxy search regions are also affected by absorption though to a lesser extent ()], including the galaxies other optical surveys for which positions and diameters were available. The regions for which these data are not yet available are marked in Fig. 8. As some searches were performed on older generation POSS I plates, which are less deep compared to the second generation POSS II and ESO/SRC plates, an additional correction was applied to those diameters, i.e. the same correction as for the UGC galaxies which also are based on POSS I survey material ().
A comparison of Fig. 1 with Fig. 8 demonstrates convincingly how the deep optical galaxy searches realize a considerable reduction of the ZOA; we can now trace the large-scale structures in the nearby Universe to extinction levels of . Inspection of Fig. 8 reveals that the galaxy density enhancement in the GA region is even more pronounced and a connection of the Perseus-Pisces chain across the Milky Way at more likely. Hence, these supplemented whole-sky maps certainly should improve our understanding of the velocity flow fields and the total gravitational attraction on the Local Group.
Optical galaxy searches, however, fail in the most opaque part of the Milky Way, the region encompassed by the contour in Fig. 8 – a sufficiently large region to hide further dynamically important galaxy densities. Here, other systematic surveys in other wavebands can be applied to reduce the current ZOA even further. The success and status of these approaches are discussed in the following sections.
3 Far Infrared Surveys and the ZOA
In 1983, the Infrared Astronomical Satellite IRAS surveyed 96% of the whole sky in the far infrared bands at 12, 25, 60 and 100 m, resulting in a catalog of 250 000 point sources, i.e. the IRAS Point Source Catalogue Joi88 . The latter has been used extensively to quantify extragalactic large-scale structures. The identification of the galaxies from the IRAS data base is quite different compared to the optical: only the fluxes at the 4 far infrared (FIR) IRAS passbands are available but no images. The identification of galaxies is strictly based on the relation of the fluxes. For instance, Yamada et al.Yam93 used the criteria: 1. Jy, 2. , 3. , to select galaxy candidates from the IRAS PSC.
With these flux and color criteria mainly normal spiral galaxies and starburst galaxies are identified. Hardly any dwarf galaxies enter the IRAS galaxy sample, nor the dustless elliptical galaxies, as they do not radiate in the far infrared. The upper cut-off in the third criterion is imposed to minimize the contamination with cool cirrus sources and young stellar object within our Galaxy. This, however, also makes the IRAS surveys less complete for nearby galaxies Wou98 ; Kra00 .
The advantage of using IRAS data for large-scale structure studies is its homogeneous sky coverage (all data from one instrument) and the negligible effect of the extinction on the flux at these long wavelengths. Even so, it remains difficult to probe the inner part of the ZOA with IRAS data because of cirrus, high source counts of Galactic objects in the Galaxy, and confusion with these objects – most of them have the same IRAS characteristics as external galaxies. The difficulty in obtaining unambiguous galaxy identifications at these latitudes was demonstrated by Lu et al.Lu90 , who found that the detection rate of IRAS galaxy candidates decreases strongly as a function of Galactic latitude (from to ). This can only be explained by the increase in faulty IRAS galaxy identifications. Yamada et al.Yam93 also found a dramatic and unrealistic increase in possible galaxies close to the Galactic Plane in their systematic IRAS galaxy survey of the southern Milky Way ().
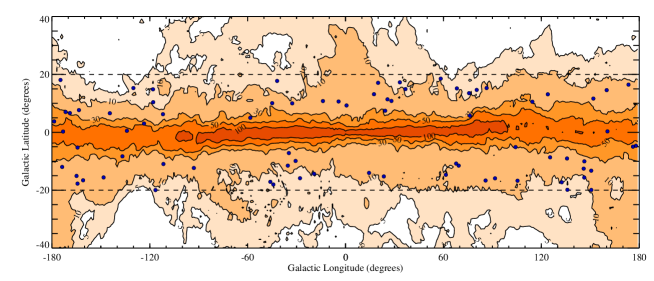
So, despite the various advantages given with IRAS data, the sky coverage in which reliable IRAS galaxy identifications can be made (84%) provides only a slight improvement over optical galaxy catalogs (compare e.g. the light-grey mask in Fig. 9 with the optical ZOA-contour as displayed in Fig. 1). In addition to that, the density enhancements are very weak in IRAS galaxy samples because (a) the IRAS luminosity function is very broad, which results in a more diluted distribution since a larger fraction of distant galaxies will enter a flux-limited sample compared to an optical galaxy sample, and (b) IRAS is insensitive to elliptical galaxies, which reside mainly in galaxy clusters, and mark the peaks in the mass density distribution of the Universe. This is quite apparent in a comparison of the IRAS galaxy distribution (Fig. 9) with the optical galaxy distribution (Fig. 1 and Fig. 8).
Nevertheless, dedicated searches for large-scale clustering within the whole ZOA () have been made by various Japanese collaborations (see Tak96 for a summary). They used IRAS color criteria to select galaxy candidates which were subsequently verified through visual examination on sky surveys, such as the POSS of the northern hemisphere and the ESO/SRC for the southern sky. Because of their verification procedure, this data-set suffers, however, from the same limitations in highly obscured regions as optical surveys.
Based on redshift follow-ups of these ZOA IRAS galaxy samples, they established various filamentary features and connections across the ZOA. Most coincide with the structures uncovered in optical work. In the northern Milky Way both crossings of the Perseus-Pisces arms into the ZOA are very prominent – considerably stronger in the FIR than at optical wavelengths – and they furthermore identified a new structure: the Cygnus-Lyra filament at ( km s-1). Across the southern Milky Way they confirmed the three general concentrations of galaxies around Puppis (), the Hydra-Antlia extension (, Kra95 ) and the Centauraus Wall (). However, the cluster A3627 is not seen, nor is the Great Attractor very prominent compared to the optical or to the POTENT reconstructions described in Sect. 7.
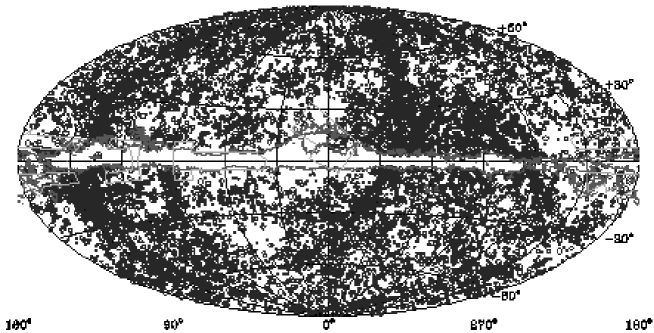
Besides the search for the continuity of structures across the Galactic Plane, the IRAS galaxy samples have been widely used for the determination of the peculiar motion of the Local Group, as well as the reconstructions of large-scale structure across the Galactic Plane (see Sect. 7). This has been performed on two-dimensional IRAS galaxy distribution and, in recent years, as well as on their distribution in redshift space with the availability of redshift surveys for progressively deeper IRAS galaxy samples, i.e. 2658 galaxies to f Jy Str92 , 5321 galaxies to f Jy Fish95 , and lately the PSCz catalog of 15411 galaxies complete to f Jy with 84% sky coverage and a depth of 20000 km s-1 Sau00b .
The PSCz is in principal deep enough to see convergence of the dipole. Saunders and collaborators realized, however, that the 16% of the sky missing from the survey causes significant uncertainty, particularly because of the location behind the Milky Way of many of the prominent large-scale structures (superclusters as well as voids). In 1994, they therefore started a longterm program to increase the sky coverage of the PSCz. Optimizing their color criteria to minimize contamination by Galactic sources (, , and ), they extracted a further 3500 IRAS galaxy candidates at lower Galactic latitudes (light-grey area of Fig. 9), reducing the coverage gap to a mere 7% (dark-grey area). Taking band snapshots of all the galaxy candidates of their ‘Behind The Plane’ [BTP] survey, they could add a thousand galaxies to the PSCz sample.
The resulting sky map of 16,400 galaxies (PSCz plus BTP) is shown in Fig. 9 (from Sau00a ). The BTP survey has reduced the “IRAS ZOA” dramatically. Some incompleteness remains towards the Galactic Center, but large-scale structures can easily be identified across most of the Galactic Plane. In the Great Attractor region, the galaxies can be traced (for the first time with IRAS data) to the rich cluster A3627 – the suspected core of the GA Kra96 . The IRAS galaxies overall seem to align well with the Norma supercluster Wou00 . The BTP collaboration is currently working hard on obtaining redshifts for these new and heavily obscured galaxies and exciting new results on large-scale structure across the Milky Way and dipole determinations can be expected in the near future.
4 Near Infrared Surveys and the ZOA
Observations in the near infrared (NIR) can provide important complementary data to other surveys. With extinction decreasing as a function of wavelength, NIR photons are up to 10 times less affected by absorption compared to optical surveys – an important aspect in the search and study of galaxies behind the obscuration layer of the Milky Way. The NIR is sensitive to early-type galaxies – tracers of massive groups and clusters – which are missed in IRAS and H I surveys (Sect. 3 and 5). In addition, confusion with Galactic objects is considerably lower compared to the FIR surveys. Furthermore, because recent star formation contributes only little to the NIR flux of galaxies (in contrast to optical and FIR emission), NIR data give a better estimation of the stellar mass content of galaxies.
4.1 The NIR Surveys DENIS and 2MASS
Two systematic near infrared surveys are currently being performed. DENIS, the DEep Near Infrared Southern Sky Survey, is imaging the southern sky from in the (m), (m) and (m) bands. 2MASS, the 2 Micron All Sky Survey, is covering the whole sky in the (m), (m) and (m) bands. The mapping of the sky is performed in declination strips, which are in length and 12 arcmin wide for DENIS, and for 2MASS. Both the DENIS and 2MASS surveys are expected to complete their observations by the end of 2000. The main characteristics of the 2 surveys and their respective completeness limits for extended sources are given in Table 2 Epch97 ; Epch98 ; Skr97 ; Skr98 .
Details and updates on completeness, data releases and data access for DENIS and 2MASS can be found on the websites http://www-denis.iap.fr, and http://www.ipac.caltech.edu/2mass, respectively.
The DENIS completeness limits (total magnitudes) for highly reliable automated galaxy extraction (determined away from the ZOA, i.e. ) are , , Mam98 . The number counts per square degrees for these completeness limits are 50, 28 and 3 respectively. For 2MASS, the completeness limits are , , (isophotal magnitudes), with number counts of 48, 40 and 24. In all wavebands, except , the number counts are quite imprecise due to the low number statistics and the strong dependence on the star crowding in the analyzed fields. Still, they suffice to reveal the promise of NIR surveys at very low Galactic latitudes. As illustrated in Fig. 10, the galaxy density in the band in unobscured regions is 110 galaxies per square degree for the completeness limit of Gar96 . These counts drop rapidly with increasing obscuration: deg-2. The decrease in detectable galaxies due to extinction is much slower in the NIR, i.e. 45%, 21%, 14% and 9% compared to the optical for the , , and bands. This dependence makes NIR surveys very powerful at low Galactic latitudes even though they are not as deep as the POSS and ESO/SRC sky surveys: the NIR counts of the shallower NIR surveys overtake the optical counts at extinction levels of -. The location of the reversal in efficiency is particularly opportune because the NIR surveys become more efficient where deep optical galaxy searches become incomplete, i.e. at (see Sect. 2.5).
| DENIS | 2MASS | ||||||
| Channel | |||||||
| Central wavelength | m | m | m | m | m | m | |
| Arrays | 1024x1024 | 256x256 | 256x256 | 256x256 | 256x256 | 256x256 | |
| Pixel size | |||||||
| Integration time | 9s | 10s | 10s | 7.8s | 7.8s | 7.8s | |
| Completeness limit | |||||||
| for extended sources | |||||||
| Number counts for the | |||||||
| completeness limits | 50 | 28 | 3 | 48 | 40 | 24 | |
| Extinction compared | |||||||
| to the optical | 0.45 | 0.21 | 0.09 | 0.21 | 0.14 | 0.09 | |

The above predictions do not take into account any dependence on morphological type, surface brightness, intrinsic color, orientation and crowding, which may lower the counts of actually detectable galaxies counts.
4.2 Pilot Studies with DENIS Data in the Great Attractor Region
To compare the above predictions with real data, Schröder et al.Sch97 ; Sch99 and Kraan-Korteweg et al.Kra98b examined the efficiency of uncovering galaxies at high extinctions using DENIS images. The analyzed regions include the rich cluster A3627 ( at the heart of the GA (Norma) supercluster as well as its suspected extension across the Galactic Plane.
Three high-quality DENIS strips cross the cluster A3627. The 66 images on these strips that lie within the Abell-radius were inspected by eye. This covers about one-eighth of the cluster area. The extinction over the regarded cluster area varies as .
On these 66 images, 151 galaxies had previously been identified in the deep optical ZOA galaxy search Wou00b . Of these, 122 were recovered in the , 100 in the , and 74 in the band. Most of the galaxies not re-discovered in are low surface brightness spiral galaxies.
Surprisingly, the band provided better galaxy detection than the band. In the latter, the severe star crowding makes identification of faint galaxies very difficult. At these extinction levels, the optical survey does remain the most efficient in identifying obscured galaxies.
The search for more obscured galaxies was made in the region and , i.e. the suspected crossing of the GA. Of the 1800 images in that area, 385 of the then available DENIS images were inspected by eye (308 in ). 37 galaxies at higher latitudes were known from the optical survey. 28 of these could be re-identified in , 26 in , and 14 in the band. In addition, 15 new galaxies were found in and , 11 of which also appear in the band. The ratios of galaxies found in compared to , and of compared to are higher than in the A3627 cluster. This is due to the higher obscuration level (starting with at the high-latitude border).
On average, about 3.5 galaxies per square degree were found in the band. This roughly agrees with the predictions of Fig. 10. Because of star crowding, one does not expect to find galaxies below latitudes of - in this longitude range Mam94 . Low-latitude images substantiate this – the images are nearly fully covered with stars. Indeed, the lowest Galactic latitude galaxies were found at and (in and only).
Figure 11 shows a few characteristic examples of highly obscured galaxies found in the DENIS blind search. band images are at the top, in the middle and at the bottom. The first galaxy located at ) is viewed through an extinction layer of according to the DIRBE extinction maps Sch98 . It is barely visible in the band. The next galaxy at ) is subject to heavier extinction (), and indeed easier to recognize in the NIR. It is most distinct in the band. The third galaxy at even higher extinction ) is – in agreement with the prediction of Fig. 10 – not visible in the band. Neither is the fourth galaxy at and : this galaxy can not be seen in band either and is very faint only in and .
4.3 Conclusions
The conclusions from this pilot study are that at intermediate latitudes and extinction (, -) optical surveys are superior for identifying galaxies. But despite the extinction and the star crowding at these latitudes, , and photometry from the survey data could be performed successfully at these low latitudes. The NIR data (magnitudes, colors) of these galaxies can therefore add important data in the analysis of these obscured galaxies. They led, for instance, to the preliminary , and galaxy luminosity functions in A3627 (Fig. 2 in Kra98b ).
At lowest latitudes and high extinction ( and -), the search for ‘invisible’ obscured galaxies on existing DENIS-images implicate that NIR-surveys can trace galaxies down to about -. The band was found to be optimal for identifying galaxies up to . NIR surveys can hence further reduce the width of the ZOA.
The NIR surveys are particularly useful for the mapping of massive early-type galaxies – tracers of density peaks in the mass distribution – as these can not be detected with any of the techniques that are efficient in tracing the spiral population in more opaque regions (Sect. 3 and 5).
Nevertheless, NIR surveys are also important with regard to the blue and low surface-brightness spiral galaxies because a significant fraction of them are also detectable in the near infrared. This is confirmed, for instance, with the serendipitous discovery in the ZOA of a large, nearby ( km s-1) edge-on spiral galaxy by 2MASS Hur99 : with an extension in the band of 5 arcmin, this large galaxy is – not unexpectedly for its extinction of at the position of – not seen in the optical Sai91 . Furthermore, the overlap of galaxies found in NIR and H I surveys allows the determination of redshift independent distances via the NIR Tully – Fisher relation Tul77 , and therewith the peculiar velocity field. This will provide important new input on the mass density field “in the ZOA” (Sect. 7).
5 Blind HI Surveys in the ZOA
In the regions of the highest obscuration and infrared confusion, the Galaxy is fully transparent to the 21cm line radiation of neutral hydrogen. H I-rich galaxies can readily be found at lowest latitudes through the detection of their redshifted 21cm emission, though early-type galaxies – tracers of massive groups and clusters – are gas-poor and will not be identified in these surveys. Also very low-velocity extragalactic sources might be missed due to the strong Galactic H I emission, and galaxies close to radio continuum sources.
An advantage of blind H I surveys is the immediate availability of rotational properties of a detected galaxy, next to its redshift, providing insight on the intrinsic properties of these obscured galaxies. The rotational velocity can furthermore be used (in combination with e.g. NIR photometry) to determine the distance in real space from the Tully – Fisher relation, leading to determinations of the mass density field from the peculiar velocities.
Until recently, radio receivers were not sensitive and efficient enough to attempt systematic surveys of the ZOA. Kerr & Henning Ker87 demonstrated, however, the effectiveness of this approach: they pointed the late 300-ft telescope of Green Bank to 1900 locations in the ZOA (1.5% coverage) and detected 19 previously unknown spiral galaxies.
Since then two systematic blind H I searches for galaxies behind the Milky Way were initiated. The first – the Dwingeloo Obscured Galaxies Survey (DOGS) – used the 25 m Dwingeloo radio to survey the whole northern Galactic Plane for galaxies out to 4000 km s-1 Kra94b ; Hen98 ; Riv99 . A more sensitive survey, probing a considerably larger volume (out to 12700 km s-1), is being performed for the southern Milky Way at the 64 m radiotelescope of Parkes Kra98a ; Sta98 ; Hen99 ; Hen00 .
In the following, the observing techniques of these two surveys as well as the first results will be discussed.
5.1 The Dwingeloo Obscured Galaxies Survey
Since 1994, the Dwingeloo 25 m radio telescope has been dedicated to a systematic search for galaxies in the northern Zone of Avoidance (, ). The last few patches of the survey were completed early 1999, using the Westerbork array in total power mode. The 20 MHz bandwidth was tuned to cover the velocity range km s-1.
The 25 m Dwingeloo telescope has a half-power-beamwidth (HPBW) of 36 arcmin. The 15000 survey points required for the survey coverage are ordered in a honeycomb pattern with a grid spacing of . Galaxies are generally detected in various adjacent pointings, facilitating a more accurate determination of their positions through interpolations. The rms noise per channel typically was mJy for a 1 hr integration (12 x 5min).
Because of the duration of the project (15000 hours not including overhead and downtime) the strategy was to first conduct a fast search of 5min integrations ( mJy) to uncover possible massive nearby galaxies whose effect might yield important clues to the dynamics of the Local Group.
The shallow Dwingeloo search ( mJy) has been completed in 1996 yielding five objects (cf. Hen98 for details), three of which were known previously. The most exciting discovery was the barred spiral galaxy Dwingeloo 1 Kra94b .
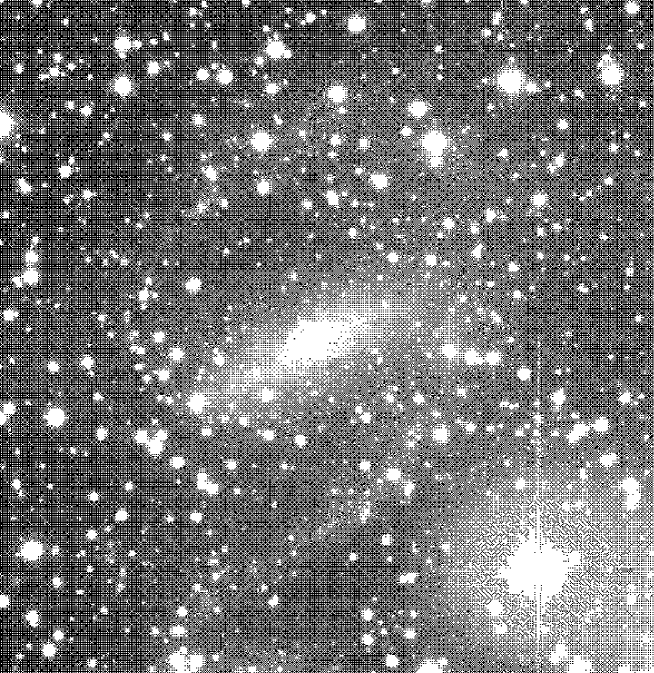
This galaxy candidate was detected early on in the survey through a strong signal (peak intensity of 1.4 Jy) at the very low redshift of km s-1 in the spectra of four neighboring pointings, suggestive of a galaxy of large angular extent. The optimized position of coincided with a very low surface brightness feature on the Palomar Sky Survey plate of , detected earlier by Hau et al.Hau95 in his optical galaxy search of the northern Galactic/SuperGalactic Plane crossing (cf. Sect. 2.2). Despite foreground obscuration of about 6m in the optical, follow-up observations in the , and band at the INT (La Palma) confirmed this galaxy candidate as a barred, possibly grand-design spiral galaxy of type SBb of 4.2 x 4.2 arcmin (cf. Fig. 12).
Dwingeloo 1 has been the subject of much follow-up observations (optical: Loan et al.Loa96 , Buta & McCall But99 ; HI-synthesis: Burtonet al.Bur96 ;CO observations: Kuno et al.Kun96 , Li et al.Li96 , Tilanus & Burton Til97 ; X-ray: Reynolds et al.Rey97 ). To summarize, it is a massive barred spiral, with rotation velocity of 130 km s-1, implying a dynamical mass of roughly one-third the mass of the Milky Way. Its approximate distance of 3 Mpc and angular location place it within the IC342/Maffei group of galaxies. The follow-up HI synthesis observations Bur96 furthermore revealed a counterrotating dwarf companion, Dwingeloo 2. Since then various further dwarf galaxies in this nearby galaxy group have been discovered.
60% of the deeper Dwingeloo survey ( mJy) has been analyzed Riv99 . 36 galaxies were detected, 23 of which were previously unknown. Five of the 36 sources were originally identified by the shallow survey. Based on the survey sensitivity, the registered number of galaxies is in agreement with the Zwaan et al.Zwa97 HI mass function which predicts 50 to 100 detections for the full survey.
Surprisingly, three dwarf galaxies were detected close to the nearby isolated galaxy NGC 6946 at ( km s-1). One of these had earlier been catalogued as a compact High Velocity Cloud Wak90 . Burton et al.Bur99 , in their search for compact isolated high-velocity clouds in the Dwingeloo/Leiden Galactic H I survey Har94 ; Har97 , discovered a further member of this galaxy concentration. Now, seven galaxies with recessional velocities km s-1 have been identified within of the galaxy NGC 6946. More might be discovered as the DOGS data in this region have not yet been fully analyzed. The agglomeration of these various galaxies might indicate a new group or cloud of galaxies in the nearby Universe. As such it would be the only galaxy group in the nearby Universe that is strongly offset (by ) from the Supergalactic Plane Tam78 ; Kra79 .
5.2 The Parkes Multibeam ZOA Blind HI survey
In March 1997, the systematic blind H I survey in the southern Milky Way (; ) began with the Multibeam receiver at the 64 m Parkes telescope. The instrument has 13 beams each with a beamwidth of . The beams are arranged in a hexagonal grid in the focal plane array Sta96 , allowing rapid sampling of large areas.
The observations are being performed in driftscan mode. 23 contiguous fields of length have been defined. Each field is being surveyed along constant Galactic latitudes with latitude offsets 35 arcmin until the final width of has been attained (17 passages back and forth). The ultimate goal is 25 repetitions per field. With an effective integration time of 25 min/beam a 3 detection limit of 25 mJy is obtained. The survey covers the velocity range km s-1 and will be sensitive to normal spiral galaxies well beyond the Great Attractor region.
So far, a shallow survey covering the whole southern Milky Way based on 2 out of the foreseen 25 driftscan passages has been analyzed (cf. Kra98a ; Hen99 ; Hen00 ). A detailed study of the Great Attractor region () based on 4 scans has been made by Juraszek et al.Jur99 ; Jur00 . The first four full-sensitivity cubes are available for that region as well (Sect. 5.3).
In the shallow survey, 110 galaxies were catalogued with peak H I-flux densities of 80 mJy ( mJy after Hanning smoothing). The detections show no dependence on Galactic latitude, nor the amount of foreground obscuration through which they have been detected. Though galaxies up to 6500 km s-1 were identified, most of the detected galaxies (80%) are quite local ( km s-1) due to the (yet) low sensitivity. About one third of the detected galaxies have a counterpart either in NED (NASA/IPAC Extragalactic Database) or in the deep optical surveys.
The distribution of the 110 H I-detected galaxies is displayed in the lower panel of Fig. 13. It demonstrates convincingly that galaxies can be traced through the thickest extinction layers of the Galactic Plane. The fact that hardly any galaxies are found behind the Galactic bulge ( to ) is due to local structure: this is the region of the Local Void.
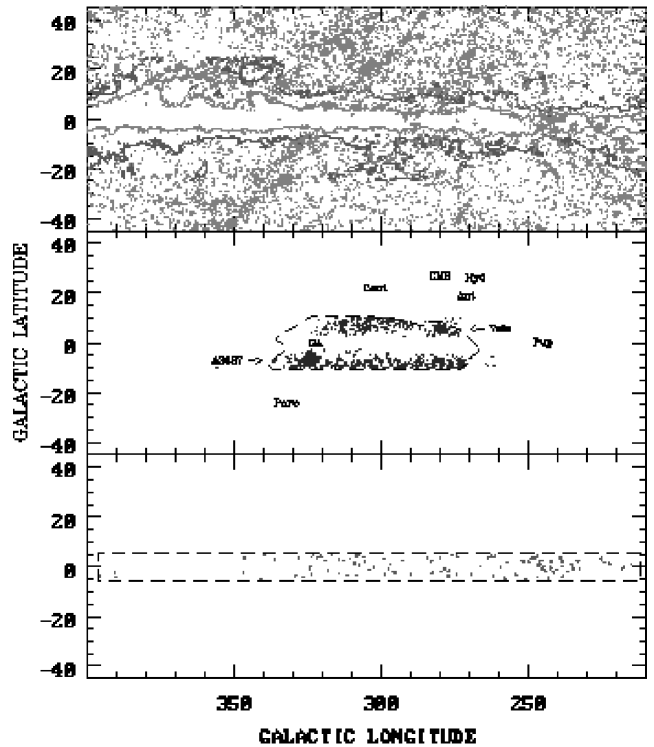
For comparative purposes, the top panel of Fig. 13 shows the distribution of all known galaxies with km s-1 (extracted from the Lyon-Meudon Extragalactic Database (LEDA). Although this constitutes an uncontrolled sample, it traces the main structures in the nearby Universe in a representative way. Note the increasing incompleteness for extinction levels of (outer contour) – reflecting the growing incompleteness of optical galaxy catalogs – and the near full lack of galaxy data for extinction levels (inner contour). The middle panel shows galaxies with 10000 km s-1 from the follow-up observations of the deep optical galaxy search by Kraan-Korteweg and collaborators (Sect. 2.4). Various new overdensities are apparent at low latitudes but the innermost part of our Galaxy remains obscured with this approach. Here, the blind H I data (lower panel) finally can provide the missing link for large-scale structure studies.
In Fig. 14, the data of Fig. 13 are combined in redshift slices. The achieved sensitivity of the shallow MB H I-survey fills in structures all the way across the ZOA for 3500 km s-1(upper panel) for the first time. Note the continuity of the thin filamentary sine-wave-like structure that dominates the whole southern sky and crosses the Galactic Equator twice. This structure snakes over through the southern sky. Taking a mean distance of Mpc, this implies a linear size of Mpc, with a thickness of ’only’ Mpc or less. Various other filaments spring forth from this dominant filament, always from a rich group or small cluster at the junction of these interleaving structures. This feature is very different from the thick, foamy Great Wall-like structure, the GA, in the middle panel.
Also note the prominence of the Local Void which is very well delineated in this presentation. No galaxies were found within the Local Void, but the three newly identified galaxies at help to define the boundary of the Void.
The full sensitivity ZOA MB-survey will fill in the large-scale structures in the more distant panels of Fig. 14. First results of the full sensitivity survey have been obtained in the Great Attractor region (Sect. 5.3).
Three nearby, very extended ( to ) galaxies were discovered with the shallow survey. Being likely candidates of dynamically important galaxies, immediate follow-up observations were initiated at the Australian Telscope Compact Array (ATCA). These objects did not turn out to be massive perturbing monsters, however. Two were seen to break up into H I complexes and both have unprecedented low H I column densities Sta98 . Systematic synthesis observations are being performed to investigate the frequency of these interacting and/or low H I column density systems in this purely H I-selected sample.
5.3 The Parkes ZOA MB Deep Survey and the Great Attractor
Four cubes centered on the Great Attractor region (, ) of the full-sensitivity survey have been analyzed Jur00 . 236 galaxies above the detection level of 25 mJy have been uncovered. 70% of the detections had no previous identification.
In the left panel of Fig. 15, a sky distribution centered on the GA region displays all galaxies with redshifts km s-1. Next to redshifts from the literature, redshifts from the follow-up observations of Kraan-Korteweg and collaborators in the Hy/Ant-Crux-GA ZOA surveys (dashed area) are plotted. They clearly reveal the prominence of the cluster A3627 at km s-1) close to the core of the GA region at = (320∘, 0∘, 4500 km s-1). Adding now the new detections from the systematic blind H I MB-ZOA survey (box), structures can be traced all the way across the Milky Way. The new picture seems to support that the GA overdensity is a “great-wall” like structure starting close to the Pavo cluster, having its core at the A3627 cluster and then bending over towards shorter longitudes across the ZOA.
This becomes even clearer in the right panel of Fig. 15 (compare with right hand panel of Fig. 5) where the galaxies are displayed in a redshift cone out to km s-1 for the longitude range . The combined surveys in the GA region clearly substantiate that A3627 is the most massive galaxy cluster uncovered in this region and therefore the most likely candidate for the predicted density-peak at the bottom of the potential well of the GA overdensity. The new data do not unambigously confirm the existence of the suspected further cluster around the bright elliptical radio galaxy PKS1343601 (Sect. 2.4). Although the MB data reveal an excess of galaxies at this position in velocity space ( km s-1) a “finger of God” is not seen. It could be that many central cluster galaxies are missed by the H I observations because spiral galaxies generally avoid the cores of clusters. The reality of this possible cluster still remains a mystery. This prospective cluster has meanwhile been imaged in the -band Wou00c , where extinction effects are less severe compared to the optical (see Sect. 4). A first glimpse of the images do reveal various early-type galaxies. The forthcoming analysis should then unambiguously settle the question whether another cluster forms part of the GA overdensity.
5.4 Conclusions
The systematic probing of the galaxy distribution in the most opaque parts of the ZOA with H I surveys have proven very powerful. For the first time large-scale structure could be mapped without hindrance across the Milky Way (Figs. 14 and 15). This is the only approach that easily uncovers the galaxy distribution in the ZOA, allows the confirmation of implied connections and uncovers new connections behind the Milky Way.
¿From the analysis of the Dwingeloo survey and the shallow Parkes MB ZOA survey, it can be maintained that no Andromeda or other H I-rich Circinus-like galaxy is lurking undetected behind the deepest extinction layers of the Milky Way (although gas-poor, early-type galaxies might, of course, still remain hidden). The census of dynamically important, H I-rich nearby galaxies whose gravitational influence could significantly impact peculiar motion of the Local Group or its internal dynamics is now complete – at least for objects whose signal is not drowned within the strong Galactic H I emission.
6 X-ray Surveys
The X-ray band potentially is an excellent window for studies of large-scale structure in the Zone of Avoidance, because the Milky Way is transparent to the hard X-ray emission above a few keV, and because rich clusters are strong X-ray emitters. Since the X-ray luminosity is roughly proportional to the cluster mass as or , depending on the still uncertain scaling law between the X-ray luminosity and temperature, massive clusters hidden by the Milky Way should be easily detectable through their X-ray emission.
This method is particularly attractive, because clusters are primarily composed of early-type galaxies which are not recovered by IRAS galaxy surveys (Sect. 3) or by systematic H I surveys (Sect. 5). Even in the NIR, the identification of early-type galaxies becomes difficult or impossible at the lowest Galactic latitudes because of the increasing extinction and crowding problems (Sect. 4). Rich clusters, however, play an important role in tracing large-scale structures because they generally are located at the center of superclusters and Great Wall-like structures. They mark the density peaks in the galaxy distribution and – with the very high mass-to-light ratios of clusters – the deepest potential wells within these structures. Their location within these overdensities will help us understand the observed velocity flow fields induced by these overdensities.
The X-ray all-sky surveys carried out by Uhuru, Ariel V, HEAO-1 (in the - keV band) and ROSAT (- keV) provide an optimal tool to search for clusters of galaxies at low Galactic latitude. However, confusion with Galactic sources such as X-ray binaries and Cataclysmic Variables may cause serious problems, especially in the earlier surveys Uhuru, Ariel V and HEAO-1 which had quite low angular resolution. And although dust extinction and stellar confusion are unimportant in the X-ray band, photoelectric absorption by the Galactic hydrogen atoms – the X-ray absorbing equivalent hydrogen column density – does limit detections close to the Galactic Plane. The latter effect is particularly severe for the softest X-ray emission, as e.g. observed by ROSAT (- keV) compared to the earlier - keV missions. On the other hand, the better resolution of the ROSAT All Sky Survey (RASS), compared to the HEAO-1 survey, will reduce confusion problems with Galactic sources as happened, for example, in the case of the cluster A3627 (see below).
Until recently, the possibility of searching for galaxy clusters behind the Milky Way through their X-ray emission has not been pursued in a systematic way, even though a large number of X-ray bright clusters are located at low Galactic latitudes Fab94 : for instance, four of the seven most X-ray luminous clusters in the 2-10 keV range, the Perseus, Ophiuchus, Triangulum Australis, and PKS0745191 clusters ( erg s-1) lie at latitudes below Edg90 .
A first attempt to identify galaxy clusters in the ZOA through their X-ray emission had been made by Jahoda and Mushotzky in 1989 Jah89 . They used the HEAO-1 all-sky data to search for X-ray-emission of a concentration of clusters or one enormous cluster that might help explain the shortly before discovered large-scale deviations from the Hubble flow that were associated with the Great Attractor. Unfortunately, this search missed the 6th brightest cluster A3627 in the ROSAT X-ray All Sky Survey Boh96 ; Tam98 which had been identified as the most likely candidate for the predicted but unidentified core of the Great Attractor. A3627 was not seen in the HEAO-1 data because of the low angular resolution and the confusion with the neighbouring X-ray bright, Galactic X-ray binary 1H1556-605 (cf. Fig. 8 and 9 in Boh96 ).
6.1 CIZA: Clusters In the Zone of Avoidance
Since 1997, a group led by Ebeling Ebe99a ; Ebe99b have systematically searched for bright X-ray clusters of galaxies at . Starting from the ROSAT Bright Source Catalog (BSC, Vog99 ) which lists the 18811 X-ray brightest sources detected in the RASS, they apply the following criteria to search for clusters: (a) , (b) a X-ray flux above erg cm-2 s-1 (the flux limit of completeness of the ROSAT BCS), and (c) a spectral hardness ratio. Ebeling et al.demonstrated in 1998 that the X-ray hardness ratio is very effective in discriminating against softer, non-cluster X-ray sources. With these criteria, they select a candidate cluster sample which, although at this point still highly contaminated by non-cluster sources, contains the final CIZA cluster sample.
They first cross-identified their 520 cluster candidates against NED and SIMBAD, and checked unknown ones on the Digitized Sky Survey. The new cluster candidates, including known Abell clusters without photometric and spectroscopic data, were imaged in the R band, respectively in the K’ band at high extinctions. With the subsequent spectroscopy of galaxies around the X-ray position, the real clusters could be confirmed.
Time and funding permitting, the CIZA team plans to extend their cluster survey to lower X-ray fluxes (- erg cm-2 s-1), the aim being a total sample of 200 X-ray selected clusters below .
6.2 Conclusions
With the discovery of so far 76 clusters of which only 20% were known before, Ebeling et al.Ebe99b have proven the strength of the method to use X-ray criteria to search for galaxy clusters in the ZOA. As mentioned in the introduction to this section, this approach is complementary to the other wavelengths searches which all fail to uncover galaxy clusters at very low Galactic latitudes.
Having used the ROSAT BSC to select their galaxy cluster candidates, the CIZA collaboration can combine their final cluster sample with other X-ray selected cluster samples from the RASS, such as the ROSAT Brightest Cluster Sample at and Ebe98 and the REFLEX sample at and (Böhringer et al.in prep.). The resulting, all-sky cluster list will be ideally suited to study large-scale structure and the connectivity of superclusters across the Galactic Plane.
7 Theoretical Reconstructions
Various mathematical methods exist to reconstruct the galaxy distribution in the ZOA without having access to direct observations.
One possibility is the expansion of galaxy distributions adjacent to the ZOA into spherical harmonics to recover the structures in the ZOA, either with 2-dimensional catalogs (sky positions) or 3-dimensional data sets (redshift catalogs).
A statistical method to reconstruct structures behind the Milky Way is the Wiener Filter (WF), developed explicitly for reconstructions of corrupt or incomplete data Lah94 ; Hof94 . Using the WF in combination with linear theory allows the determination of the real-space density of galaxies, as well as their velocity and potential fields.
The POTENT analysis developed by Ber89 can reconstruct the potential field (mass distribution) from peculiar velocity fields in the ZOA Kol95 . The reconstruction of the potential fields versus density fields have the advantage that they can locate hidden overdensities (their signature) even if “unseen”.
Because of the sparsity of data and the heavy smoothing applied in all these methods, only structures on large scales (superclusters) can be mapped. Individual (massive) nearby galaxies that can perturb the dynamics of the Universe quite locally (the vicinity of the Local Group or its barycenter) will not be uncovered in this manner. But even if theoretical methods can outline LSS accurately, the observational efforts do not become superfluous. The comparison of the real galaxy distribution (r), from e.g. complete redshift surveys, with the peculiar velocity field v(r) will lead to an estimate of the density and biasing parameter () through the equation
| (1) |
cf. Strauss & Willick Str95 for a detailed review.
7.1 Early Predictions
Early reconstructions on relatively sparse data galaxy catalogs have been performed within volumes out to 5000 km s-1. Despite heavy smoothing, they have been quite successful in pinpointing a number of important features:
Scharf et al.Sch92 applied spherical harmonics to the 2-dimensional IRAS PSC and noted a prominent cluster behind the ZOA in Puppis () which was simultaneously discovered as a nearby cluster through H I-observations of obscured galaxies in that region by Kraan-Korteweg & Huchtmeier Kra92 .
Hoffman Hof94 predicted the Vela supercluster at ( km s-1) using 3-dimensional WF reconstructions on the IRAS 1.9 Jy redshift catalog Str92 , which was observationally discovered just a bit earlier by Kraan-Korteweg & Woudt Kra93 .
Using POTENT analysis, Kolatt et al.Kol95 predicted the center of the Great Attractor overdensity – its density peak – to lie behind the ZOA at ( km s-1, see Fig. 17). Shortly thereafter, Kraan-Korteweg et al.Kra96 unveiled the cluster A3627 as being very rich and massive and at the correct distance. It hence is the most likely candidate for the central density peak of the GA.
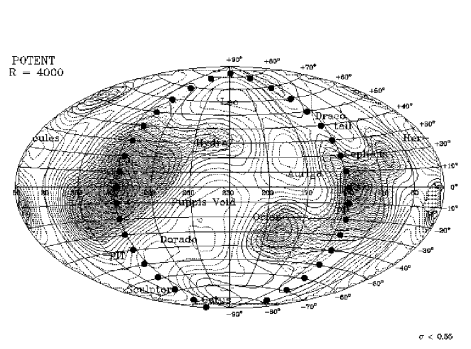
7.2 Deeper Reconstructions
Recent reconstructions have been applied to denser galaxy samples covering larger volumes ( km s-1) with smoothing scales of the order of 500 km s-1 (compared to 1200 km s-1in the earlier reconstructions). It therefore seemed of interest to see whether these reconstructions find evidence for unknown major galaxy structures at higher redshifts.
The currently most densely-sampled, well-defined galaxy redshift catalog is the Optical Redshift Survey San95 . However, this catalog is limited to and the reconstructions Bak98 within the ZOA are strongly influenced by 1.2 Jy IRAS Redshift Survey data and a mock galaxy distribution in the inner ZOA. I therefore concentrate on reconstructions based on the 1.2 Jy IRAS Redshift Survey only. In the following, the structures identified in the ZOA by (a) Webster et al.Web97 using WF plus spherical harmonics and linear theory and (b) Bistolas Bis98 who applied a WF plus linear theory and non-constrained realizations on the 1.2 Jy IRAS Redshift Survey are discussed and compared to observational data. Fig. 2 in Webster et al.displays the reconstructed density fields on shells of 2000, 4000, 6000 and 8000 km s-1; Fig. 5.2 in Bistolas displays the density fields in the ZOA from 1500 to 8000 km s-1 in steps of 500 km s-1.
The WLF reconstructions clearly find the recently by Roman et al.Rom98 identified nearby cluster at (, -, 1500 km s-1), whereas Bistolas reveals no clustering in the region of the Local Void out to 4000 km s-1. At the same longitudes, clustering is indicated at 7500 km s-1 by Bistolas, but not by Webster et al. The Perseus-Pisces chain is strong in both reconstructions, and the 2nd Perseus-Pisces arm – which folds back at – is clearly confirmed. Both reconstructions find the Perseus-Pisces complex to be very extended in space, i.e. from 3500 km s-1 out to 9000 km s-1. Whereas the GA region is more prominent compared to Perseus-Pisces in the Webster et al.reconstructions, the signal of the Perseus-Pisces complex is considerably stronger than the GA in Bistolas, where it does not even reveal a well-defined central density peak. Both reconstructions find no evidence for the suspected PKS1343 cluster but its signal could be hidden in the central (A3627) density peak due to the smoothing. While the Cygnus-Lyra complex (- km s-1) discovered by Takata et al.Tak96 stands out clearly in Bistolas, it is not evident in Webster et al.Both reconstructions find a strong signal for the Vela supercluster ( km s-1) identified by Kraan-Korteweg & Woudt Kra93 and Hoffman Hof94 . The Cen-Crux cluster identified by Woudt Wou98 is evident in Bistolas though less distinct in Webster et al. A suspected connection at ( km s-1) – cf. Fig. 2 in Kra98a – is supported by both methods. The Ophiuchus cluster Has00 just becomes visible in the most distant reconstruction shells (8000 km s-1).
7.3 Conclusions
Not all reconstructions find the same features, and when they do, the prominence of the density peaks as well as their locations in space do vary considerably. At velocities of km s-1 most of the dominant structures lie close to the ZOA while at larger distances, clusters and voids seem to be more homogeneously distributed over the whole sky. Out to 8000 km s-1, none of the reconstructions predict any major structures which are not mapped or suggested from observational data. So, no major surprises seem to remain hidden in the ZOA. The various multi-wavelength explorations of the Milky Way will soon be able to verify this. Still, the combination of both the reconstructed potential fields and the observationally mapped galaxy distribution will lead to estimates of the cosmological parameters and .
8 Conclusions
In the last decade, enormous progress has been made in unveiling the extragalactic sky behind the Milky Way. At optical wavebands, the entire ZOA has been systematically surveyed. It has been shown that these surveys are complete for galaxies larger than (corrected for absorption) down to extinction levels of . Combining these data with previous “whole-sky” maps results in a reduction of the “optical ZOA” of a factor of about 2-2.5 which allow an improved understanding of the velocity flow fields and the total gravitational attraction on the Local Group. Various previously unknown structures in the nearby Universe could be mapped in this way.
At higher extinction levels, other windows to the ZOA become more efficient in tracing the large-scale structures. Very promising in this respect are the current near-infrared surveys which find galaxies down to latitudes of and systematic H I surveys which detect gas-rich spiral galaxies all the way across the Galactic Plane – hampered slightly only at very low latitudes () because of the numerous continuum sources. The “Behind the Plane” Survey resulted in a reduction from 16% to 7% of the “FIR ZOA” and new indications of possible hidden massive clusters behind the Milky Way are now forthcoming from the CIZA project – although again an “X-ray ZOA” will remain due to the absorption of X-ray radiation by the thickening gas layer close to the Galactic Plane.
A difficult task is still awaiting us, i.e. to obtain a detailed understanding of the selection effects inherent to the various methods in order to merge the different data sets in a uniform, well-defined way. This is extremely important if we want to use this data for quantitative cosmography. Moreover, we need a better understanding of the obscurational effects on the observed properties of galaxies identified through the dust layer (at all wavelengths), in addition to an accurate high-resolution, well-calibrated map of the Galactic extinction.
Despite the fact that our knowledge of the above questions is as yet limited, a lot can and has been learned from ZOA research. This is evident, for instance, from the detailed and varied investigations of the Great Attractor region. Mapping the GA and understanding the from peculiar velocity fields inferred massive overdensity had remained an enigma due the fact that the major and central part of this extended density enhancement is largely hidden by the obscuring veil of the Milky Way. Does light trace mass in this region and where is the rich cluster which biasing predicts at the center of large-scale potential wells?
The results from the various ZOA surveys now clearly imply that the Great Attractor is, in fact, a nearby “great-wall” like supercluster, starting at the nearby Pavo cluster below the GP, moving across the massive galaxy cluster A3627 toward the shallow overdensity in Vela at 6000 km s-1. The cluster A3627 is the dominant central component of this structure, similar to the Coma cluster in the (northern) Great Wall. Whether a second massive cluster around PKS1343601 is part of the core of the GA remains uncertain.
Acknowledgement. The enthusiastic collaborations of my colleagues in the exploration of the galaxy distribution behind the Milky Way is greatly appreciated. These are P.A. Woudt, C. Salem and A.P. Fairall with deep optical searches, C. Balkowski, V. Cayatte, A.P. Fairall, P.A. Henning with the redshift follow-ups of the optically identified galaxies, A. Schröder and G.A. Mamon in the exploration of the DENIS images at low Galactic latitude, W.B. Burton, P.A. Henning, O. Lahav and A. Rivers in the northern ZOA HI-survey (DOGS) and the HIPASS ZOA team members L. Staveley-Smith , R.D. Ekers, A.J. Green, R.F. Haynes, P.A. Henning, S. Juraszek, M. J. Kesteven, B. Koribalski, R.M. Price, E. Sadler and A. Schröder in the southern ZOA survey.
Particular thanks go to P.A. Woudt for his careful reading of the manuscript and his valuable suggestions, to W. Saunders for preparing Fig. 9, to A. Schröder and G. Mamon for their comments on the NIR section, and to H. Ebeling for his input with regard to the X-ray section and Fig. 16.
This research has made use of the NASA/IPAC Extragalactic Database (NED) which is operated by the Jet Propulsion Laboratory, Caltech, under contract with the National Aeronautics and Space Administration, as well as the Lyon-Meudon Extragalactic Database (LEDA), supplied by the LEDA team at the Centre de Recherche Astronomique de Lyon, Observatoire de Lyon.
References
- (1) Proctor, R.: The Universe of Stars, (Longmans, Green and Co. London 1878) pp. 41
- (2) Herschel, J.: Philosophical Transactions (1864)
- (3) Charlier C.V.L.: Arkiv för Mat. Astron. Fys. 16, 1 (1922)
- (4) Dreyer J.L.E.: A New General Catalogue of Nebulae and Clusters of Stars, being the catalogue of the late Sir John F.W. Herschel, revised, corrected and enlarged Mem.R.A.S. XLIX, Part 1 (1888)
- (5) Dreyer J.L.E.: Index Catalogue of Nebulae found in the Years 1888 to 1894, with Notes and Corrections Mem.R.A.S. LI (1895)
- (6) Shapley, H.: in Galaxies, (Cambridge: Harvard University Press, 1961) pp. 159
- (7) Shane C.D., Wirtanen C.A.: Publ. Lick Obs. XXII, Pt. I (1967)
- (8) Nilson P.: Uppsala General Catalog of Galaxies, (Uppsala, University of Uppsala 1973)
- (9) Lauberts A.: The ESO/Uppsala Survey of the ESO (B) (Atlas, ESO, Garching 1982)
- (10) Vorontsov-Velyaminov B., Archipova V.: Morphological Catalog of Galaxies, Parts 2 to 5, (Moscow, Moscow University 1963-74)
- (11) Fouqué P., Paturel G.: A&A 150, 192 (1985)
- (12) Hudson M.J., Lynden-Bell D.: MNRAS 252, 219 (1991)
- (13) Schlegel D.J., Finkbeiner D.P., Davis M.: ApJ 500, 525 (1998)
- (14) Cardelli J.A., Clayton G.C., Mathis J.S: ApJ 345, 245 (1989)
- (15) Fairall A.P.: Large-Scale Structures in the Universe (Wiley Praxis Series in Astronomy and Astrophysics, Praxis Publishing, Chichester 1998)
- (16) Kogut A., Lineweaver C., Smoot G.F., Bennett C. L., Banday A., Boggess N.W., Cheng E.S., de Amici, G., Fixsen D.J., Hinshaw G., Jackson P. D., Janssen M., Keegstra P., Loewenstein K., Lubin P., Mather J.C., Tenorio L., Weiss R., Wilkinson D.T., Wright E.: ApJ 419, 1 (1993)
- (17) Sandage A., Tammann G.A.: in Large Scale Structures of the Universe, Cosmology and Fundamental Physics, ed. by G. Setti & L. van Hove, (Garching: ESO 1984) pp. 127
- (18) Shaya E.J.: ApJ 280, 470 (1984)
- (19) Kolatt T., Dekel A., Lahav O.: MNRAS 275, 797 (1995)
- (20) Peebles, P.J.E.: ApJ 429, 43 (1994)
- (21) Dressler A., Faber S.M., Burstein D., Davies, R.L., Lynden-Bell D., Terlevich R.J., Wegner G.: ApJ 313, 37 (1987)
- (22) Lynden-Bell D., Faber S.M., Burstein D., Davies R.L., Dressler A., Terlevich R.J., Wegner G.: ApJ 326, 19 (1988)
- (23) Böhm-Vitense E.: 1956, PASP 68, 430
- (24) Shane C.D., Wirtanen C.A.: AJ 59, 285 (1954)
- (25) Fitzgerald M.P.: A&A 31, 467 (1974)
- (26) Dodd R.J., Brand P.W.J.L.: A&AS 25, 519 (1976)
- (27) Kraan-Korteweg R.C., Huchtmeier W.K.: A&A 266, 150 (1992)
- (28) Lahav O., Yamada T., Scharf C.A., Kraan-Korteweg R.C.: MNRAS 262, 711 (1993)
- (29) Weinberger R., Elsässer H., Beetz M., Birkle K.: A&A 48, 327 (1976)
- (30) Huchra J., Hoessel J., Elias J.: AJ 82, 674 (1977)
- (31) Weinberger R., A&AS 40, 123 (1980)
- (32) Focardi P., Marano B., Vettolani G.: A&A 136, 178 (1984)
- (33) Hauschildt M.: A&A 184, 43 (1987)
- (34) Chamaraux P., Cayatte V., Balkowski C., Fontanelli P.: A&A 229, 340 (1990)
- (35) Drinkwater M.J., Barnes D.G., Ellison S.L.: PASA 12, 248 (1995)
- (36) Lewis G., Irwin M.: Spectrum, Newsletter of the Royal Observatories 12, 22 (1996)
- (37) Pantoja C.A., Altschuler D.R., Giovanardi C., Giovanelli R.: AJ 113, 905 (1997)
- (38) Seeberger R., Saurer W., Weinberger R., Lercher G.: in Unveiling Large-Scale Structures Behind the Milky Way, ed. by C. Balkowski, R.C. Kraan-Korteweg, ASP Conf. Ser. 67, 81 (1994)
- (39) Seeberger R., Saurer W., Weinberger R.: A&AS 117, 1 (1996)
- (40) Seeberger R., Saurer W.: A&AS 127, 101 (1998)
- (41) Lercher G., Kerber F., Weinberger R.: A&AS 117, 369 (1996)
- (42) Saurer W., Seeberger R., Weinberger R.: A&AS 126, 247 (1997)
- (43) Marchiotto W., Wildauer H., Weinberger R.: (1999) in progress
- (44) Weinberger R., Gajdosik M., Zanin C.: A&AS 137, 293 (1999)
- (45) Saito M., Ohtani A., Asomuna A., Kashikawa N., Maki T., Nishida S., Watanabe T.: PASJ 42, 603 (1990)
- (46) Saito M., Ohtani A., Baba A., Hotta N., Kameno S., Kurosu S., Nakada K., Takata T.: PASJ 43, 449 (1991)
- (47) Roman A.T., Takeuchi T.T., Nakanishi K., Saito M.: PASJ 50, 47 (1998)
- (48) Roman A.T., Nakanishi K., Tomita A., Saito M.: PASJ 48, 679 (1996)
- (49) Salem C., Kraan-Korteweg R.C.: in prep.,
- (50) Kraan-Korteweg R.C.: A&ASS 141, 123 (2000)
- (51) Woudt P.A.: Ph.D. thesis, Univ. of Cape (Town 1998)
- (52) Woudt P.A., Kraan-Korteweg R.C.: A&AS (2000), in prep.
- (53) Woudt P.A., Kraan-Korteweg R.C.: A&AS (2000), in prep.
- (54) Fairall A.P., Kraan-Korteweg R.C.: in Mapping the Hidden Universe, ed. by R.C. Kraan-Korteweg, P.A. Henning & H. Andernach, ASP Conf. Ser. (2000) in press
- (55) Wakamatsu K., Hasegawa T., Karoji H., Sekiguchi K., Menzies J.W., Malkan M.: in Unveiling Large-Scale Structures Behind the Milky Way, ed. by C. Balkowski, R.C. Kraan-Korteweg, ASP Conf. Ser. 67, 131 (1994)
- (56) Hasegawa T., Wakamatsu K., Malkan M., Sekiguchi K., Menzies J.W., Parker Q.A., Jugaku J., Karoji H., Okamura S.: MNRAS (2000), in press
- (57) Hau G.K.T., Ferguson H.C., Lahav O., Lynden-Bell D.: MNRAS 277, 125 (1995)
- (58) Abell G.O., Corwin H.G., Olowin R.P.: ApJS 70, 1 (1989)
- (59) Cameron L.M.: A&A 233, 16 (1990)
- (60) Chamaraux P., Masnou J.-L., Kazés I., Saito M., Takata T., Yamada T.: MNRAS 307, 263 (1999)
- (61) Kraan-Korteweg R.C., Woudt P.A.: PASA 16, 53 (1999)
- (62) Kraan-Korteweg R.C., Cayatte V., Fairall A.P., Balkowksi C., Fairall A.P., Henning P.A.: x in Unveiling Large-Scale Structures behind the Milky Way, ed. by C. Balkowski and R.C. Kraan-Korteweg, ASP Conf. Ser. 67 (1999) pp. 99
- (63) Felenbok P., Guérin J., Fernandez A., Cayatte V., Balkowski C., Kraan-Korteweg R.C.: Experimental Astronomy 7, 65 (1997)
- (64) Kraan-Korteweg R.C., Fairall A.P., Balkowski C.: A&A 297, 617 (1995)
- (65) Fairall A.P., Woudt P.A., Kraan-Korteweg R.C.: A&AS 127, 463 (1998)
- (66) Woudt P.A., Kraan-Korteweg R.C., Fairall A.P.: A&A 352, 39 (1999)
- (67) Kraan-Korteweg R.C., Woudt P.A., Henning P.A.: PASA 14, 15 (1997)
- (68) Sarazin C.L.: Rev. Mod. Phys. 58, 1 (1986)
- (69) King I.: AJ 67, 471 (1962)
- (70) Hughes J.P.: AJ 337, 21 (1990)
- (71) White S.D.M., Briel U.G., Henry J.P.: MNRAS 261, L8 (1993)
- (72) Wolf M.: Heidelberg Publ. 1, 125 (1906)
- (73) Böhringer H., Neumann D.M., Schindler S., Kraan-Korteweg R.C.: ApJ 467, 168 (1996)
- (74) Lynden-Bell D.: in Observational Tests of Cosmological Inflation, ed. by Shanks, T. et al.(1991) pp. 337
- (75) West R.M., Tarenghi M.: A&A 223, 61 (1989)
- (76) Joint IRAS Science Working Group: IRAS Point Source Catalog Version 2 (Washington: US Govt. Printing Office 1988) (IRAS PSC)
- (77) Yamada T., Takata T., Djamaluddin T., Tomita A., Kentaro T., Saito M.: ApJS 89, 57 (1993)
- (78) Lu N.Y., Dow M.W., Houck J.R., Salpeter E.E., Lewis B.M.: ApJ 357, 388 (1990)
- (79) Takata T., Yamada T., Saito M.: ApJ 457, 693 (1996)
- (80) Strauss M.A., Huchra J.P., Davis M., Yahil A., Fisher K.B., Tonry J.: ApJS 82, 29 (1992)
- (81) Fisher K.B., Huchra J., Davis M., Strauss M.A., Yahil A., Schlegel D.: ApJS 100, 69 (1995)
- (82) Saunders W., Sutherland W.J., Maddox S.J., Keeble O., Oliver S.J., Rowan-Robinson M., Efstathiou G.P., Tadros H., White S.D.M., Frenk C.S., Carramiñana A., Hawkins M.R.S.: MNRAS (2000) in press (astro-ph/0001117)
- (83) Saunders W., D’Mellow K.J., Tully R.B., Mobasher B., Maddox S.J., Sutherland W.J., Carrasco B.E., Hau G., Clements D.L., Staveley-Smith L.: in Towards an Understanding of Cosmic Flows of Large-Scale Structure, ed. by Courteau S., Strauss M., Willick J., ASP Conf. Ser. (2000) in press (astro-ph/9909174)
- (84) Kraan-Korteweg R.C., Woudt P.A., Cayatte V., Fairall A.P., Balkowski C., Henning P.A.: Nature 379 519 (1996)
- (85) Woudt P.A., Kraan-Korteweg R.C., Fairall A.P.: in Towards an Understanding of Cosmic Flows of Large-Scale Structure, ed. by Courteau S., Strauss M., Willick J., ASP Conf. Ser. (2000) in press (astro-ph/9909094)
- (86) Epchtein N.: in The Impact of Large Scale Near-Infrared Surveys. ed. by. F. Garzón et al.(Kluwer, Dordrecht 1997) pp. 15
- (87) Epchtein N.: in The Impact of Near-Infrared Sky Surveys on Galactic and Extragalactic Astronomy ed. by N. Epchtein (Kluwer, Dordrecht 1998) pp. 3
- (88) Skrutskie M.F., Schneider S.E., Stiening R., Strom S.E., Weinberg M.D., Beichmann C., Chester T., Cutri R., Lonsdale C., Elias J., Elston R., Capps R., Carpentie J., Juchra J., Liebert J., Monet D., Price S., Seitzer P.: in The Impact of Large Scale Near-Infrared Surveys, ed. by F. Garzón et al., (Kluwer, Dordrecht 1997) pp. 25
- (89) Skrutskie M.F.: in The Impact of Near-Infrared Sky Surveys on Galactic and Extragalactic Astronomy, ed. by N. Epchtein, (Kluwer, Dordrecht 1998) pp. 11
- (90) Mamon G.A.: in Wide Field Surveys in Cosmology, eds. Y. Mellier & S. Colombi, (Editions Frontières: Gif-sur-Yvette 1998) pp. 323
- (91) Gardner J.P., Sharples R.M., Carrasco B.E., Frenk C.S.: MNRAS 282, L1 (1996)
- (92) Schröder A., Kraan-Korteweg R.C., Mamon G.A. Ruphy S.: in Extragalactic Astronomy in the Infrared, ed. by G. A. Mamon et al.(Editions Frontières: Gif-sur-Yvette 1997) pp. 381
- (93) Schröder A., Kraan-Korteweg R.C., Mamon G.A.: PASA 16, 42 (1999)
- (94) Kraan-Korteweg R.C., Schröder A., Mamon G., Ruphy S.: in The Impact of Near-Infrared Surveys on Galactic and Extragalactic Astronomy, ed. by N. Epchtein (Kluwer, Dordrecht 1998) pp. 205
- (95) Mamon G.A.: in Unveiling Large-Scale Structures Behind the Milky Way, ed. by C. Balkowski, R.C. Kraan-Korteweg, ASP Conf. Ser. 67, 53 (1994)
- (96) Hurt R.L., Jarrett T., Cutri R., Skrutskie M., Schneider S., van Driel W.: BAAS 194, 832 (1999)
- (97) Tully R.B., Fisher J.R.: A&A 54, 661 (1977)
- (98) Kerr F.J., Henning P.A.: ApJ 320, L99 (1987)
- (99) Kraan-Korteweg R.C., Loan A.J., Burton W.B., Lahav O., Ferguson, H.C., Henning P.A., Lynden-Bell D.: Nature 372, 77 (1994)
- (100) Henning P.A., Kraan-Korteweg R.C., Rivers A.J., Loan, A.J., Lahav O., Burton W.B.: AJ 115, 584 (1998)
- (101) Rivers A.J., Henning P.A., Kraan-Korteweg R.C.: PASA 16, 48 (1999)
- (102) Kraan-Korteweg R.C., Koribalski B., Juraszek S.: in Looking Deep in the Southern Sky, ed. by R. Morganti, W. Couch (Springer 1998) pp. 23
- (103) Staveley-Smith L., Juraszek S., Koribalski B.S. Ekers, R.D., Green, A.J., Haynes, R.F., Henning, P.A., Kesteven, M.J., Kraan-Korteweg, R.C., Price, R.M., Sadler, E.M.: AJ 116, 2717 (1998)
- (104) Henning P.A., Staveley-Smith L., Kraan-Korteweg R.C., Sadler E.M.: PASA 16, 35 (1999)
- (105) Henning P.A., Staveley-Smith L., Ekers R.D., Green A.J., Haynes R.F., Juraszek S., Kesteven M.J., Koribalski B., Kraan-Korteweg R.C., Price R.M. Sadler E.M., Schröder A.: Astron. J. (2000), in press
- (106) Loan A.J., Maddox S.J., Lahav O., Balcells M., Kraan-Korteweg R.C., Assendorp R., Almoznino E., Brosch N., Goldberg E., Ofek E.O.: MNRAS 280, 537 (1996)
- (107) Buta R.J., McCall M.L.: ApJS 124, 33 (1999)
- (108) Burton W.B., Verheijen M.A.W., Kraan-Korteweg R.C., Henning P.A.: A&A 309, 687 (1996)
- (109) Kuno N., Vila-Vilaro B., Nishiyama K.: PASJ 48, 19 (1996)
- (110) Li J.G., Zhao J.H., Ho P.T.P., Sage L.J.: A&A 307, 424 (1996)
- (111) Tilanus R.P.J., Burton W.B.: A&A 324, 899 (1997)
- (112) Reynolds C.S., Loan A.J., Fabian A.C., Makishima K., Brandt W.N., Mizuno T.: MNRAS 286, 349 (1997)
- (113) Zwaan M., Briggs F., Sprayberry D.: PASA 14, 126 (1997)
- (114) Wakker B.P.: Ph.D. thesis, Univ. of Groningen (1990)
- (115) Burton W.B., Braun R., Walterbos R.A.M., Hoopes C.G.: AJ 117, 194 (1999)
- (116) Hartmann D.: Ph.D. thesis, Univ. of Leiden (1994)
- (117) Hartmann D., Burton W.B.: Atlas of Galactic Neutral Hydrogen (Cambridge University Press 1997)
- (118) Tammann G.A., Kraan-Korteweg R.C.: in The Large Scale Structure of the Universe; IAU Symp. 79, ed. by M.S. Longair and J. Einasto, (Reidel: Dordrecht 1978), pp. 71
- (119) Kraan-Korteweg R.C.: AN 300, 181 (1979)
- (120) Staveley-Smith, L., Wilson, W.E., Bird, T.S., Disney, M.J., Ekers, R.D., Freeman, K.C., Haynes, R.F., Sinclair, M.W., Vaile, R.A., Webster, R.L., Wright, A.E.: PASA 13, 243 (1996)
- (121) Juraszek S.: PASA 16, 38 (1999)
- (122) Juraszek S., Staveley-Smith L., Kraan-Korteweg R.C., Green A.J., Ekers R.D., Henning P.A., Kesteven M.J., Koribalksi B., Sadler E.M., Schröder A.C.: AJ (2000), in press
- (123) Woudt P.A., Kraan-Korteweg R.C.: in progress.
- (124) Fabian A.C.: in Unveiling Large-Scale Structures behind the Milky Way. ed. by C. Balkowski and R.C. Kraan-Korteweg, ASP Conf. Ser. 67, 76 (1994)
- (125) Edge A.C., Stewart G.C., Fabian A.C., Arnaud, K.A.: MNRAS 245, 559 (1990)
- (126) Jahoda K., Mushotzky R.F.: ApJ 346, 638 (1989)
- (127) Tamura T., Fukazawa Y., Kaneda H., Makishima K., Tashiro M., Tanaka Y., Böhringer H.: PASJ 50, 195 (1998)
- (128) Ebeling H., Mullis C.R., Tully B.R.: BAAS 31 (HEAD meeting), 699 (1999)
- (129) Ebeling H., Mullis C.R., Tully B.R.: (1999) submitted to ApJ
- (130) Voges W., Aschenbach B., Boller T., Bäuninger H., Briel U., Burkert W., Dennerl K., Englhauser J., Gruber R., Haberl F., Hartner G., Hasinger G., Kürster M., Pfeffermann E., Pietsch W., Predehl P., Rosso, C., Schmitt J.H.M.M., Trümper J., Zimmermann H.-U.: A&A 349, 389 (1999)
- (131) Ebeling H., Edge A.C., Böhringer H., Allen S.W., Crawford C.S., Fabian A.C., Voges W., Huchra J.P.: MNRAS 301, 881 (1998)
- (132) Lahav O.: in Unveiling Large-Scale Structures behind the Milky Way, ed. by C. Balkowski and R.C. Kraan-Korteweg, ASP Conf. Ser. 67, 171 (1994)
- (133) Hoffman Y.: in Unveiling Large-Scale Structures behind the Milky Way, ed. by C. Balkowski and R.C. Kraan-Korteweg, ASP Conf. Ser.67, 185 (1994)
- (134) Bertschinger E., Dekel A.: ApJ 336, 5 (1989)
- (135) Strauss M.A., Willick J.A.: Phys. Rep. 26, 27 (1995)
- (136) Scharf C., Hoffman Y., Lahav O., Lynden-Bell D.: MNRAS 256, 229 (1992)
- (137) Kraan-Korteweg R.C., Woudt P.A.: in Cosmic Velocity Fields, ed. by F. Bouchet and M. Lachièze-Rey, (Editions Frontières: Gif-sur-Yvette 1993) pp. 557
- (138) Santiago B.X., Strauss M.A., Lahav O., Davis M., Dressler A., Huchra J.: ApJ 446, 457 (1995)
- (139) Baker J.E., Davis M., Strauss M.A., Lahav O., Santiago B.X.: ApJ 508, 6 (1998)
- (140) Webster M., Lahav O., Fisher K.: MNRAS 287, 425 (1997)
- (141) Bistolas V.: Ph.D. thesis, Hebrew University, Jerusalem (1998)