STUDY OF THE DEPLETION EFFECT IN THE CLUSTER MS1008-1224
We present a detailed study of the depletion effect (the radial manifestation of the magnification bias) in the cluster MS1008-1224. Following our results concerning the simulations of depletion curves (see Mayen and Soucail, 2000 for a complete description of the code), we propose to constrain the mass profile of the cluster and the main characteristics of its potential (orientation and ellipticity). This application is based solely on deep photometry of the field and does not require the measurement of the shape parameters of the faint background galaxies.
1 Introduction
When the logarithmic slope of the galaxy counts is lower than 0.4 (this is the case in all filters at large magnitude), the magnification bias due to a gravitational lens makes the number density of objects decrease, and consequently, the radial distribution shows a typical depletion curve. This effect results from the competition between the gravitational magnification that increases the detection of individual objects and the deviation of light beam that spatially magnifies the observed area and thus decreases the apparent number density of sources. Since a few years, several tentative analysis have been proposed to determine cluster mass distribution (Broadhurst et al., 1995 ; Taylor et al., 1998 ), the redshift distribution of sources and to bring constraints on cosmological parameters (Fort et al., 1997 ).
Here, we propose to use depletion curves in order to constrain the mass profile of MS1008-1224 and some characteristics of its potential (orientation and ellipticity) by combining results of simulations of depletion curves obtained with different lens models (Mayen and Soucail, 2000 ) and high quality multicolor images of MS1008-1224 obtained with FORS and ISAAC during the science verification phase of the VLT-ANTU (UT1) at Cerro Paranal. It is a very rich galaxy cluster, located at (Lewis et al., 1999 ), slightly extended in X-rays, with a galaxy distribution quite circular, surrounding a North-South elongated core. There is a second clump of galaxies to the North. Some gravitationally lensed arcs to the North and the East of the field have been reported by Le Fèvre et al., 1994 as well as by Athreya et al., 2000 who also detected a high redshift cluster lensed by MS1008-1224 in the South-West part of the field using photometric redshifts.
In practice, we used only the FORS data which extend to a larger distance and are more suited for our study. Background sources were selected by removing the elliptical galaxies sequence in a color-magnitude diagram (), essentially valid at relatively bright magnitudes. This statistical correction is not fully reliable as it does not eliminate bluer cluster members or foreground sources.
Our counts may also present an overdensity of objects in the inner part of the cluster () due to the non-correction of the surface of cluster elliptical galaxies we have removed. This effect is more sensitive in the inner part of the cluster where these galaxies are dominant. But as it is not in the most interesting region of the depletion area, we did not try to improve the measures there.
In addition, due to the presence of two 11 magnitude stars in the northern part of the FORS field, two occulting masks were put to avoid excessive bleeding and scattered light. We took into account this partial occultation of the observed surface for the radial counts above a distance of 130”. This may possibly induce some additional errors in the last two points of the curves, which are probably underestimated, because of the difficulty to estimate the surface of the masks and some edge effects at the limit of the field.
2 Depletion curves and mass density profile
The first step would be to locate the cluster center. Its position is rather difficult to estimate directly from the distribution of the number density of background sources, although in principle one should be able to identify it as the barycenter of the points with the lower density around the cluster. We did not attempt to fit it and preferred to fix it 15” North of the cD, following both the X-ray center position (Lewis et al., 1999 ) or the weak lensing center (Athreya et al., 2000) .
The radial counts were performed in a range of 3 magnitudes up to the completeness magnitude in the B, V, R and I bands and up to a radial distance of 210” from the center, which covers the entire FORS field. The depletion was clearly detected in the four bands (see Mayen and Soucail, 2000 and Figure 1). The count step was fixed to 30 pixels (6”) in the innermost 80” and for the rest of the field we adopted a count step of 60 pixels (12”) in order to reduce the statistical error bars. These values are a good balance between statistical errors in each bin which increase for small steps and a reasonable spatial resolution in the radial curve, limited by the bin size.
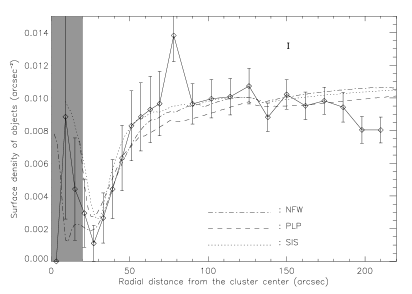
We fitted the observed depletion curve in the I band with three mass models (Figure 1), namely a singular isothermal sphere (SIS), a power-law density and a Navarro, Frenk & White (NFW) profiles. For each model, a minimization was introduced to derive the best fit and their related parameters (Table 1). The absolute normalization of the mass profiles results from the count model in empty field we have used (which fix the redshift distribution of the background sources before magnification by the gravitational lens). The curve was fitted after removing some clear deviant points : the last two points probably poorly corrected from edge effects, and those associated to the overdensity seen at . This bump is easily identifiable in the V, R and I curves, and can be partly explained by the presence of a background cluster lensed by MS1008-1224 and identified by Athreya et al., 2000 . Nevertheless, even if we remove from our data all the lower right quadrant of the field where this structure is located, the bump is still there although significantly reduced. This suggests that it may be more extended behind the cluster center than initially suspected.
-
The velocity dispersion derived from the SIS model ( km s-1) is in good agreement with the value measured by Carlberg et al., 1996 ( km s-1) but is more discordant with the value of 900 km s-1 inferred from the shear analysis of Athreya et al., 2000 .
-
The slope of the potential fit with a power-law density profile is close to an isothermal one (), although slightly shallower.
-
For a NFW profile, we find a virial radius ( Mpc) and a concentration parameter () quite in good agreement with those of Athreya et al., 2000 derived from weak lensing measures.
-
The comparison between the 3 fits favors a NFW profile as the best fit of our depletion curve (Table 1), also in agreement with the shear results for this cluster.
It is important to note that the mass profiles inferred from the depletion analysis are in good agreement with the shear masses (Figure 2). Thus, the masses found by using two independent lensing mass estimates are consistent whatever the radial distance from the cluster center. The discrepancy with X-ray mass still remains, although it is slightly reduced at large distance from the center. This encouraging result allows to consider the use of the depletion as a secure alternative solution against the other lensing mass estimates when the quality of the data is not sufficient to allow the use of the usual ones.
The study of the shape of the depletion area, which can be easily related to the ellipticity and the orientation of the mass distribution, has also allowed us to constrain these parameters with a good accuracy for MS1008-1224 (see Mayen and Soucail, 2000 ).
| Model | Parameter | reduced |
|---|---|---|
| SIS | km s-1 | 0.49 |
| PLP | MMpc3 | 0.62 |
| PLP | 0.65 | |
| NFW | Mpc | 0.44 |
| NFW | 0.45 |

3 Conclusion and outlook
The study of the depletion effect in the cluster MS1008-1224 with very deep and high quality VLT images has allowed us to constrain the mass profile up to a reasonable distance from the center and to constrain the ellipticity and the orientation of the mass distribution with a good accuracy. The results found are consistent with those inferred from other lensing techniques. Thus, the depletion reveals itself as a secure technique. The next step to explore is the influence of the clustering of background sources and the interest of wide field imaging : The normalization of the field number counts for the magnification bias can also be estimated outside the cluster, in exactly the same observing conditions (filter, magnitude limit, seeing, …), giving an absolute calibration of the depletion effect. A more prospective point which still requires to be studied in details is the reconstruction of two-dimensional mass maps of clusters from the depletion signal only.
Acknowledgments
We wish to thank the European TMR Programme Gravitational Lensing : New Constraints on Cosmology and The Distribution of Dark Matter for its financial support.
References
References
- [1] Athreya, R., Mellier, Y., Van Waerbeke, L., Fort, B., Pelló, R., Dantel-Fort, M., 2000, submitted to A&A, astro-ph/9909518
- [2] Broadhurst, T. J., Taylor, A. N., Peacock, J. A., 1995, ApJ, 438, 49
- [3] Carlberg, R. G., Yee, H. K. C., Ellingson, E., Abraham, R., Gravel, P., Morris, S., Pritchet, C. J., 1996, ApJ, 462, 32
- [4] Fort, B., Mellier, Y., Dantel-Fort, M., 1997, A&A, 321, 353
- [5] Le Fèvre, O., Hammer, F., Angonin, M. C., Gioia, I. M., Luppino, G. A., 1994, ApJ, 422, L5
- [6] Lewis, A. D., Ellingson, E., Morris, S. L., Carlberg, R. G., 1999, ApJ, 517, 587
- [7] Mayen, C., Soucail, G., 2000, submitted to A&A, astro-ph/0003332
- [8] Navarro, J. F., Frenk, C. S., White, S. D. M., 1996, ApJ, 462, 563
- [9] Taylor, A. N., Dye, S., Broadhurst, T. J., Benítez, N., Van Kampen, E., 1998, ApJ, 501, 539