petruk@astro.franko.lviv.ua
Thermal X-ray composites as an effect of projection
A new possibility to explain the nature of thermal X-ray composites (TXCs), i.e. a class of supernova remnants (SNRs) with a thermal X-ray centrally-filled morphology within a radio shell, as a projection effect of the 2- or 3-dimensional shell-like SNR evolved in a nonuniform medium with scale-height is proposed. Both X-ray and radio morphologies, as well as the basic theoretical features of this kind of SNR and the surrounding medium, are considered. Theoretical properties of a shell-like SNR evolved at the edge of a molecular cloud correspond to the observed properties of TXCs if the gradient of the ambient density does not lie in the projection plane and the magnetic field is nearly aligned with the line of sight. So, at least a part of objects from the class may be interpreted within the framework of the considered effect. The proposed model suggests that SNRs with barrel-like radio and centrally-brightened thermal X-ray morphologies should exist. The model allows us to consider TXCs as prospective sources of proton origin -rays.
Key Words.:
ISM: supernova remnants - X-rays: general - Radio continuum: general - Gamma rays: theory1 Introduction
Observations show that supernova remnants (SNRs) have anisotropic distributions of surface brightness (Seward Seward-catalog (1990); Whiteoak & Green MOST-catalog (1996)). There are four morphological classes of SNRs: shell-like, Crab-like (plerionic), composite and thermal X-ray composites (TXCs; or mixed-morphology, or centrally-influenced) (Jones et al. Workshop-97 (1998); Rho & Petre Rho-Petre-98 (1998), hereafter RP98). In the past few years interest in TXCs has risen (e.g., Jones et al. Workshop-97 (1998); Cox et al. W44 (1999); Shelton et al. W44-II (1999); Sun, Wang & Chen SunWangChen-99 (1999)). TXCs are SNRs with centrally concentrated thermal X-ray and limb brightened radio morphologies. Remnants W44, W28, 3C~400.2, Kes~27, 3C~391, CTB~1, MSH~11-61A and others represent a mixed-morphology class (RP98). Since the publication of RP98, a number of new SNRs have been discovered, others have been observed more precisely or even for the first time in X-rays. Thus, new candidates to the TXC class have appeared in the past two years.
Two physical models have been presented so far to explain TXC (see RP98 for review). One of them is an enhanced interior X-ray emission from the evaporated material of numerous swept-up clouds which increases density in the central region of SNR. This model is frequently used; sometimes its application is intrinsically inconsistent, e.g., as in MSH 11-61A where evaporation timescales exceed the age of SNR 50-100 times (Jones et al. Workshop-97 (1998)). In the second model, shock temperature is small due to essential cooling; very soft emission of the shell is absorbed by interstellar medium (ISM) and only the interior region remains visible. In this model, thermal conduction may level temperature profiles and increase the central density altering the interior structure (Cox et al. W44 (1999)).
Other possibilities are also noted in publications. They are: a) emission from ejecta, b) differential absorption (Long et al. (Long-et-al-91 (1991)) have concluded that the centrally-peaked X-ray morphology within a radio shell is unlikely the result of absorption alone because distributions of X-ray and radio emitting plasmas have to be different in this case) or c) explosion in a medium with centrally-concentrated density distribution , (such a medium does not give centrally-concentrated morphology (Long et al. Long-et-al-91 (1991)) because the Sedov (Sedov (1959)) solutions give a specific internal profile of the flow density for all (), other develop a cavity around the centre).
The mentioned models are used to obtain a centrally-filled morphology within the framework of one-dimensional (1-D) hydrodynamic approaches. When we proceed to 2-D or 3-D models, we note that a simple projection effect may cause the shell-like SNR to fall into another morphology class, namely, centrally-influenced (Hnatyk & Petruk Hn-Pet-99 (1999)). The main feature of such SNR is the thermal X-rays emitted from swept-up gas and peaked in the internal part of the projection. Therefore, getting beyond one dimension, we obtain a new possibility to explain the nature of TXC. Such a possibility is considered in this paper.
Hnatyk & Petruk (Hn-Pet-98 (1998)) have reproduced the X-ray morphology of IC 443 with the proposed projection model of TXC. Therefore, we restrict ourselves to theoretical consideration of the phenomenon.
SNRs are modelled with an approximate analytic method for hydrodynamic description of the adiabatic phase of an asymmetrical point explosion in an arbitrary large-scale nonuniform medium (Hnatyk & Petruk Hn-Pet-99 (1999)). Equilibrium thermal X-ray emission is calculated with the use of the Raymond & Smith (Raym-Smith77 (1977)) model. The model for radio emission of nonspherical SNR is based on Reynolds & Chevalier (Rey-Chev-81 (1981)) and Reynolds (Reyn-98 (1998)) and is described in Sect. 3.2.
2 Observed properties of thermal X-ray composites
RP98 prove that mixed-morphology SNRs create a separate morphology class since their properties distinguish these remnants from others. Having analysed X-ray data on a number of such SNRs, the authors found their two prominent morphological distinctions: a) the X-ray emission is thermal, the distribution of X-ray surface brightness is centrally-peaked or amorphous and fills the area within the radio shell and may reveal weak evidence of an X-ray shell, b) the emission arises primarily from the swept-up ISM material, not from the ejecta.
RP98 emphasize that, besides similar morphology, the sample of SNRs also has similar physical properties. Namely, a) the same or higher central density comparing with the edge, b) complex interior optical nebulosity, as in W28 and probably in 3C~400.2 (Long et al. Long-et-al-91 (1991)); c) higher emission measure ( is the electron number density, is the length inside SNR) in the central region, as e.g. in 3C~391 (Rho & Petre Rho-Petre-96 (1996)); d) X-ray surface brightness in the central region ( is the average radius of the projection), in general, exceeds the brightness near the edge () 2-5 times, e) temperature profiles are close to uniform. As to the latter property, it should be noted that the temperature may decrease towards the centre, as in 3C~391 (Rho & Petre Rho-Petre-96 (1996)); no strong evidence of increasing the temperature towards the centre has been found for all TXCs, but Cox et al. (W44 (1999)) note that spectral hardness in W44 is greater in the centre, so the temperature might be higher in this region. A possible variation of temperature may be within factor 2, as in the case of W44 (Rho, Petre & Schlegel Rho-et-al-94 (1994); Cox et al. W44 (1999)) or in W28 (Long et al. Long-et-al-91 (1991)).
7 objects from the list of 11 TXCs reveal observational evidence of an interaction with molecular clouds (RP98). Thus, ambient media in the regions of their localization are nonuniform and cause nonspherisity of SNRs. Observational evidence of cloud localization just on the line of sight for some of these SNRs also exists (e.g., Rho et al. Rho-et-al-94 (1994)).
3 Theoretical properties of ”projected composites”
The Sedov (Sedov (1959)) model does not give a centrally-concentrated morphology due to geometrical properties of self-similar solutions. The solutions are 1-D and give a specific internal profile of the flow gas density: most of the mass is concentrated near the shock front. These factors and cumulation of the emission along the line of sight cause a shell-like morphology. If we consider a more complicated nonuniform ISM, we get beyond one dimension and need to consider additional parameters responsible for nonuniformity of the medium and orientation of a 3-D object.
Projection effects may essentially change the morphology of SNRs (Hnatyk & Petruk Hn-Pet-99 (1999)). Densities over the surface of a nonspherical SNR may essentially differ in various regions. If the ambient density distribution provides a high density in one of the regions across the shell of SNR and is high enough to exceed the internal column density near the edge of the projection, we will see a centrally-filled projection of a really shell-like SNR. Such density distribution may be ensured e.g. by a molecular cloud located near the object.
What is a really shell-like 3-D SNR? We suggest that such a remnant has internal density profiles similar to those in the Sedov (Sedov (1959)) solutions. Thus, we separate a shell-like SNR (as an intrinsic property of a 3-D object) from its limb brightened projection (as a morphological property of the projection). Let us call shell-like SNRs with centrally-filled projections ”projected composites”.
3.1 Hydrodynamic models
For simplicity, let us consider the case of a 2-D SNR and the characteristics of SNR and the surrounding medium which could be possible on smoothed boundaries of molecular clouds. Thus, SNR evolves in the ambient medium with hydrogen number density distributed according to
| (1) |
where is the density of the intercloud medium, the second term represents the density distribution into the boundary region and the cloud, is the scale-hight, is the distance. Let us take the explosion site to be at point where . Other parameters are assumed to be , . The energy of the supernova explosion is . We consider three basic evolutionary cases of SNR models which cover practically the whole adiabatic phase (models -, Table 1111The denser part of the shell in model just enters the radiative phase since this part has and the transition temperature for the Sedov blast wave is (Blondin et al. Blondin-et-al-98 (1998)).) and then we vary parameter in intermediate model (models -, Table 1), in order to see how the gradient of the ambient density affects X-ray characteristics of objects.
| Parameter | Model | |||||
|---|---|---|---|---|---|---|
| 2.5 | 2.5 | 2.5 | 5 | 10 | 40 | |
| 1.0 | 6.8 | 17.7 | 6.8 | 6.8 | 6.8 | |
| 8 | 7 | 6.5 | 7 | 7 | 7 | |
| 9.5 | 94 | 280 | 98 | 95 | 94 | |
| 1.4 | 1.8 | 2.1 | 1.4 | 1.2 | 1.1 | |
| 1.9 | 2.8 | 3.1 | 1.9 | 1.5 | 1.1 | |
| 3.5 | 7.9 | 9.8 | 3.7 | 2.2 | 1.2 | |
| 9.5 | 45 | 84 | 11 | 3.9 | 1.4 | |
| 34.1 | 36.7 | 37.3 | 36.4 | 36.2 | 36.1 | |
| 0.98 | 3.2 | 3.1 | 3.9 | 4.1 | 4.2 | |
| 0.43 | 2.1 | 2.3 | 0.72 | -0.10 | -0.54 | |
| 1.6 | 1.8 | 3.6 | 1.3 | 1.2 | 1.3 | |
3.2 Emission models
Gas density and temperature distributions inside the volume of a nonspherical SNR are obtained with the method of Hnatyk & Petruk (Hn-Pet-99 (1999)).
The equilibrium thermal X-ray emissivities are taken from Raymond & Smith (Raym-Smith77 (1977)).
We make simple estimations of the radio morphology of SNR in a nonuniform medium as described below, on the basis of a model for synchrotron emission from SNRs developed by Reynolds (Reyn-98 (1998), hereafter R98) and Reynolds & Chevalier (Rey-Chev-81 (1981)).
The volume emissivity in the radio band at some frequency is
| (2) |
where is the normalization of electron distribution , is the tangential component of the magnetic field (perpendicular to the electron velocity or normal to the shock). Power index is constant downstream because electrons lose energy proportionally to their energy (Eq. (6)) and remain essentially confined to the fluid element in which they were produced. Power index is also constant over the surface of a nonspherical SNR because the shock is strong. Namely, in the first order Fermi acceleration mechanism, , where shock compression ratio does not depend on the ambient density distribution in the strong shock limit (Mach number ) and for .
The ambient field is assumed to be uniform (polarization observations support the assumption that the magnetic fields in molecular clouds may be ordered over large scales, e. g. Goodman et al. (Goodman-et-al-90 (1990)), Messinger et al. (Messinger-et-al-97 (1997)), Matthews & Wilson (Matthews-Wilson-2000 (2000)) and others). Component is not modified by the shock: (indices ”” and ”” refer to the values at the shock and to the surrounding medium, respectively). Component rises everywhere at the shock by the factor of . No further turbulent amplification of the magnetic field is assumed. Components and evolve differently behind the shock front (R98; Reynolds & Chevalier Rey-Chev-81 (1981)). Since the magnetic field is flux-frozen, , the tangential component in each 1-D sector of the remnant is
| (3) |
where is the Lagrangian coordinate. Radial component
| (4) |
due to the magnetic flux conservation, .
In each fluid element, energy density of relativistic particles is proportional to the energy density of the magnetic field
| (5) |
which yields for and for . We are to expect the variation of and over the surface of a nonspherical SNR and downstream. However, the maximum energy, to which particles can be accelerated, only varies few times during the whole adiabatic phase (R98). The ISM nonuniformity does not affect the evolution of SNR at the previous free expansion stage. Thus, we assume that possible variations of the minimum and maximum electron energies over the remnant’s surface are likely to be minute and, in the first approach, we may neglect the surface variation of and caused by a nonuniform medium222Since (Reynolds & Chevalier Rey-Chev-81 (1981)) and shock velocity in a nonuniform medium (Hnatyk Hn88 (1988)), the variation of energy density over the surface lies within factors to for models -..
Each individual electron loses its energy due to the adiabatic expansion:
| (6) |
where (R98) and, therefore, downstream. Thus,
| (7) |
Radio morphology depends on aspect angle between the line of sight and the ambient magnetic field (R98), also on inclination angle between the density gradient and the plane of the sky and, in a complex 3-D case, on the third angle between the density gradient and the magnetic field.
3.3 Results
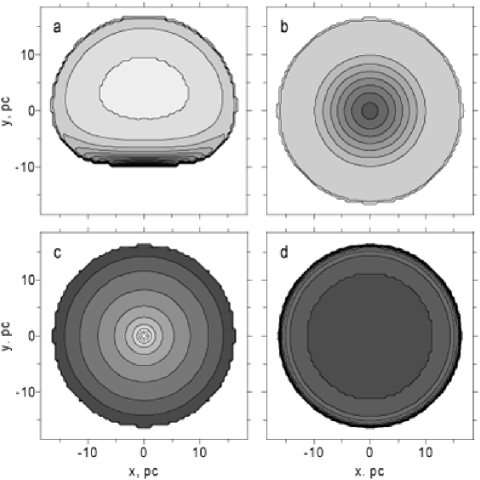
Fig. 1a-b demonstrates the influence of the projection on a thermal X-ray morphology of SNR. The X-ray brightness maximum located near the shock front in the shell-like projection () moves towards the centre of the projection with the increase of from to . For clarity we only consider here the most emphatic limit case . Radio images (Fig. 1c-d) show that the radio limb-brightened morphology clearly appears at , i. e. if both the density gradient and the magnetic field are nearly aligned.
Variation of the magnetic field orientation changes the radio morphology from shell-like to barrel-like (Kesteven & Caswell Kest-Casw-87 (1987), Gaensler Gaensler-98 (1998)). Contrast in the radio surface brightness decreases with increasing , from () to 1.8 (). Such behaviour of the radio morphology may be used for testing orientation of the magnetic field.
Thus, we found that the morphological properties of the projected composites match the basic features of the TXC class: centrally-peaked distribution of the thermal X-ray surface brightness is within the area of the radio shell; emission arises from the swept-up ISM material.
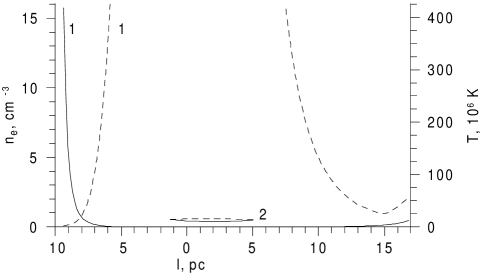
Let us consider physical properties of TXCs. a) The column number density increases from the edge towards the centre of the projection (e.g., for model from to ). b) The diffuse optical nebulosity over the internal region of the projection may naturally take place in such a model. c) Emission measure ( is the electron number density, is the length within SNR) is the highest in the X-ray peak because both and are maximum there (Fig. 2).
As Fig. 3 demonstrates, the distribution of X-ray surface brightness has strong maximum around the centre and a weaker shell with second maximum just behind the forward shock. It is essential that such a morphology takes place in different X-ray bands (lines b, 1, 2). The contrasts in X-ray surface brightness depend on the photon energy band and may lie within a wide range: in our models from 3 to 200 for (Table 1). The ratios of X-ray luminosity of central region to the luminosity beyond are 0.16, 5.2 and 16 in models , and , respectively. Thus, observational property d of TXCs takes place just at the adiabatic stage.
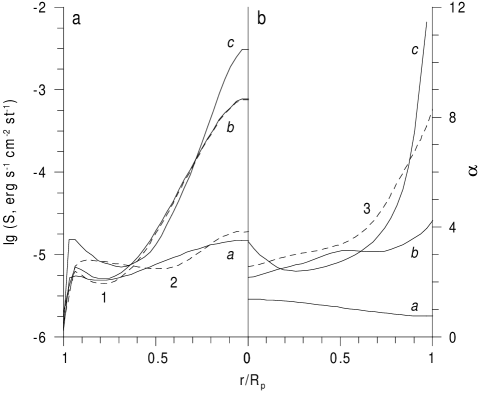
Surface distribution of spectral index , of the thermal X-ray emission where is the continuum emissivity and is the photon energy, gives us profiles of effective temperature of the column of emitting gas (, if the Gaunt factor is assumed to be constant). Fig. 3 shows that the temperature may either increase or decrease towards the centre. Decreasing takes place early in the adiabatic phase. Variation of the spectral index lies within factors to at the adiabatic stage (Table 1); the contrast in the spectral index distribution increases with age. Such values correspond to the possible range of temperature variation over the projection of thermal X-ray composites.
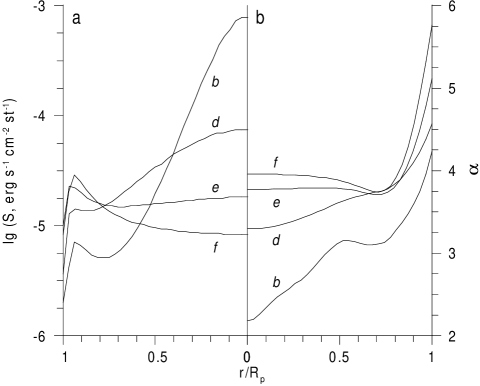
In order to reveal the dependence of the distributions of and on the ISM density gradient, a number of models with different were calculated (Fig. 4 and Table 1). The surface brightness distribution has a stronger peak for a stronger gradient. With increasing , the outer shell becomes more prominent in the projection. Only a scale-height of order can cause projected composites. A less strong gradient of the ambient density makes effective temperature more uniformly distributed in the internal part of the projection.
4 Discussion
4.1 Projection model versus other models
Distinctions of the previous physical models for TXC from the projection model are noted below. 1) The model with strong cooling can be used within the frame of the radiative model of SNR; the presented model describes TXCs as SNRs in the adiabatic phase of their evolution. 2) In comparison with the projection model, the spectrum of the central region in the model with thermal conduction is softer due to reducing the temperature (Jones et al. Workshop-97 (1998)). 3) The models with thermal conduction or evaporation increase the density in the internal part of SNR. The projection model does not require such modification of internal density distribution; the density profiles in this model are similar to those in the Sedov (Sedov (1959)) solution. 4) A small-scale inhomogeneous ISM is required for the model with evaporation. Projected composites are a consequence of large-scale nonuniformity of the ISM with the scale-height of order . 5) Other possibilities of creating a centrally-filled morphology, such as differential absorption or emission from ejecta, specifically modify the spectra of the object.
4.2 Magnetic field and density gradient orientations in molecular clouds
The projection model of TXCs assumes that an SNR evolves in a nonuniform medium with a different nature of nonuniformity and does not require the presence of a molecular cloud near SNR. However, since TXCs are mainly located near such clouds, we have considered here evolution of SNR at the edge of a cloud, as the most probable case. Magnetic field and ISM density gradient orientations are critical parameters for the proposed model. Therefore, let us find observations which reveal a close alignment between the density gradient and the magnetic field in molecular clouds. This might support the presented model since SNR is most clearly TXC under such an alignment.
The observational techniques used to measure the orientation and strength of the magnetic field in molecular clouds are reviewed by Troland (Troland-90 (1990)) and Crutcher (Crutcher-1994 (1994)). Zeeman effect observations give information about the strength of magnetic field component parallel to the line of sight (Crutcher et al. Crutcher-et-al-93 (1993)). To define the orientation of magnetic field component in the plane of the sky, polarization measurements of the radio, infrared and optical line emission are used. Polarization data maps reveal the clouds’ magnetic field morphology in the plane of the sky but do not enable us to find the amplitude of . Thus, we cannot obtain the actual three-dimensional orientation of the magnetic field from the observations because only one component of can be measured directly.
It is also difficult to find out the density gradient direction in a cloud, especially in low density regions () which we are interested in. Column density maps yield a projected 2-D structure of a 3-D cloud. Since the density distribution along the line of sight in a cloud generally remains unknown, we cannot draw conclusions about a three-dimensional direction of the density gradient. Another complication is a mostly filamentary stucture of clouds which prevents us from seeing a large-scale gradient of density.
For our purpose, it is reasonable to look for clouds with when polarization directions show a morphology of total field . There are 27 clouds with measurements of the Zeeman effect (Crutcher Crutcher-99 (1999)). Crutcher et al. (Crutcher-et-al-93 (1993)) have reported 10 sensitive observations without any detections of the Zeeman splitting. Since Zeeman observations are only sensitive to the authors assume that the magnetic fields in these clouds lie mostly in the plane of the sky. The cloud positions support this assumption, for looking at 9 of these clouds we are looking nearly perpendicularly at the local spiral arm, where the field is predominantly directed along the arm (Crutcher et al. Crutcher-et-al-93 (1993)).
One of the most interesting cases of these observations is the nearby () Taurus complex for which several polarization analyses have been made. There is additional support for in it (at least around the TMC-1C core): this is a high aspect ratio of the core flattening along (Troland et al. Troland-et-al-1996 (1996)). Thus, we may assume that the map of polarizations in the Taurus cloud (e. g. Moneti et al. Moneti-et-al-84 (1984)) gives us a large-scale direction of .
Denser regions in Taurus are filamentary in the plane of the sky, as the column density map shows (e. g. Wiseman & Adams Wiseman-Adams-94 (1994)), but we expect that a large-scale () gradient of density in the Taurus cloud should be nearly aligned with the direction of magnetic field. The cloud has a flattened structure which is belived to be the result of the collapse controlled by interstellar magnetic field (Heyer et al. Heyer-et-al-87 (1987)). In such a case, gas tends to collapse along magnetic field lines and this causes the minor axis of the cloud to be parallel to . The direction of the density gradient should be along the minor axis of the collapsed object.
We would like to note that in a situation when we cannot have firm orientations of magnetic field and density gradient from observations, SNR itself may sometimes be considered as a test of these orientations because the radio morphology of SNR depends on the magnetic field and the thermal X-ray morphology – on the interstellar density.
4.3 Barrel-like TXCs
It is obvious that the projection model of TXCs does not require the density gradient to be strictly along the line of sight. When inclination angle changes from to , the thermal X-ray peak moves from the center of the projection to an edge. Therefore, the boundary between SNRs which are either centrally-peaked or limb-brightened in X-rays is not quite clear from the point of view of the proposed model: the both cases are the same shell-like SNRs projected onto the plane of the sky in different ways.
Another interesting fact concerns a more crucial component of the model. The magnetic field component along the line of sight should be maximum among other components to provide a shell-like radio morphology. As it has been noted above, if the magnetic field is oriented primarily in the projection plane, we can observe a barrel-like morphology (Fig 1). Such a situation suggests looking for remnants which have a barrel-like radio morphology ( close to ) coupled with a centrally-brightened thermal X-ray one. Such remnants yield additional support for the projection model of TXCs, since these SNRs are simply another case of the magnetic field orientation.
The list of 17 SNRs which are bilateral in the radio band is presented by Gaensler (Gaensler-98 (1998)). Unfortunately, X-ray observations are only known for 6 of them (Green Green-2000 (2000)). Three of these 6 SNRs are of a shell-like type, both in radio and X-rays ($γ$~Cygni, G156.2+5.7 and SN 1006), two others (G296.5+10.0 and RCW89) have pulsars. Only VRO~42.05.01 is centrally-brightened in thermal X-rays (Burrows & Guo Burrows-Guo-94 (1994); Guo & Burrows Guo-Burrows-97 (1997)). It, therefore, is a candidate for a ”barrel-like TXC”. The results of future X-ray observations will show whether there exist more such remnants.
4.4 -rays from TXCs
Gamma-ray emission from SNRs is important because it allows us to draw conclusions about the cosmic ray acceleration on shocks.
Recent observations of nonthermal X-rays from the SN~Tycho (Ammosov et al. Ammosov-et-al-94 (1994)), SN~1006 (Koyama et al. Koyama_et_al-95 (1995)), Cas~A (Allen et al. Allen_et_al-97 (1997)), G347.3-0.5 (Koyama t al. Koyama_et_al-97 (1997)), IC~443 (Keohane et al. Keohane-P-97 (1997)), G266.2-1.2 (Slane et al. Slane-Huges-et-al-00 (2000)) and TeV -rays from SN~1006 (Tanimori et al. Tanimori_et_al-98 (1998)), and G347.3-0.5 (Muraishi et al. Muraishi-et-al-00 (2000)) give firm experimental confirmations that Galaxy cosmic rays are accelerated on the shocks of SNRs up to the energies .
The third EGRET catalog (Hartman et al. 3EG (1999)) lists 170 unidentified GeV -ray sources. 74 of them are located at and 22 of these sources coinside with directions towards known SNRs (Romero et al. Romero-B-T-99 (1999)). 6 SNRs from this list are TXCs (IC~443, MSH~11-61A, W28, W44, 3C396, G359.1-0.5), 2 are Crab-like (CTB~87, G27.8+0.6) and 4 are of a shell-like type (Puppis~A, Vela, G359.0-0.9, $γ$-Cygni). It is not clear which morphological class other SNRs belong to, because no X-ray observations of them have been reported (Green Green-2000 (2000)).
Different emission mechanisms compete in the analysis of observed -ray spectra. Unfortunately, we still have no direct observational confirmations as to proton acceleration in SNRs. Only -rays from meson decays created in proton-nucleon interactions allow us to look inside the cosmic ray nuclear component acceleration processes. To make proton origin -rays dominating in an SNR model, we need a high number density of target nuclei (). Therefore, decay -rays are expected from SNRs which interact with molecular clouds. The new model for TXCs strongly suggests: the thermal X-ray peak inside the radio shell of SNR testifies that one part of the SNR shock enters a denser medium than other parts of the shell. Thus, the proposed model of TXCs allows us to consider members of this class as prospective sources of decay -emission.
5 Conclusions
Considering 2-D or 3-D models of SNRs it is necessary to take into account the effects of the projection. Once projected onto the plane of the sky, such an object changes its appearance depending on the actual density contrast across the remnant and on the angle between the density gradient and the direction towards the observer. If the ambient density gradient does not lie in the plane of the projection and is strong enough, and if the magnetic field is nearly aligned with the line of sight, then the visible thermal X-ray morphology of SNR will be centrally-filled, while the radio morphology will remain limb-brightened. The projection effect is maximum when the density gradient is oriented along the line of sight. Only a scale-height of order in ambient medium density distribution can cause projected composites.
All theoretical properties of projected composites correspond to observational properties of thermal X-ray composites. Thus, the circumstances should exist when SNRs are projected as centrally-filled X-ray objects.
Majority of the members of a mixed-morphology class are really located near molecular clouds. Therefore, at least a part of them may be the result of a simple projection effect of the adiabatic SNR evolved in a nonuniform medium, e.g., at the edge of a molecular cloud.
If the prediction that a part of barrel-like radio SNRs have a centrally-filled thermal X-ray morphology is confirmed, it will provide additional support for the proposed model. The model suggests that TXCs may be prospective sources of proton origin -rays.
References
- (1) Allen G. E., Keohane J. W., Gotthelf E. V., et al., 1997, ApJ 487, L97
- (2) Ammosov et al., 1994, Sov. Astron. Lett. 20, 191
- (3) Blondin et al., 1998, ApJ 500, 342
- (4) Burrows D. & Guo Z., 1994, ApJL 421, L19
- (5) Cox D., Shelton R., Maciejewski W., et al., 1999, ApJ 524, 179
- (6) Crutcher R., 1994, in ASP Conf. Ser. 65, Clouds, Cores, and Low Mass Stars, ed. D. Clemens & R. Barvainis (BookCrafters, Inc.), 87
- (7) Crutcher R., 1999, ApJ 520, 706
- (8) Crutcher R., Troland T., Goodman A. et al., 1993, ApJ 407, 175
- (9) Gaensler B., 1998, ApJ 493, 781
- (10) Goodman et al., 1990, ApJ 359, 363
-
(11)
Green D.A., 2000, ‘A Catalogue of Galactic Supernova Remnants (2000 August
version)’, Mullard Radio Astronomy Observatory, Cavendish Laboratory,
Cambridge, United Kingdom
(
http://www.mrao.cam.ac.uk/surveys/snrs/) - (12) Guo Z. & Burrows D., 1997, ApJ 480, L51
- (13) Jones T., Rudnick, L., Jun, B.-I., et al., 1998, PASP 110, 125
- (14) Hartman, R. C., et al., 1999, ApJS, 123, 79
- (15) Heyer M., Vrba F., Snell R. et al., 1987, ApJ 321, 855
- (16) Hnatyk B., 1988, Sov. Astron. Lett. 14, 309
- (17) Hnatyk B., & Petruk O., 1998, Condensed Matter Physics 1, 655 [available also as preprint astro-ph/9902158].
- (18) Hnatyk B., Petruk O., 1999, A&A 344, 295
- (19) Keohane J. W., Petre R., Gotthelf E., et al., 1997, ApJ 484, 350
- (20) Kesteven M., Caswell J., 1987, A&A 183, 118
- (21) Koyama K., Petre R., Gotthelf E. V, et al., 1995, Nature 378, 255
- (22) Koyama K., Kinugasa K., Matsuzaki K., et al., 1997, PASJ 49, L7
- (23) Long K., Blair W., White R., Matsui Y., 1991, ApJ 373, 567
- (24) Matthews B. & Wilson C., 2000, ApJ 531, 868
- (25) Messinger D., Whittet D., Roberge W., 1997, ApJ 487, 314
- (26) Moneti A., Pipher L., Helfer H. et al., 1984, ApJ 282, 509
- (27) Muraishi H., Tanimori T., Yanagita S., et al., 2000, A&A 354, L57
- (28) Raymond J., Smith B., 1977, ApJS 35, 419
- (29) Reynolds S., 1998, ApJ 493, 375 (R98)
- (30) Reynolds S., Chevalier R., 1981, ApJ 245, 912
- (31) Rho J., Petre R., 1996, ApJ 467, 698
- (32) Rho J., Petre R., 1998, ApJ 503, L167 (RP98)
- (33) Rho J., Petre R., Schlegel E., 1994, ApJ 430, 757
- (34) Romero G., Benaglia P., Torres D., 1999, A&A 348, 868
- (35) Sedov L., 1959, Similarity and Dimensional Methods in Mechanics. Academic, New York
- (36) Seward F., 1990, ApJS 73, 781
- (37) Shelton R., Cox D., Maciejewski W., et al., 1999, ApJ 524, 192
- (38) Slane P., Hughes J., Edgar R., et al., 2000, astro-ph/0010510
- (39) Sun M., Wang Z., Chen Y., 1999, ApJ 511, 274
- (40) Tanimori T., Hayami Y., Kamei S., et al., 1998, ApJ 497, L25
- (41) Troland T., 1990, in IAU Symp. 140,Galactic and Intergalactic Magnetic Fields, ed. R. Beck, P. Kronberg & R. Wielebinski (Dordrecht: Kluwer), 293
- (42) Troland T., Crutcher R., Goodman A. et al., 1996, ApJ 471, 302
- (43) Whiteoak J.B., Green A., 1996, A&AS 118, 329
- (44) Wiseman J. & Adams F., 1994, ApJ 435, 708