THERMAL AND NONTHERMAL X-RAY EMISSION IN SNR RCW 86
Abstract
Supernova remnants may exhibit both thermal and nonthermal X-ray emission. Such remnants can be distinguished by the weakness of their X-ray lines, because of the presence of a strong nonthermal X-ray continuum. RCW 86 is a remnant with weak lines, resulting in low and peculiar abundances when thermal models alone are used to interpret its X-ray spectrum. This indicates the presence of a strong nonthermal synchrotron continuum.
We analyze ASCA X-ray spectra of RCW 86 with the help of both nonequilibrium ionization thermal models and nonthermal synchrotron models. A two-temperature thermal model and a simple nonthermal model with an exponential cutoff (plus interstellar absorption) give reasonable results. We obtain blast wave velocity of 800 km s-1, the shock ionization age of cm-3 s, and the break in nonthermal spectra at Hz. The strength of nonthermal continuum correlates well with the radio brightness in the bright SW section of the remnant. This is convincing evidence for X-ray synchrotron emission in RCW 86.
1 RCW 86 AND ITS X-RAY SPECTRUM
| Name | RA (2000) | DEC (2000) | Sequence | Time | Duration | Effective SIS |
|---|---|---|---|---|---|---|
| (hh mm ss) | (∘ ′ ″) | Number | (yy.ddd) | (ksec) | Exposure (ksec) | |
| RCW 86 (FRONT) | 14 40 34.8 | -62 41 17 | 55045000 | 97.048 | 136 | 39 |
| RCW 86 (BACK) | 14 40 54.9 | -62 38 48 | 55046000 | 97.050 | 121 | 42 |
| RCW 86 (BK S1) | 14 40 18.4 | -62 42 24 | 55046010 | 97.226 | 134 | 44 |
RCW 86 (G315.4–2.3) is a shell-like supernova remnant (SNR) in the southern sky, 42′ in angular size, and 35 pc in linear size at a kinematic distance of 3 kpc found from optical observations by Rosado et al. (1996). (The distance estimate is uncertain, and values as low as 1 kpc cannot be excluded according to Smith 1997). Optical emission from radiative shocks is present at various locations along its shell, with by far the brightest complex of optical filaments in the SW. This bright complex, to which the optical designation “RCW 86” actually refers, has been generally interpreted as the result of the interaction of the blast wave with a dense ( cm-3) interstellar cloud (e. g., Rosado et al. 1996; Smith 1997). The slow ( km s-1) radiative shocks are thought to have been driven into the cloud by the blast wave impact. Optical, Balmer-dominated emission from faster nonradiative shocks was also detected (Long & Blair 1990), and Smith (1997) found that Balmer-dominated optical filaments almost completely encircle RCW 86. This is presumably a blast wave propagating into a low-density ( cm-3, Long & Blair 1990) interstellar medium (ISM). Its velocity is in the range of 400–900 km s-1, found from the width of the broad H component (Long & Blair 1990; Ghavamian 1999; Ghavamian et al. 2000). The remnant’s age is yr, derived from the remnant’s angular size of 42′, its distance of 3 kpc and the known shock speed (Rosado et al. 1996). (However, note that RCW 86 may be as young as 2000 yr if it is located at distance of 1 kpc.) As expected, thermal X-ray emission produced behind fast shocks (Pisarski, Helfand, & Kahn 1984), nonthermal radio synchrotron emission from relativistic electrons (Whiteoak & Green 1996: Molonglo catalog), and strong IR emission from collisionally heated dust (Dwek et al. 1987; Arendt 1989; Greidanus & Strom 1990; Saken, Fesen, & Shull 1992) are all present. RCW 86 was thought to be a remnant of SN 185 (Clark & Stephenson 1977), but even the existence of this SN has been questioned (Chin & Huang 1994; Schaefer 1995).
RCW 86 is clearly an interesting SNR, seen across the wavelength band from radio to X-rays, with both slow and fast shocks present. But the most interesting is its peculiar X-ray spectrum as revealed by the ASCA Performance Verification (PV) observations (Vink, Kaastra, & Bleeker 1997). The X-ray lines are generally much weaker than expected from a normal (solar) abundance plasma, with the exception of the Fe K line at 6.4 keV. Vink et al. (1997) fitted ASCA data with two-temperature nonequlibrium ionization (NEI) models and found strongly subsolar abundances (except for Fe in their hot temperature component) and extremely low ( cm-3 s) ionization timescales . These results are clearly unphysical, and Vink at al. speculated that perhaps they are caused by strong deviations from the Maxwellian electron distribution for low-temperature plasmas. A more recent study of RCW 86 by Bocchino et al. (2000), based on BeppoSAX satellite data, confirmed the weakness of emission lines (other than the Fe K line), although the authors attributed this effect to elemental depletion onto dust.
The goal of this paper is to explain the puzzling X-ray spectrum of RCW 86, based on new, high signal-to-noise (S/N) ASCA observations. These new observations are presented and briefly discussed in § 2, while in § 3 we analyze these observations in detail and show that they can be succesfully explained as a combination of thermal emission and nonthermal synchrotron emission. In § 4, we summarize our results and discuss prospects for further progress.
2 1997 ASCA OBSERVATIONS OF RCW 86 AND THEIR INTERPRETATION
Three long observations of RCW 86 were performed by ASCA in 1997 (Table 1). The data were processed under standard Revision 2 Data Processing (REV2) and screened according to the following criteria: elevation angle greater than 10 degrees, geomagnetic field structure with cut-off rigidity greater than 6, observations outside South Atlantic Anomaly, stable pointing, and stable internal background (from monitored Gas Imaging Spectrometers count rates). The effective exposure times after screening are typically about 40 ks as shown in Table 1. Note that the effective exposure time of the PV observations used by Vink et al. is only 14 ks. The long exposure times of the new observations resulted in good S/N spectra, leading to a significant improvement over the PV observations, particularly at intermediate and high photon energies. This allowed us to separate thermal and nonthermal contributions to the X-ray spectrum.
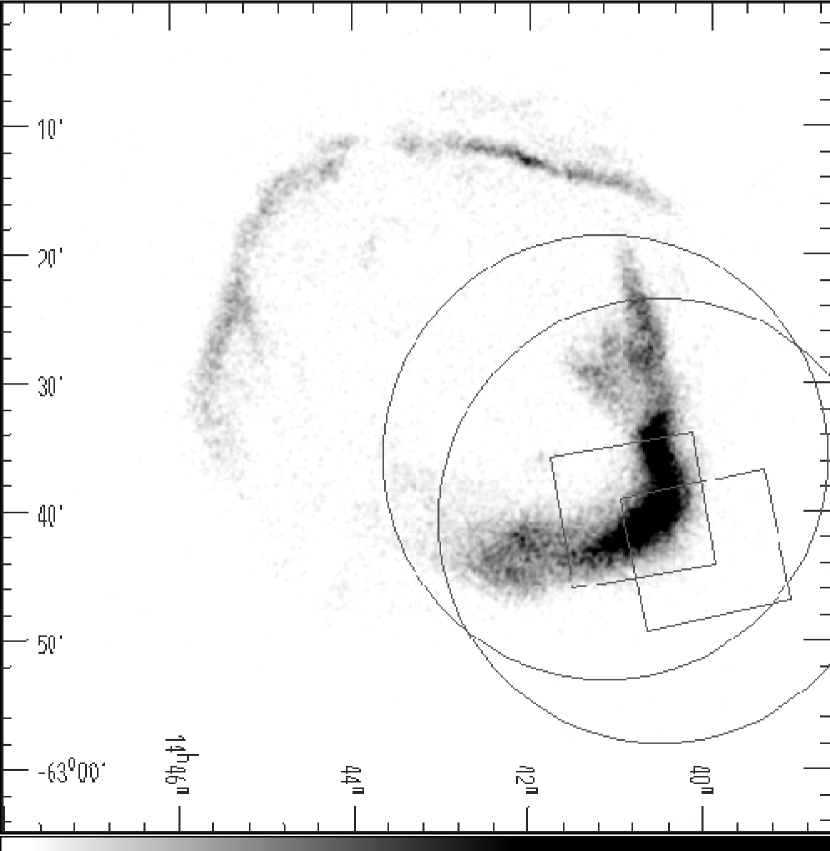
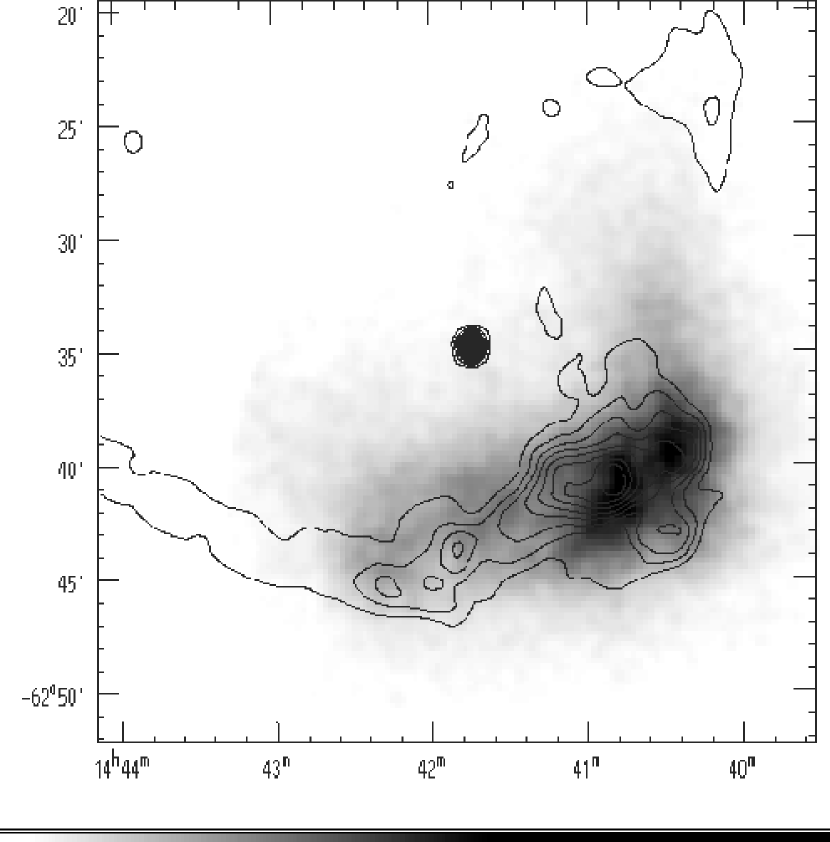
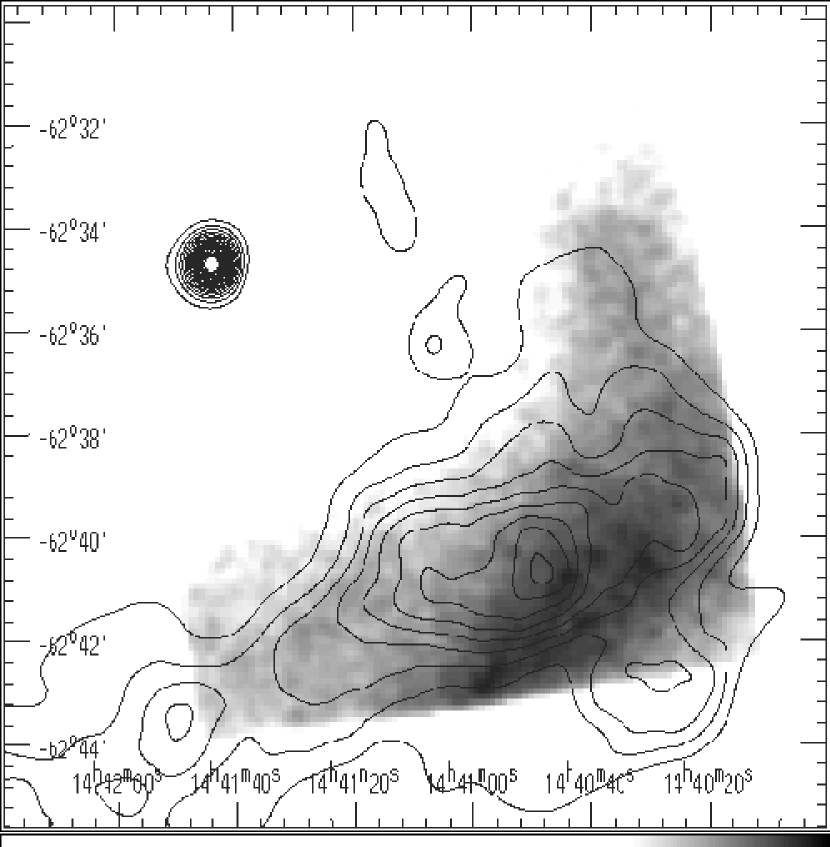
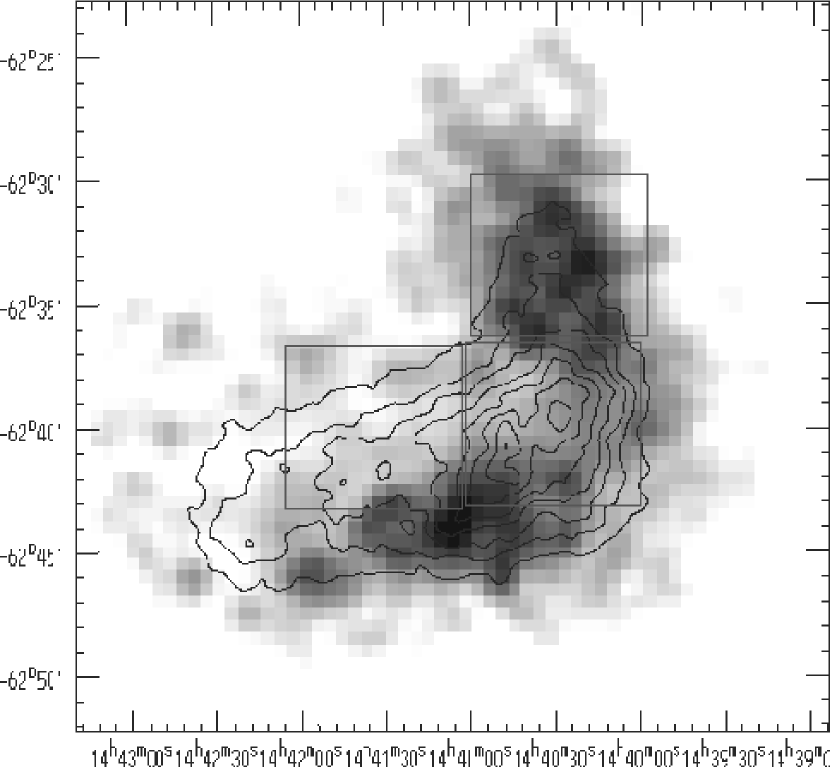
Fields of view of solid-state imaging spectrometers (SIS) and gas-imaging spectrometers (GIS) for the first two observations listed in Table 1 (sequences 55045000 and 55046010) are plotted on the ROSAT PSPC image of RCW 86 (Figure 1). The third pointing in the SW (sequence 55046000) is not shown, because its SIS field of view is centered outside the remnant. However, this pointing contains useful GIS data on the SW part of the remnant. These three long pointings provide high S/N images and spectra of the brightest part of RCW 86. GIS and SIS images are shown separately in Figures 2 and 3, respectively, while a GIS hardness map defined as the soft ( keV) to hard ( keV) count rate ratio is shown in Figure 4. The GIS hardness map is affected by the difference in the SIS and GIS point spread functions. Significant spectral variations are readily apparent in this map, in accord with findings of Vink et al. (1997) which were based on PV observations with a much lower S/N ratio. The bright “knee” in the SW corner of the remnant exhibits striking variations in the hardness ratio, with the soft vertical arm and the progressively harder horizontal arm as one moves away (to the west) from the “knee” bend. The 0.843 GHz radio contours shown in Figures 2 and 3, from the Molonglo Observatory Synthesis Telescope (MOST) catalog (Whiteoak & Green 1996), demonstrate that the X-ray hardness is positively correlated with the radio/X-ray brightness ratio.
SIS spectra (Figure 5) of three rectangular regions shown in Figure 4 demonstrate spatial variations quantitatively. Spectra of the vertical and horizontal arms, which we label the Soft and the Hard Regions, respectively, differ dramatically. The Soft Region is brighter at low energies, while the situation reverses at high energies. The Medium-Hard Region at the knee bend is intermediate in its hardness. Lines from O, Ne, and Mg may be discerned in these spectra at low energies, although they are apparently weak. Their presence indicates that X-ray spectrum of RCW 86 is at least partially of the thermal origin.


We first test the hypothesis that X-ray spectra in Figure 5 are produced entirely by thermal plasma, using a set of nonequlibrium ionization (NEI) models developed by us and publicly available in the XSPEC v11 software package. (For introduction to XSPEC, see Arnaud 1996 or visit the web site at http://heasarc.gsfc.nasa.gov.) Thermal NEI models are based on an updated Hamilton & Sarazin (1984) spectral code, which includes recent atomic calculations for Fe L-shell lines by Liedahl, Osterheld, & Goldstein (1995). These models are discussed in more detail by Borkowski, Lyerly, & Reynolds (in preparation). We used Sedov models with the variable metal abundances (but with their relative abundances fixed in solar ratios) to fit these spectra, with the best fit models shown in Figure 6. Shock temperatures, postshock electron temperatures, and SNR ionization timescales (equal to the product of postshock electron density and the remnant’s age) are: 1.4, 1.2, and 2 keV; 1.3, 1.2, and 0.7 keV; and cm-3 s, cm-3 s, and cm-3 s, for the Hard, Medium-Hard, and Soft Regions, respectively. In all three regions we arrived at the absorbing column number density of cm-2. Metal abundances in these models are low (0.2, 0.4, and 0.55 solar for the Hard, Medium-Hard, and Soft Regions, respectively), and spatially varying. Spatial abundance variations at the periphery of RCW 86 are not expected, and something is obviously wrong with these models. Fits with thermal models with variable abundances presented by Vink et al. (1997) also lead to strongly subsolar abundances of heavy elements and extremely low ionization timescales. As these authors pointed out, this is clearly unphysical, and they also concluded that standard thermal models do not provide a satisfactory description of the X-ray spectrum of RCW 86.
The weakness of spectral lines suggests the presence of nonthermal X-ray continuum in RCW 86, as has been recently inferred for SN 1006 (Koyama et al., 1995), Cas A (Allen et al., 1997), G347.5-0.2 (Slane et al., 1999), and possibly even in RCW 86 itself based on its high-energy spectrum obtained by the Rossi X-ray Timing Explorer (Allen, Gotthelf, & Petre 1999). The spatial correlation between the radio and X-ray emission noted above suggests that this continuum may be produced by synchrotron X-ray emission from relativistic electrons. In order to test this hypothesis, we modeled SIS spectra as a sum of nonthermal and thermal emission (plus interstellar absorption). We used a simple nonthermal model with a power-law electron energy distribution and an exponential cutoff at high electron energies (the srcut model in XSPEC v11, see Reynolds 1998 and Reynolds & Keohane 1999 for more details) and a thermal Sedov model. The srcut model is parameterized by a 1 GHz flux density (in Jy) and spectral index, and a break frequency which is the peak frequency emitted by electrons with the -folding energy of the exponential cutoff (at which the spectrum has dropped by a factor of about 3.7). Abundances were assumed to be 2/3 solar as appropriate for the ISM in the solar neighbourhood (e. g., Snow & Witt 1996; Mathis 1996). Nonthermal models were normalized by the 1 GHz radio flux obtained by integrating 0.843 GHz radio emission over the SIS extraction regions and extrapolating to 1 GHz using the observed radio spectral index of 0.6 (Green 1998). However, for the fitting, the radio-to-X-ray spectral index was allowed to vary. Resulting fits are shown in Figure 7. The quality of the fits is better than for the pure thermal models, although they are still not statistically acceptable. But unlike for pure thermal fits, parameter values of these mixed thermal and nonthermal models are physically reasonable. The Sedov model parameters are very similar in all three regions: shock temperatures in the range from 1.0 to 1.4 keV, low ( keV) postshock electron temperatures, and ionization timescales in the range from cm-3 s to cm-3 s. For the nonthermal srcut models we obtain break frequencies of , , Hz for the Hard, Medium-Hard, and Soft Regions, respectively, and radio spectral frequencies in the range from 0.62 to 0.67, in surprisingly good agreement with the (uncertain) observed RCW 86 spectral index of 0.6. The lower electron temperatures are a natural result of attributing some of the continuum to nonthermal emission, but we stress that these models are not well constrained and this may be an artifact.

But the actual situation is more complex than described above, because a weak Fe K line at 6.4 keV seen in the SIS spectrum of the Medium-Hard Region is not present in the models. This line, already noted by Vink et al., is most likely produced by a high-temperature thermal plasma. In order to investigate this line in more detail, we combined available GIS2 data to construct a high S/N spectrum (Figure 8), which clearly shows Fe K line. At high energies above 5.5 keV, these data are fit well by a bremsstrahlung continuum with electron temperature keV (with 3.7–8.8 keV 90% confidence interval) plus a narrow Gaussian line at 6.42 keV (with 6.35–6.45 keV 90% confidence interval). Such a low energy of the Fe K line suggests a very low ionization timescale of the hot plasma. This is confirmed by fitting a single ionization timescale, single temperature thermal NEI model (vnei model in XSPEC, with variable Fe abundance and solar abundances for other heavy elements) to our GIS data above 5.5 keV. We obtain plasma temperature of 5.3 keV (with 3.6–8.6 keV 90% confidence interval), a very low ionization timescale of cm-3 s (less than cm-3 s with 90% confidence), and Fe abundance of 3.5 solar (with 1.2–3000 90% confidence interval). Model parameters and confidence intervals depend quite sensitively on the chosen energy range, resulting in progressively lower electron temperatures as lower energy photons are included in the fits. Atomic data for Fe K line emission produced by electron excitation of low-ionization stages of Fe are poor, further contributing to uncertainties in derived parameter values, the Fe abundance in particular. It is also possible that Fe K is produced in dust grains (Borkowski & Szymkowiak 1997), which would make our estimates of the ionization timescale unreliable. In this situation, the true confidence intervals for all model parameters are certainly much larger that the confidence intervals just quoted. In particular, approximately solar abundance of Fe is consistent with the current data.
The best-fit thermal bremsstrahlung and nei models produce similar spectra across the GIS spectral range (Figure 8), without any prominent emission lines except for the fluorescent Fe K line. In the nei model this is caused by an extremely low ionization state of the gas, where all heavy elements have not yet been ionized to their H- and He-like stages (in the case of Fe even M-shell electrons must still be present because of the apparent absence of the Fe L-shell emission). The presence or absence of lines depends very sensitively on the ionization timescale of the gas. If we assume that the ionization timescale is equal to cm-3 s (the upper 90% confidence limit in our fits), and fit the nei model to the GIS2 data above 5.5 keV, the lines are already very prominent (Figure 8). This extreme sensitivity to the ionization timescale means that the contribution of the high-energy thermal component to the X-ray spectrum at low photon energies is not well constrained by the data, although in all cases this contribution is not negligible and must be included in spectral modeling.

The presence of a poorly-constrained high-temperature thermal component in RCW 86 significantly complicates analysis of its X-ray spectrum, and our previous arguments about the necessity of the nonthermal component need to be reexamined. Is it possible that a mixture of gas with standard ISM abundances but with widely different temperatures results in the observed weakness of the lines? The answer seems negative, according to Vink et al. (1997), and according to Bocchino et al. (2000) who fitted BeppoSAX spectra of the SW region of RCW 86 with a two-component NEI model. Bocchino et al. (2000) derived the following parameters for the high-temperature component: keV, ionization timescale of cm-3 s, and the Fe abundance of 3.0 with respect to solar, in excellent agreement with our results. But the derived abundances in the low-temperature (1.0 keV) NEI component are again strongly (0.25) subsolar. We also attempted to fit two-component (Sedov and nei) thermal models to our ASCA SIS spectra, but the the derived abundances in Sedov models are again strongly subsolar and spatially varying. Although this result does not rule out the possibility of the pure thermal explanation, it demonstrates that such an alternative is unlikely, in accord with Vink et al. (1997). Another alternative explanation for the apparent subsolar abundances, elemental depletion onto dust (Bocchino et al. 2000), is not supported by the abundance patterns derived from ASCA and BeppoSax observations. In view of these findings, we now present our efforts to construct a physically reasonable model for the X-ray spectrum of RCW 86, in which we allow for a simultaneous presence of nonthermal synchrotron emission and thermal emission from multi-temperature plasma.
3 X-RAY SPECTRA OF RCW 86 AS A MIXTURE OF THERMAL AND NONTHERMAL EMISSION
We begin with the analysis and modeling of the brightest extraction region, the Medium-Hard Region at the knee bend (see Figure 4). In addition to the SIS spectra described in the previous section, we also use the GIS spectrum extracted from the same spatial region in order to improve S/N ratio at higher photon energies. Below 1.2 keV, the PV SIS spectra are used instead of the newer SIS and GIS data because of their superior spectral resolution and good S/N ratio. These three data sets are shown in Figure 9. We always include these data sets together in our analysis, by performing joint fits to the PV SIS data, and the 1997 SIS and GIS data. In order to allow for mismatch between normalizations of individual data sets, we allowed them to vary when performing joint fits to the data.
The thermal plasma emission is modeled as a sum of low-temperature and high-temperature components. For the low-temperature component, we use either a simple plane-parallel shock model with constant electron temperature and ionization age (the pshock model in XSPEC) or a much more complex spherically-symmetric shock with unequal ion and electron temperatures (the Sedov model) which was already described previously. The high-temperature component is described by a simplest NEI model, a single ionization timescale model nei. The nonthermal synchrotron emission is modeled by the srcut model, using the observed radio flux and its spectral index, and allowing the break frequency to vary. (If a power law is used instead of the scrut model, the separation between the thermal and nonthermal components becomes more difficult, and the fitted power-law index and normalization of the power-law component are also difficult to interpret.)
Because of the presence of synchrotron emission, the chemical abundances cannot be reliably determined from the observed spectra, so that we assumed 2/3 solar abundances in the low-temperature thermal component. Furthermore, the S/N ratio of the current data sets at high photon energies is not adequate for a unique separation between the high-temperature thermal component and the nonthermal synchrotron emission. In this situation we assumed that all emission above 5.5 keV is thermal, and used parameters of the high-temperature thermal component obtained by fitting spatially-integrated GIS spectra above 5.5 keV (see § 2). The normalization of this component was obtained by fitting this thermal model alone to the spectral data above 5.5 keV. The modeling results for the two models described above are tabulated in Table 2.

We generally obtain similar results for our two types of models, pshock+nei+srcut and Sedov+nei+srcut, although fits are always better for the former. The best-fit pshock+nei+srcut model for the Medium-Hard Region is shown in Figure 9. The low- (high-) temperature thermal component dominates at low (high) energies, and the nonthermal synchrotron emission is most important in the intermediate energy range. However, the nonthermal component contributes at all energies, accounting for 22% of the total detected flux in the 0.5 – 10 keV range (this fraction is shown in the last row of Table 2). The top panel in Figure 9, with the high-quality PV SIS data, shows most clearly how strong nonthermal emission leads to low equivalent widths for the prominent Mg and Si lines.
| Medium-Hard Region | Soft Region | Hard Region | ||||
| Model Parameters | Aaa | Bbb | A | B | A | B |
| (cm-2) | ||||||
| (keV) | 0.75 | 0.90ccPostshock gas temperature (0.04ddPostshock electron temperature ) | 0.77 | 1.10 (0.07) | 0.80 | 1.4 (0.05eeFixed ) |
| (cm-3s) | ||||||
| Abundance (fixed) | 2/3 | 2/3 | 2/3 | 2/3 | 2/3 | 2/3 |
| (cm-5) | ||||||
| (keV) (fixed) | 5.3 | 5.3 | 5.3 | |||
| (cm-3s) (fixed) | ||||||
| Abundance (fixed) | 1 | 1 | 1 | |||
| Fe (fixed) | 3.4 | 3.4 | 3.4 | |||
| (cm-5) | ||||||
| (Hz) | ||||||
| (fixed) | 0.6 | 0.6 | 0.6 | 0.6 | 0.6 | 0.6 |
| (Jy) | 4.48 | 4.48 | 0.57 | 0.57 | 3.19 | 3.19 |
| XffNonthermal/(nonthermal+thermal) flux ratio (0.5-10 keV) | 22% | 20% | 1.8% | 1.2% | 33% | 33% |
Modeling of the Soft and Hard Regions is done in exactly the same way as for the Medium-Hard Region, except that we do not use PV SIS data because of their lower S/N. (For the Hard Region and the Sedov+nei+scrut model, the shock temperature and the postshock electron temperature in the Sedov model could not be determined independently, so that we fixed the postshock electron temperature to a low value of 0.05 keV, similar to the postshock electron temperatures found in the Medium-Hard and Soft Regions.) Our SIS and GIS data for the Soft Region, together with the best-fit pshock+nei+srcut model fom Table 2, are shown in Figure 10. As expected, the low- (high-) temperature thermal component dominates again at low (high) energies, but the nonthermal component contributes only 1.8% to the total flux in this model.
The situation is very much different in the Hard Region (Figure 11), where nonthermal emission is very prominent, contributing 33% of the total flux. Again, emission at high energies is dominated by the high-temperature thermal component with an Fe K line clearly seen at 6.4 keV, and faint lines with low equivalent widths at low energies are produced by the low-temperature component. But the emission measure of the latter is at least twice as low as in the Medium-Hard and Soft Regions (see Table 2). At the same time, the nonthermal component appears to be at the same intensity level as in the Medium-Hard Region, leading to the increased fraction of the nonthermal emission in the Hard Region.
The nonthermal synchrotron emission is strongly correlated with the radio emission. In the pshock+nei+srcut model, after correction for absorption, we obtain the total 0.5–10 keV X-ray synchrotron fluxes of ergs cm-2 s-1, ergs cm-2 s-1, and ergs cm-2 s-1 for the Medium-Hard, Soft, and the Hard Regions, respectively. The corresponding 1 GHz radio fluxes are 4.5 Jy, 0.57 Jy, and 3.2 Jy. The low synchrotron X-ray flux is accompanied by the low radio flux in the Soft Region, while an order of magnitude increase in the nonthermal X-rays in the Medium-Hard and Hard Regions is matched by a similar increase in the radio flux. Note that such drastic changes are not seen in the thermal X-ray flux in the 0.5–10 keV range, which varies by only 20% between the regions. Such strong positive correlation between nonthermal X-ray and radio emission is seen in the prototypical synchrotron-dominated remnant of SN1006. The presence of this correlation in RCW 86 strongly supports the synchrotron nature of the nonthermal emission in this remnant.
Our fitted values for the break frequency are all in the range Hz. The energy of an electron producing its peak synchrotron radiation at in a magnetic field is given by
| (1) |
Our values for then range from 14 to 45 erg (9 to 28 TeV), at the low end of the range of upper limits to found for bright Galactic remnants by Reynolds & Keohane (1999).


Since RCW 86 is a more highly evolved remnant than other objects in which synchrotron X-rays have been discovered, it is likely that the mechanism causing the rolloff in the electron distribution above is synchrotron (and inverse-Compton) losses. Reynolds (1998) gives expressions for the maximum electron energy producible by shock acceleration limited by radiative losses, assuming that the electron mean free path is a factor times the gyroradius. In the strong-turbulence (Bohm) limit, . For such conditions, with a shock compression ratio of 4, we have
| (2) |
where is the upstream magnetic-field strength and the shock velocity in units of cm s-1. Since optical inferences (Ghavamian 1999; Ghavamian et al. 2000) give nonradiative-shock velocities in the range of 400 to 900 km s-1, we find predicted values for the loss-limited break energy quite close to the break energies we infer from the fits, for of a few microgauss and . A loss-limited spectrum will not have the exact shape of the srcut spectrum, but will roll off more slowly. However, given the limited spectral range of the fits, we cannot distinguish that difference, which in any case is less than the difference between the srcut spectrum and a straight power-law. The coincidence between expected and observed cutoff energies, while not an ironclad conclusion, adds circumstantial support to the idea that synchrotron X-rays are present in RCW 86. The electron-acceleration properties do not appear to vary much among the three regions we have studied; the primary difference in the nonthermal emission is just the overall strength of the emission, perhaps as a result of differences in magnetic-field strength.
The thermal X-ray emission consists of two distinct components: a low-temperature component responsible for X-ray lines at low energies and a high-temperature plasma where Fe K line is produced. The ratio of their emission measures systematically varies from a high () value in the Soft Region, through intermediate (4-5) values in the Medium-Hard Region, and attains the lowest (2) value in the Hard Region. The high- and low-temperature plasma should be in an approximate pressure equilibrium, , where and are electron densities in the low- and high-temperature components, and and are their electron temperatures. For the Medium-Hard Region and the pshock+nei+srcut model, keV and keV, and the assumption of a pressure balance gives a density ratio . But their emission measures differ by only a factor of 4, which suggests that the filling fraction of the high-temperature component is much higher that the filling fraction of the low-temperature component. If we assume that the hot gas fills most of the volume of the Medium-Hard Region, very approximately equal to pc (where 6 pc is the linear size of the ASCA extraction region at the assumed distance of 3 kpc), then we arrive at (where was set to 1), based on the emission measure of the hot component listed in Table 2. Similarly, the low-temperature component has density cm-3, while we obtain cm-3 by assuming a pressure balance between the high- and low-temperature components. In order to make these estimates consistent, a low filling fraction of 0.075 is required for the low-temperature component. A low filling fraction is indeed suggested by a highly filamentary morphology of this region of the remnant seen in the archival HRI ROSAT images (Bocchino et al. 2000). The thickness of sharpest filaments seen in the HRI images is of the order of 10″ or even less, which is much smaller than the 7′ 7′ angular size of the Medium-Hard Region.
The low-temperature X-ray component is most likely produced in the blast wave propagating into the ambient medium. The electron temperature of 0.8 keV in the pshock+nei+srcut models implies a shock speed of 800 km s-1 if electrons are fully equilibrated with ions. In the absence of electron-ion equilibration, the shock speed might be even higher, above 1000 km s-1 as suggested by mean postshock temperatures in excess of 1 keV in the Sedov+nei+srcut models. The 800 km s-1 shock velocity is at the upper velocity range of nonradiative, Balmer dominated shocks seen in RCW 86 (Long & Blair 1990; Ghavamian 1999; Ghavamian et al. 2000). The preshock density cm-3 is also in accord with estimates of the preshock density in fast nonradiative shocks in RCW 86. For example, Ghavamian (1999) finds preshock density of 1 cm-3 for a km s-1 shock located at the southern boundary of the Hard and Medium-Hard Regions. The shock age, yr, is in reasonable agreement with the remnant age estimated at yr by Rosado et al. (1996) from standard arguments based on the Sedov dynamics, and at 4,300 yr by Petruk (1999) whose estimates were based on 2-D hydrodynamical simulations. This agreement further supports the identification of the low-temperature thermal component with the material shocked by the blast wave. Bocchino et al. (2000) also attributed the low-temperature component to the shocked ambient gas based on analysis of BeppoSAX and ROSAT data.
The high-temperature thermal component is produced by hot, tenuous gas in the remnant’s interior. The best evidence for this is provided by the BeppoSAX hardness map (Bocchino et al. 2000), which shows that the hard X-ray emission is located interior to the soft X-ray emission. The high (5.3 keV) temperature of the hot component suggests that this material was thermalized in fast, several thousand km s-1 shocks at earlier stages of evolution of RCW 86. As determined by fitting GIS data in § 2, its ionization age is less than cm-3 s at the 90% confidence level, which in combination with its electron density of cm-3 leads to an upper limit of 1000 yr for its age. However, if Fe resided in dust grains instead of gas, this upper limit would be several times higher, and entirely consistent the blast wave age derived previously. The Fe abundance in the hot gas is uncertain, but may be enhanced with respect to the solar Fe abundance. If real, this would imply the presence of heavy-element SN ejecta in the hot thermal component, as already suggested by Bocchino et al. (2000). This component might have originated in the interaction of the blast wave with a low-density cavity created by the SN progenitor prior to its explosion (Vink et al. 1997). It cannot be the normal hot interior of a Sedov blast wave, at least for the Sedov profile corresponding to the current blast-wave conditions, or our previous Sedov fitting would have accounted for it.
Because of the simultaneous presence of two (or more) thermal components and of the nonthermal continuum, the separation of the X-ray spectrum of RCW 86 into individual components is difficult and uncertain. The separation of thermal emission into a low-temperature single shock component and a single ionization timescale component with high (and constant) temperature is certainly a reasonable first approximation, but one might expect that such a simple model would not be able to provide a perfect match to the observed X-ray spectrum. This is indeed the case because our best fits are not statistically acceptable at low photon energies, where ASCA provided a high-quality X-ray spectrum with the excellent S/N ratio. We speculate that these problems stem from the simultaneous presence of shocks with different velocities in our extraction regions. Optical observations indicate presence of shocks in a wide range of shock velocities from km s-1 to 900 km s-1 in various regions of RCW 86. Both slow ( km s-1) and fast ( km s-1) shocks are within the extraction regions, as evidenced by the presence of radiative optical filaments and by the ASCA spectra, respectively. While km s-1 shocks cannot produce X-ray emission, intermediate-velocity ( km s-1) shocks capable of producing X-ray emission are present at the southern boundary of the Medium-Hard and Hard Regions (Long & Blair 1990; Ghavamian 1999; Ghavamian et al. 2000). X-ray emission from such intermediate-velocity shocks might have been already detected in the ROSAT PSPC spectra of RCW 86 by Bocchino et al. (2000), who reported the presence of very low (0.29 keV) temperature gas in the SW region of RCW 86. X-ray emission from these intermediate-velocity shocks is not accounted for in our simple decomposition of the X-ray spectra. Our derived model parameters must then be considered as preliminary rather than as robust estimates. In particular, low postshock electron temperatures in Sedov models (Table 2) might be an artifact of the model used instead of a measurement of the postshock electron temperature. In view of the limited spatial and spectral resolution of the ASCA satellite and its detectors, it would be premature at this time to construct a more sophisticated thermal models with multiple shock components.
4 DISCUSSION
Detailed modeling of X-ray spectrum of RCW 86 revealed the presence of the nonthermal synchrotron emission, in addition to high- and low-temperature thermal components. This nonthermal emission is strongly correlated with the radio emission, and the derived break frequency of Hz is consistent with the maximum electron energy producible by shock acceleration limited by radiative losses. The presence of nonthermal synchrotron emission explains why previous attempts to model X-ray spectrum of RCW 86 in terms of pure thermal emission led to puzzling results.
The nonthermal synchrotron emission is most important at intermediate (1–3 keV) photon energies, while at low (high) energies the ASCA X-ray spectrum is dominated by a low- (high-) temperature thermal component. This is a more complex behavior than seen in remnants such as SN1006 where thermal emission dominates at low energies, while nonthermal emission is most pronounced at high energies. To model the nonthermal component, a physically reasonable description is necessary, as much for the implied inferences about the thermal emission as for the synchrotron emission itself. We do not expect power-laws in X-ray synchrotron emission as we are always observing the high-energy rolloff; using power-laws for modeling, while perhaps allowed by the data in some cases, can lead to misleading inferences about spectral-line equivalent widths. For the srcut model with a break frequency of Hz, a power-law tangent to that model at 2.1 keV (in the region where synchrotron emission dominates in RCW 86) overpredicts the continuum at 6.4 keV by 50% compared to srcut – so the equivalent width of the Fe K line would be considerably underestimated by a power-law fit.
The nonthermal spectrum traverses the IR and optical on its way from radio to X-ray wavelengths. Since all the fitted break frequencies are well above the frequency of the center of the band ( Hz), we can assume a straight extrapolation from radio frequencies with a slope of . If the 4.5 Jy at 1 GHz we attribute to the Medium-Hard region were spread uniformly, they would imply a surface brightness at of about 29m arcsec-2. However, the morphology should be identical to the radio; in particular, the radio emission is concentrated in quite thin filaments, so that the peak brightness is larger than average by at least a factor of 10, raising the prediction to arcsec-2, perhaps attainable. At 2 microns, surface brightness would be almost a magnitude brighter.
The derived blast wave velocity of 800 km s-1, the estimated preshock density of cm-3, and the shock age of yr are consistent with previous estimates, although a low (0.075) filling fraction for the gas shocked by the blast wave seems to indicate that emission is dominated by denser than average material. The enhanced X-ray emission and the presence of radiative shocks in the bright SW section of the remnant have been attributed to the interaction of the blast wave with a dense ( cm-3) interstellar cloud. Our findings support this interpretation. The presence of a very hot ( keV) gas with a large filling fraction, with the emission measure far in excess of that expected in a standard Sedov model, indicates that the SN progenitor most likely exploded within a low-density cavity. This suggests that RCW 86 is a remnant of a core-collapse SN, whose progenitor was perhaps a member of an OB stellar association seen at a distance of 2.5 kpc in this region of the sky (Westerlund 1969).
The presence of nonthermal synchrotron emission in RCW 86 is certainly one of the most interesting aspects of this well-studied remnant. Energetic electrons producing this emission have been presumably accelerated in the blast wave, so it would be of great interest to study in greater detail the relationship between the thermal and nonthermal emission, and between optically-emitting shocks and the nonthermal emission. The correlation of both thermal and nonthermal X-ray emission with the strong far-IR emission from collisionally heated dust grains seen in RCW 86 (Dwek et al. 1987; Arendt 1989; Greidanus & Strom 1990; Saken et al. 1992) is also important in view of the crucial role of dust grains in acceleration of cosmic rays (Meyer, Drury, & Ellison 1997; Ellison, Drury, & Meyer 1997). Such studies would allow for better understanding of the shock acceleration process. Unfortunately, the quality of the present X-ray observations does not allow for a unique separation between the thermal and nonthermal emission. In order to achieve this separation, future observations of RCW 86 with a spatial and spectral resolution higher than that of ASCA are necessary, for example with the XMM-Newton or Chandra satellites. XMM-Newton should provide high S/N CCD spectra with a moderate spatial resolution, while Chandra might be able to resolve even the most compact X-ray filaments seen in the ROSAT HRI images. The brightest X-ray filament seen in the ROSAT HRI image of the SW region of RCW 86 (Bocchino et al. 2000) is of particular interest, because it coincides with the brightest nonradiative shock in RCW 86 whose shock velocity and the preshock density was already determined from the optical spectroscopy (Ghavamian 1999). It is also critical to obtain higher spectral resolution data, at the resolution provided by the X-ray microcalorimeter onboard of the failed Astro-E satellite. Such observations would allow for determination of gas temperature from line diagnostics, and hence for unambiguous separation of thermal and nonthermal components. Once these components are separated, one can combine information from both components to learn about acceleration of energetic (TeV) electrons in SNRs. Maybe we can then find out why the nonthermal contribution is so important in RCW 86, and relatively weak in some SNRs.
References
- Allen et al. (1997) Allen, G. E., et al. 1997, ApJ, 487, L97
- Allen et al. (1999) Allen, G. E., Gotthelf, E. V., & Petre, R. 1999, in the Proceedings of the 26th International Cosmic Ray Conference, Salt Lake City
- Arendt (1989) Arendt, R. G. 1989, ApJS, 70, 181
- Arnaud (1996) Arnaud, K. A. 1996, in Astronomical Data Analysis and Systems V, eds. G.Jacoby & J.Barnes, ASP Conf. Series, v.101, 17
- Bocchino et al. (2000) Bocchino, F., Vink, J., Favata, F., Maggio, A., & Sciortino, S. 2000, A&A, in press
- Borkowski & Szymkowiak (1997) Borkowski, K. J., & Szymkowiak, A. E. 1997, ApJ, 477, L49
- Chin & Huang (1994) Chin, Y. N., & Huang, Y. L. 1994, Nature, 371, 398
- Clark & Stephenson (1977) Clark, D., & Stephenson, F. 1977, Historical Supernovae (Pergamon: Oxford)
- Dwek et al. (1987) Dwek, E., Petre, R., Szymkowiak, A. E., & Rice, W. L. 1987, ApJ, 320, L27
- Ellison et al. (1997) Ellison, D., Drury, L. O’C., Meyer, J.-P. 1997, ApJ, 487,197
- Ghavamian (1999) Ghavamian, P. 1999, PH.D Thesis, Rice University
- Ghavamian et al. (2000) Ghavamian, P., Raymond, J., Smith, R. C., & Hartigan, P. 2000, ApJ, in press
- Green (1998) Green, D. A. 1998, A Catalogue of Galactic Supernova Remnants (1998 September version), Mullard Radio Astronomy Observatory, Cambridge, United Kingdom (available on the World-Wide-Web at http://www.mrao.cam.ac.uk/surveys/snrs/)
- Greidanus & Strom (1990) Greidanus, H., & Strom, R. G. 1990, A&A, 240, 385
- Hamilton & Sarazin (1984) Hamilton, A. J. S., & Sarazin, C. L. 1984, ApJ, 284, 601
- Koyama et al. (1995) Koyama, K., Petre, R., Gotthelf, E. V., Hwang, U., Matsura, M., Ozaki, M., Holt, & S. S. 1995, Nature 378, 255
- Liedahl et al. (1995) Liedahl, D. A., Osterheld, A. L., & Goldstein, W. H. 1995, ApJ, 438, L115
- Long & Blair (1990) Long, K. S., & Blair, W. P. 1990, ApJ, 358, L13
- Meyer et al. (1997) Meyer, J.-P., Drury, L. O’C., Ellison, D. 1997, ApJ, 487, 182
- Petruk (1999) Petruk, O. 1999, A&A, 346, 961
- Mathis (1996) Mathis, J. S. 1996, 472, 643
- Pisarski et al. (1984) Pisarski, R., Helfand, D., & Kahn, S. 1984, ApJ, 277, 710
- Reynolds (1998) Reynolds, S. P. 1998, ApJ, 493, 375
- Reynolds & Keohane (1999) Reynolds, S. P., & Keohane, J. W. 1999, ApJ, 525, 368
- Rosado et al. (1996) Rosado, M., Ambrocio-Cruz, P., Le Coarer, E., & Marcelin, M. 1996, A&A, 315, 243
- Saken et al. (1992) Saken, J. M., Fesen, R. A., & Shull, J. M. 1992, ApJS, 81, 715
- Schaefer (1995) Schaeffer, B. E. 1995, AJ, 110, 1793
- Slane et al. (1999) Slane, P. , Gaensler, B. M., Dame, T. M., Hughes, J. P., Plucinsky, P. P. & Green, A. 1999, ApJ, 525, 357
- Smith (1987) Smith, R. C. 1997, AJ, 114, 2664
- Snow & Witt (1996) Snow, T. P., & Witt, A. N. 1996, ApJ, 468, L65
- Vink et al. (1997) Vink, J., Kaastra, J. S., & Bleeker, J. A. M. 1997, A&A, 328, 628
- Westerlund (1969) Westerlund, B. E. 1969, AJ, 74,879
- Whiteoak & Green (1996) Whiteoak, J. B. Z., & Green, A. J. 1996, A&AS, 118, 329 (on-line version at http://www.physics.usyd.edu.au/astrop/wg96cat)