Large-Scale Structures behind the Southern Milky Way in the Great Attractor Region
Abstract
A deep optical galaxy search behind the southern Milky Way and a subsequent redshift survey of the identified obscured galaxies traces clusters and superclusters into the deepest layers of Galactic foreground extinction (). In the Great Attractor region, we have identified a low-mass cluster (the Centaurus–Crux cluster) at () = ( km s-1, km s-1) and found that ACO 3627 (the Norma cluster) at () = ( km s-1, km s-1) is the most massive cluster in the Great Attractor region known to date. It is comparable in virial mass, richness and size to the well-known but more distant Coma cluster. The Norma cluster most likely marks the bottom of the potential well of the Great Attractor. It is located at the intersection of two main large-scale structures, the Centaurus Wall and the Norma supercluster. The flow field observed around the Great Attractor probably is caused by the confluence of these two massive structures.
Department of Astronomy, University of Cape Town, Private Bag, Rondebosch 7700, South Africa
Depto. de Astronomía, Universidad de Guanajuato, Apdo. Postal 144, Guanajuato GTO 36000, Mexico
1. The Zone of Avoidance and the Great Attractor
The Milky Way acts as a natural barrier for studies of the large-scale structure and large-scale dynamics in the Universe; dust and stars in the disk of the Milky Way obscure the light of 20% of the optical extragalactic sky. Galaxies appear smaller and fainter towards the plane of the Milky Way due to the increasing Galactic extinction. This renders diameter- and magnitude-limited samples of galaxies highly incomplete near the Galactic Plane, resulting in a ‘Zone of Avoidance’ (ZOA) in the distribution of galaxies.
The Great Attractor (GA) – a dynamically important overdensity of galaxies in the local Universe – is located close to, or behind, the southern Milky Way (Lynden-Bell et al. 1988; Kolatt, Dekel, & Lahav 1995; Tonry et al. 2000).
This nearby mass overdensity was first noticed through a large-scale systematic flow of galaxies (Lynden-Bell et al. 1988). Even though there is a large excess of optical and IRAS galaxies in this region (Lynden-Bell 1991), no dominant cluster or central peak had been identified (but see Kraan-Korteweg et al. 1996; Woudt 1998), which strongly suggests that a significant fraction of the Great Attractor overdensity could still be obscured by our Milky Way.
2. The Galaxy Distribution in the Great Attractor Region
There are various approaches to trace the galaxy distribution behind the southern Milky Way. One can infer the galaxy distribution indirectly by analysing the peculiar motions of galaxies, assuming that these arise from the irregular mass density field in the local Universe. Alternatively, one can try to observe the galaxy distribution at various wavelengths. By directly observing the galaxy distribution in the ZOA and comparing this with the reconstructed mass density field, important cosmological parameters such as can be inferred (Dekel 1994; Sigad et al. 1998).
The Surmised Galaxy Distribution in the GA Region.
A comprehensive review of the various reconstruction methods, their results, and a comparison with the observed distribution of unveiled galaxies in the ZOA is given by Kraan-Korteweg & Lahav (2000). The two most commonly used methods to reconstruct the galaxy distribution behind the Milky Way are the Wiener Filter method, a statistical approach (see Hoffman; Zaroubi, these proceedings), and the POTENT method (Bertschinger & Dekel 1989; Dekel 1994). The latter uses the peculiar velocities of galaxies to reconstruct the mass density field. The Great Attractor is clearly visible as a significant mass excess located close to the southern Milky Way in both reconstructions (Bistolas 1998; Webster, Lahav, & Fisher 1997; Kolatt et al. 1995). In fact, the best evidence for the existence of the Great Attractor comes from the reconstructed galaxy/mass distribution. But the less than perfect match between the reconstructed mass density field and the observed galaxy distribution (Dekel 1994) has led to contradictory interpretations of the true nature and extent of the Great Attractor (Dressler 1988; Hudson 1993a, 1993b; Jahoda & Mushotzky 1989; Rowan-Robinson et al. 1990; Lynden-Bell 1991).
The Observed Galaxy Distribution in the GA Region.
Dedicated deep multiwavelength surveys – optical, near infrared (NIR), far infrared (FIR), H I, X-ray – were initiated, to search for a galaxy excess associated with the Great Attractor. For detailed information about galaxy searches in the GA region at wavelengths other than the optical, see the contributions by Schröder et al. (NIR), Saunders et al. (FIR), Staveley-Smith et al. (H I), Böhringer et al. (X-ray) and Ebeling et al. (X-ray) in these proceedings. Many of these searches are complementary in the galaxy population they trace. An overview of the advantages and limitations of each of these methods is given by Woudt (1998).
2.1. A Deep Optical Galaxy Search in the GA Region.
For many years, we have been involved in a deep optical galaxy search behind the southern Milky Way (Kraan-Korteweg 1989; Kraan-Korteweg 2000; Fairall, these proceedings). Here, we report on results in the Crux and Great Attractor region (Kraan-Korteweg & Woudt 1994; Woudt 1998). This galaxy survey was made on the IIIaJ film copies of the SRC Sky Survey. It has a diameter limit of . In the Crux and Great Attractor region ( and ), 8182 galaxies have been identified (Woudt 1998). Only 2.3% were catalogued before (Lauberts 1982). Our ZOA survey is complete for all galaxies with an extinction-corrected diameter , down to extinction levels of (Woudt 1998; Kraan-Korteweg 2000, Kraan-Korteweg, these proceedings).
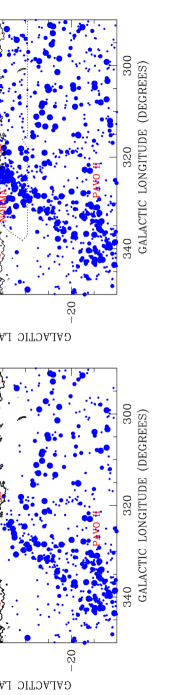
The left panel in Fig. 1 shows the distribution of Lauberts (1982) galaxies in the general direction of the Great Attractor. The galaxies are diameter-coded. Only galaxies with an observed diameter larger than – the completeness limit of the Lauberts catalogue (Hudson and Lynden-Bell 1991) – are included. The influence of the Galactic foreground extinction is obvious, the Lauberts catalogue is at best complete down to though probably incomplete already between (where ) for galaxies with .
In the right panel of Fig. 1, all the Laubert galaxies have been corrected – following Cameron (1990) – for the obscuring effects of the Galactic extinction using the DIRBE/IRAS extinctions (Schlegel, Finkbeiner, & Davis 1998). Only the galaxies with an extinction-corrected diameter () larger than are plotted. This diagram also includes the galaxies from our deep optical galaxy search which have . The galaxies below our completeness limit (at , the outer thick contour in Fig. 1) are shown, but they are not diameter-corrected. The diameter corrections (Cameron 1990) become somewhat uncertain at those extinction levels. The right panel of Fig. 1 shows a significant excess of galaxies north of the Galactic Plane, at and , that went unnoticed before (left panel). The highest concentration of galaxies in our entire deep optical galaxy search is centred on ACO 3627 (Abell, Corwin, & Olowin 1989), the Norma cluster, at = . This cluster lies within of the predicted centre of the Great Attractor (Kolatt et al. 1995). The richness of this centrally condensed cluster had not been remarked because of the diminishing effects of the Galactic foreground extinction.
Our ZOA survey shows that the Great Attractor region is overdense in galaxies down to very low Galactic latitude, with further prospective (super-) cluster members still hidden behind the remaining optical ZOA of (but see Staveley-Smith et al., these proceedings).
3. The Results of our ZOA Redshift Survey
A redshift coverage of the nearby galaxy population in the ZOA is essential for the determination of the peculiar velocity of the Local Group and for the mapping of the velocity flow field. With our redshift survey we have aimed to obtain a fairly homogeneous and complete coverage of the brighter and larger galaxies found by our deep optical survey. Three distinctly different observational approaches were used: 1. optical spectroscopy for individual early-type galaxies (Kraan-Korteweg, Fairall, & Balkowski 1995; Fairall, Woudt, & Kraan-Korteweg 1998; Woudt, Kraan-Korteweg, & Fairall 1999), 2. low resolution, multi-fibre spectroscopy for the high-density regions (see Felenbok et al. 1997, Woudt 1998), and 3. H I line spectroscopy for spiral galaxies (Kraan-Korteweg, Woudt, & Henning 1997).
For 1211 galaxies – about 15% of the optically detected galaxies in the Crux and Great Attractor region – a reliable redshift has now been recorded. In this part of the sky, 134 redshifts were known previously. Voids, clusters and superclusters can now be clearly identified in the Zone of Avoidance.
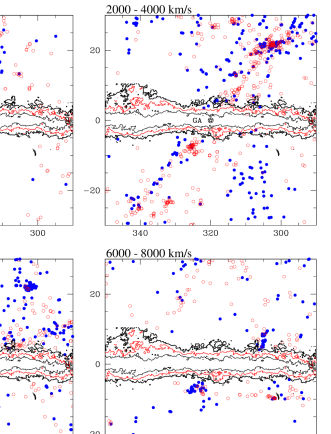
Figure 2 shows the distribution of galaxies in redshift-space (0 – 8000 km s-1) centred on the Great Attractor. In the first slice (0 – 2000 km s-1), the Supergalactic Plane is running nearly vertically across the diagram from , to , . In the second slice ( km s-1), the new data reinforce the presence of a narrow filamentary structure running all the way from , to the Centaurus cluster at , . This is believed to be part of a Great Wall-like structure seen edge-on, the Centaurus Wall (Fairall et al. 1998). The new observations fill in a significant part of this feature. Next to the Centaurus Wall, a broad band of galaxies runs nearly vertically across the GP (at ) towards an overdensity of galaxies at , . This extended filament is located between the Centaurus Wall and the Hydra–Antlia supercluster. It is not clear at this stage, if this overdensity is part of the Centaurus Wall. At the location of ACO 3627 (the Norma cluster), a concentration of galaxies is evident, but this is due to the low velocity tail of the cluster with its large velocity dispersion (848 km s-1; Woudt 1998).
The Norma cluster at () = ( km s-1) becomes very pronounced in the third redshift slice ( km s-1), where it is the dominant feature in this part of the sky. This redshift slice corresponds to the redshift-distance of the Great Attractor overdensity, i.e. km s-1 (Lynden-Bell et al. 1988; Kolatt et al. 1995). This slice also corresponds to the strong single peak seen in the velocity histogram of the GA region and of part of the broad peak seen in the Crux region (Woudt 1998). The new data – with the galaxies around the Pavo II cluster (, ) adjacent to the survey – suggest a large-scale structure that runs more or less horizontally across the diagram (Woudt 1998). This new broad feature will hereafter be referred to as the “Norma supercluster”. Traces can also be seen in the following slice, so the structure is probably also wall-like, seen roughly side-on. Its width (or depth in Fig. 2) is some 3000 km s-1 and its thickness several hunderd km s-1. Bearing in mind its greater distance compared to the Centaurus Wall mentioned above, this new structure must be similarly massive. It also covers a smaller cluster/group of galaxies around at km s-1 (Fairall et al. 1998). Both this Centaurus–Crux cluster, and the Vela overdensity ( km s-1; Kraan-Korteweg & Woudt 1993) probably form part of the Norma supercluster. The Norma cluster itself is situated where these two massive structures – the Centaurus Wall and the Norma supercluster – intersect.
One cannot exclude the possibility that another (Coma-like) rich galaxy cluster is still hidden in the GA region behind the remaining optical ZOA. At these higher extinction levels galaxies are optically invisible. But the central galaxy of a rich cluster is likely to be a strong radio continuum source, hence observable. Exactly such an object, PKS 1343601, lies in the GA region at () = ( km s-1, 12m; West & Tarengi 1989; Woudt 1998; Kraan-Korteweg & Woudt 1999). There are various indications that this radio galaxy indeed marks the position of a rich cluster (see Kraan-Korteweg & Woudt 1999). Finding another rich cluster in the GA region would have serious implications for our understanding of this massive overdensity.
4. Measuring Peculiar Motions of Galaxies in the ZOA
The Norma cluster can be used to address some of the remaining outstanding issues with regard to the nature and extent of the Great Attractor. Is the cluster located at the bottom of the potential well of the Great Attractor? Is the Great Attractor a relatively nearby overdensity at 3000 km s-1 as suggested by Tonry et al. (2000), or is it more distant at 4500 km s-1 (e.g. Kolatt et al. 1995). Does the Great Attractor itself partake in a flow on even larger scales?
In order to address these questions, peculiar motions of galaxies behind the Milky Way are needed. Reliable peculiar motions of ZOA galaxies are not easy to obtain, the problems are severe and need careful consideration (McCall & Armour, these proceedings). Uncertainties in the Galactic foreground extinction (Hudson 1999), the correction of observed parameters (isophotal diameters, magnitudes) (Cameron 1990), the effect of star-crowding on the photometry of partially obscured galaxies (Buta & McCall 1999) could result in large systematic uncertainties in the measured peculiar velocity of ZOA galaxies.
The Galactic Foreground Extinction.
The DIRBE/IRAS reddening maps provide an accurate measure of the Galactic foreground extinction (Schlegel et al. 1998), and are a significant improvement over the reddening estimates derived from the Galactic neutral hydrogen column density maps, especially in the Great Attractor region where large variations in the H I gas-to-dust ratio are suspected (Burstein et al. 1987). However, the accuracy of the DIRBE/IRAS maps at very low Galactic latitudes () still has to be established, as they are only calibrated by reddening measurements away from the Galactic Plane (Schlegel et al. 1998). A pilot study by Woudt (1998), using 18 elliptical/lenticular galaxies in the ZOA and the colour-Mg2 relation (Bender, Burstein, & Faber 1993), has shown that the DIRBE/IRAS maps provide a good estimate of the Galactic extinction in the ZOA, at least down to mag. This pilot study is currently extended to cover the entire southern Milky Way and a larger range of Galactic reddening values. It will allow a calibration for the DIRBE/IRAS maps at low Galactic latitudes.
The Peculiar Motion of ACO 3627.
Given its nature as a rich cluster and its unique location at the centre of the GA, the Norma cluster is the prime target to start and explore these uncertainties. The first attempt in deriving a peculiar velocity of the Norma cluster (Mould et al. 1991) has been unsuccesful but illustrates the difficulties involved. An unrealistically large peculiar motion of 1760 355 km s-1 was derived from 7 galaxies in the Norma cluster, using the -band Tully-Fisher relation. Following a detailed dynamical analysis of the Norma cluster, Woudt (1998) has shown that the former result was strongly biased because galaxies from an infalling spiral-rich subgroup were included (3 of the 7 selected galaxies). Even if the Galactic foreground extinction is accurately known, the complexity of the Norma cluster does not allow an accurate distance determination based on 7 galaxies alone.
By using a sample of 50 elliptical and lenticular galaxies within the inner part of the Norma cluster and the and Fundamental Plane analysis (Pahre, Djorgovski, & de Carvalho 1998; Mobasher et al. 1999) an accurate distance measurement (3% accuracy, or 150 km s-1 at the distance of the Norma cluster) can be obtained. Moreover, the colours of these galaxies, combined with their Mg2 indices, will provide an accurate measure of the extinction (Bender et al. 1993) independent of the assumed reddening law. High signal-to-noise spectra have already been obtained, as well as deep -band photometry of the entire Norma cluster within its Abell radius. -band photometry will be obtained with the NTT during 4 nights in June 2000. These data will allow us to distinguish in a quantitative way between the various existing models of the Great Attractor.
5. The Great Attractor Unveiled?
Our view of the Great Attractor has been severely obscured by the Milky Way. The here reported deep optical galaxy search has revealed a large fraction of the GA that was previously hidden by the Galaxy. This was done by the simple means of eye-balling the IIIaJ film copies. An optical ZOA remains (). There studies in the near-infrared and at 21-cm can trace the GA across the deepest layers of the Galactic extinction.
The emerging optical picture of the Great Attractor is that of a confluence of superclusters (the Centaurus Wall and the Norma supercluster) with the Norma cluster being the most likely candidate for the Great Attractor’s previously unseen centre. However, the potential well of the GA might be rather shallow and extended, and another (highly obscured) rich cluster around the strong radio-source PKS1343601 could also be located at the bottom of the GA’s potential well.
Acknowledgments.
We kindly acknowledge Drs. A.P. Fairall, C. Balkowski, V. Cayatte and P.A. Henning for their collaborational efforts in the ZOA redshift survey.
References
Abell, G.O., Corwin, H.G., & Olowin, R.P. 1989, ApJS, 70, 1
Bender, R., Burstein, D., & Faber, S.M. 1993, ApJ, 411, 153
Bertschinger, E., & Dekel, A. 1989, ApJ, 336, 5
Bistolas, V. 1998, Ph.D. thesis, Hebrew Univ. Jerusalem
Burstein, D., Davies, R.L., Dressler, A., et al. 1987, ApJS, 64, 601
Buta, R.J., & McCall, M.L. 1999, ApJS, 124, 33
Cameron, L.M. 1990, A&A, 233, 16
Dekel, A. 1994, ARA&A, 32 371
Dressler, A. 1988, ApJ, 329, 519
Fairall, A.P., Woudt, P.A., & Kraan-Korteweg, R.C. 1998, A&AS, 127, 463
Felenbok, P., Guérin, J., Fernandez, et al. 1997, Experimental Ast. 7, 65
Hudson, M.J. 1993a, MNRAS, 265, 43
Hudson, M.J. 1993b, MNRAS, 265, 72
Hudson, M.J. 1999, PASP, 111, 57
Hudson, M.J., & Lynden-Bell, D. 1991, MNRAS, 252, 219
Jahoda, K., & Mushotzky, R.F. 1989, ApJ, 346, 638
Kolatt, T., Dekel, A., & Lahav, O. 1995, MNRAS, 275, 797
Kraan-Korteweg, R.C. 1989, in Reviews in Modern Astronomy 2, ed. G. Klare, (Berlin: Springer), 119
Kraan-Korteweg, R.C. 2000, A&AS, 141, 123
Kraan-Korteweg, R.C., & Lahav, O. 2000, A&ARv, in press (astro-ph/0005501)
Kraan-Korteweg, R.C. & Woudt, P.A. 1993, in 9th IAP Astrophysics Meeting on “Cosmic Velocity Fields”, eds. F. Bouchet and M. Lachièze-Rey, Editions Frontières, Gif-sur-Yvette, 557
Kraan-Korteweg, R.C., & Woudt, P.A. 1994, in ASP Conf. Ser. 67, Unveiling Large-Scale Structures Behind the Milky Way, eds. C. Balkowski & R.C. Kraan-Korteweg, (San Francisco: ASP), 89
Kraan-Korteweg, R.C., & Woudt, P.A. 1999, PASA, 16, 53
Kraan-Korteweg, R.C., Fairall, A.P., & Balkowski, C. 1995, A&A, 297, 617
Kraan-Korteweg, R.C., Woudt, P.A., & Henning, P.A. 1997, PASA 14, 15
Kraan-Korteweg, R.C., Woudt, P.A., Cayatte, V., et al. 1996, Nature, 379, 519
Lauberts, A. 1982, The ESO/Uppsala Survey of the ESO (B) Atlas, (Garching: ESO)
Lynden-Bell, D. 1991, in “Observational Test of Cosmological Inflation”, eds. T. Shanks et al., (Dordrecht: Kluwer), 337
Lynden-Bell, D., Faber, S.M., Burstein, D., et al. 1988, ApJ, 326, 19
Mobasher, B., Guzman, R., Aragon-Salamanca, A., et al. 1999, MNRAS, 304, 225
Mould, J.R., Staveley-Smith, L., Schommer, R.A., et al. 1991, ApJ, 383, 467
Pahre, M.A., Djorgovski, S.G., & de Carvalho, R.R. 1998, AJ, 116, 1591
Rowan-Robinson, M., Lawrence, A., Saunders, W., et al. 1990, MNRAS, 247, 1
Schlegel, D.J., Finkbeiner, D.P., & Davis, M. 1998, ApJ, 500, 525
Sigad, Y., Eldar, A., Dekel, A., et al. 1998, ApJ, 495, 516
Tonry, J.L., Blakeslee, J.P., Ajhar, E.A., et al. 2000, ApJ, 530, 625
Webster, M., Lahav, O., & Fisher, K. 1997, MNRAS, 287, 425
West, R. M., & Tarenghi, R. M. 1989, A&A, 223, 61
Woudt, P.A. 1998, Ph.D. thesis, Univ. of Cape Town
Woudt, P.A., Kraan-Korteweg, R.C., & Fairall, A.P. 1999, A&A, 352, 39