On the Integrated Spectrum of the X-ray Binaries and the Origin of Soft X-ray Emission from the Bulge of M31
Abstract
Using ROSAT PSPC data, we have performed several tests aimed at understanding the origin of the soft X-ray spectral component detected from the bulge of M31. We find that a significant soft component in the spectrum of the bulge is spatially correlated with the unresolved X-ray emission near the core of M31, which is probably a hot interstellar medium or perhaps a population of multiple faint sources. For the first time, we extracted the spectrum of this unresolved emission, by removing point sources dominating the integral spectrum of the bulge, and found it to be responsible for the most of soft excess. A soft spectral component is not at all needed to fit the point source spectrum that remains after subtracting the unresolved emission. The integral spectra of bright point sources, both inside and outside of the M31 bulge, can be fitted with a single power-law in the ROSAT band. Our analysis rules out the previous suggestion that all bulge emission in M31 may be generated by low mass X-ray binaries (Irwin & Bregman, 1999).
1 INTRODUCTION
M31, the Andromeda Galaxy, is the closest spiral galaxy and belongs to the same morphological type as the Milky Way. It provides us with a sample of X-ray sources at a uniform and relatively nearby range of 800 kpc (Stanek & Garnavich (1998)). Galactic absorption in the direction of M31 is rather low (Stark et al. (1992)), allowing the study of soft X-ray emission down to about 0.2 keV, which is not possible for the sources in the bulge or Galactic plane of our own Galaxy.
Observations with the Einstein and ROSAT satellites revealed multiple point X-ray sources within M31, and also significant unresolved X-ray emission in the bulge (Trinchieri & Fabbiano (1991); Primini, Forman & Jones (1993); Supper et al. (1997), hereafter Su97). The origin of the unresolved emission remains unknown. The possibilities include interstellar hot gas, or multiple faint point sources (stars or X-ray binaries) below the detection limit. Recently Irwin & Bregman (1999), hereafter IB99, suggested that whole X-ray emission of the bulge can be attributed to low-mass X-ray binaries (LMXBs), which are commonly assumed to be responsible for the hard (above several keV) X-ray emission of the X-ray faint early-type galaxies. Whether the same population of LMXBs might also be the origin for a significant very soft excess detected with Einstein and ROSAT in several X-ray faint early-type galaxies (e.g. Kim, Fabbiano & Trinchieri (1992); Pellegrini & Fabbiano (1994); Irwin, Sarazin & Bregman (2000)) remained, however, open and interesting question to explore.
In this letter we present results of our analysis of ROSAT PSPC data. We generated spatially resolved spectra of the bulge of M31 and for the first time extracted the spectrum of the unresolved X-ray emission. The results presented below demonstrate that the integrated spectrum of bright X-ray binaries is significantly harder than the spectrum of the unresolved emission in the bulge of M31.
2 OBSERVATIONS AND DATA REDUCTION
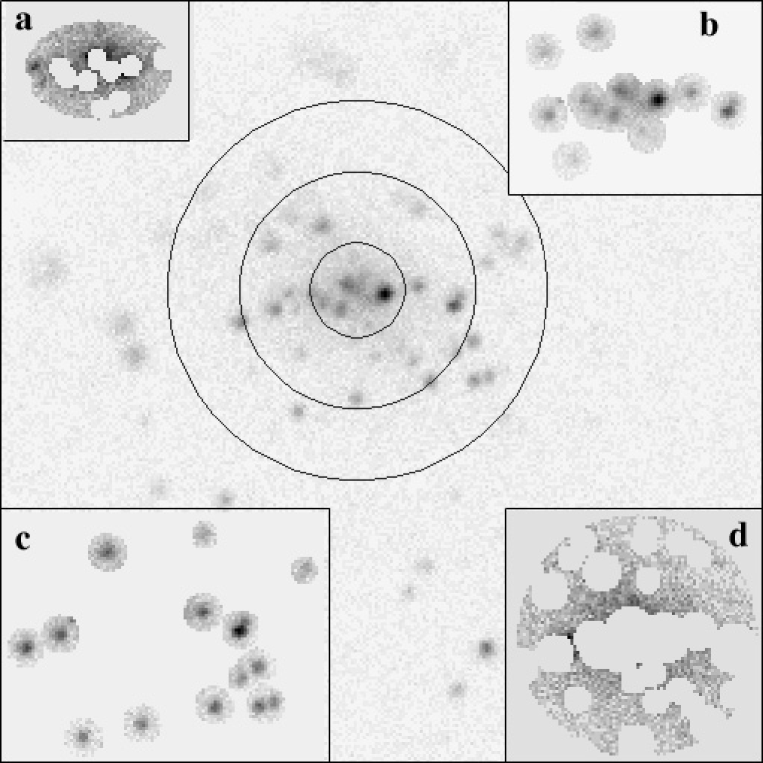
We analyzed the ROSAT PSPC observations discussed in detail by Su97. Descriptions of the instrument can be found in Aschenbach et al. (1981); Pfeffermann & Briel (1982), and Aschenbach (1988). We used all observations with a total exposure longer than 10,000 s that were taken before Oct 14, 1991111different response matrix must be used with data collected after this date, hence it is not possible to sum spectra together with previous observations. Most of our results were obtained from observation RP600068N00, when the central part of M31 was observed(Fig. 1). The angular resolution of ROSAT/PSPC does not allow a clean separation of point sources from the diffuse emission in the bulge of M31, because both are concentrated towards the center of the galaxy. However, we segregated these two components spatially as best as we could, collecting small regions around bright binaries into one spectrum, and photons from the areas without bright point-like sources into another. To identify point sources we used the ROSAT PSPC catalog published by Su97. To optimize the radius of photon collection for the point sources in the bulge, where diffuse emission is significant, we tried collection radii ranging from 30 to 60 arcsec for each source. As the radius increases we are collecting a great fraction of the source flux, but also the amount of diffuse contamination is increasing. We found that the choice of this radius does not change our conclusions described below. For X-ray binaries in the bulge, the typical radius was chosen to be 45 arcsec. Studying the integral spectrum of bright point sources outside of the bulge of M31, we collected all photons within 75 arcsec from each source.
We used only data within a central part of ROSAT’s field of view, that is inside the central ring of PSPC support grid with 20 arcmin radius. The background was measured in the same area of the detector, but outside of M31 bulge, in a region devoid of significant point sources and with much less unresolved emission than the bulge. The same background spectrum was used for all analyses of observation RP600068N00, both for bright point sources, and for unresolved emission, except when diffuse emission was subtracted from the point source spectrum as a background (as discussed below). We experimented with different background regions and found that our results do not depend on this choice. The spectral differences we discuss in this paper are much stronger than the expected background variations.
Various routines from the package (v.5.0) were used to generate spectra and other necessary files, which were then used for spectral fitting with (v.11.0) package. We ignored energy channels below 11 and above 219, and rebinned spectra so that each channel contained at least 25 counts.
3 SPECTRAL TEST RESULTS
Our choice of spectral model was based on recent spectral studies of M31 bulge reported by IB99 and Trinchieri et al. (1999), hereafter Tr99. Both studies revealed the presence of at least two spectral components in the integral spectrum of the bulge. The hard component was fitted with bremsstrahlung or power law model, while soft component - by a Raymond-Smith or MEKAL plasma emission model. We chose to use a power law for the hard component, mostly because the reported best-fit temperature of bremsstrahlung was well above the ROSAT upper energy limit. Unfortunately, ROSAT data cannot provide us with tight constraints for parameters of a two-component model. Table 1 presents several different combinations of parameters which all give reasonably good fits for the integrated spectrum of bulge emission, including all point sources and unresolved emission within inner 5 arcmin radius around the optical nucleus of M31 (see e.g. Crane, Dickel & Cowan (1992) for J2000 coordinates). The parameters of the fit are strongly correlated. There is the expected correlation between power law slope and absorption value, and also a correlation of the absorption with metallicity. The studies by IB99 and Tr99, which used ASCA and BeppoSAX data, also did not provide well-constrained fit parameters. The temperature parameter of soft component is 0.36–0.38 keV in IB99, but varies between 0.15 and 0.50 for the several fits presented by Tr99. Metallicity can be as low as 0.03 (IB99) or as high as 1 (fixed by Tr99). The power law slope from 1.2–1.3 (IB99) to 1.8–2.2 (Tr99), and absorption parameter from 4.4 1020 cm-2 (IB99) to 10–12 1020 cm-2 (Tr99). As one may see from Table 1, fraction of emission in the soft component depends strongly on fit parameters. Therefore, we need to freeze most of the parameters in order to track the relative contributions of the two components as a function of position.
For the most of our analysis we fixed the power law slope at 1.5, the absorption column at the Galactic value = 6.73 1020 cm-2 (Stark et al. (1992)), and the metallicity parameter at 0.03. This choice allowed us to get acceptable values of value in all cases, and study relative significance of hard and soft components for various regions in the bulge of M31. It does not imply, though, that these values have a real physical sense. As illustrated by Table 2, one might, for example, choose to fix the metallicity at solar value and get different fit parameters. However, our main conclusion regarding the difference between the spectra of bright point sources and the unresolved emission is not model-dependent.
Using the model described above, we looked at the spectrum of the integral bulge emission (including all point sources) at various distances from the M31 center (less than 2 arcmin, between 2 and 5 arcmin, and between 5 and 8 arcmin). The contribution from the soft component decreased with distance from the center, in correlation with the decrease of the diffuse intensity in the image. The soft component fraction falls from 0.62 to 0.50 and then to 0.37, as we move from the inner 2 arcmin to the outermost annulus (Table 2).
For the next stage of our analysis, we separated bright point sources from unresolved emission. Overall approach was to draw small circular regions around each point source listed in Su97. Then we integrated these regions into one spectrum (‘XRBs’), and integrated the rest of the area into a second spectrum (‘diffuse’). Admittedly, we cannot separate point sources and unresolved emission near the core completely by this method, because the density of unresolved emission is maximal near the core of M31, where the concentration of point sources is also maximal, however, relative contribution of both kinds of sources is different in spectra of those two types. In Table 2 we present two spectra for each type, which differ by the area where the emission was collected. We tried to collect unresolved emission from the area where its density corresponds to average density of the same emission around bright sources. This allowed us to subtract ‘diffuse’ spectra from ‘XRBs’ spectra in an attempt to get ‘clean’ spectrum of point sources.
XRBs and diffuse emission near the core. For these spectra we extracted X-ray photons from the area near the center of M31, where the brightest point sources are concentrated and the density of diffuse emission is maximal. The separation of two types of progenitors is especially challenging in this area. 14 bright point sources from Su97 catalog, which are located within 6 x 8 arcmin ellipse around the center of M31 (see Inset b of Fig. 1), formed XRBs spectrum. Unresolved emission was collected over the ellipse 4 x 6 arcmin, but circles of 45 arcsec diameter around each catalogued source were excluded (Inset a of Fig. 1). For ‘XRBs near the core’ the contribution of soft component is large (0.48), but significantly lower than for the total emission from the same region (0.62). The soft component dominates the spectrum of unresolved emission collected in this area (0.8). If ‘diffuse near the core’ spectrum, normalized for area, is subtracted from ‘XRBs near the core’, then soft component is no longer significant in residual spectrum. In another analysis we fixed the metallicity parameter at 1. While, as expected, the absolute values of soft component fraction differ significantly for the different metallicity, soft component still contributes significantly more (0.47) to the spectrum of the unresolved emission than to the spectrum of ‘XRBs’ (0.22). The difference in the spectra illustrated by Fig. 2 does not depend on our choice of model parameters – it is easily seen in the distribution of counts over the spectral band.
XRBs and diffuse emission in the bulge. Here, we summed the spectra of point sources and collected an unresolved emission from a larger area, where they are more easily separable. The spectra of 14 bright sources that lie within 8 arcmin from the center, but outside of central 2 arcmin, were integrated into ‘XRBs in the bulge’(Inset c of Fig. 1). Unresolved emission was collected from inner 5 arcmin, less 45 arcsec radii around all point sources listed in Su97 (see Inset d of Fig. 1). Soft component is much stronger in the spectrum of unresolved emission (80% of total flux), than in the spectrum of ‘XRBs’ (20% of total flux, not detected when spectrum of diffuse emission is subtracted).
We see that while all spectra can be satisfactorily fitted by the same model, the relative contribution of hard and soft component are significantly different for point sources and unresolved emission. Because we see the difference even with PSPC data which are seriously confused in this region, we expect that the difference would be even stronger if we obtained clean, well spatially resolved spectra. Furthermore, it motivates us to suggest that hard component in the bulge spectrum is generated by X-ray binaries of the bulge, while the soft component originates from a diffuse source of different nature. This suggestion can be checked with data coming from Chandra and XMM-Newton instruments.
Additionally we analyzed the integrated spectrum of other X-ray binaries in M31. In this case we added together spectra of all bright point objects located outside of central 8 arcminutes. We did not add spectra of the sources marked as foreground stars or background galaxies in Su97. Altogether 61 bright point sources were added together to the spectrum labeled as ‘XRBs in the disk’ in Table 2. The integrated spectrum can be fit by single power-law component with a slope around 1.4 and absorption slightly higher than the Galactic value (Fig. 2). No evidence for soft component was found. This spectrum is very close to the spectrum of ‘XRBs in the bulge’ with diffuse emission subtracted. We need to note that all spectra labeled as ‘XRBs’ in Table 2 include all bright compact sources in M31 and does not exclude supernova remnants or globular clusters. We suggest that a single power-law spectrum in ROSAT energy band is a more suitable template for the population of bright compact X-ray emitters, than the spectrum of M31 bulge, which includes a significant soft component.
4 DISCUSSION
Our spatially resolved spectral analysis revealed a qualitative difference between the unresolved emission and the bright point sources in the bulge of M31. We have performed several tests and that gave consistent results. We found that soft component is much more prominent in the spectrum of unresolved emission than in the integral spectrum of bright point sources (presumably LMXBs).
Previous studies were based on the spectrum of integral X-ray emission from the bulge, in comparison with spectra for individual sources. IB99 argued that LMXBs may be responsible for both hard and soft X-ray components in the spectrum of the M31 bulge. They suggested furthermore that unresolved emission in the bulge is composed of the same LMXBs and has the same energy spectrum. Our analysis shows conclusively that this is not the case. The spectrum of the unresolved emission is significantly different and hence it must be dominated by the sources of a different nature. These sources are responsible for most of soft excess observed from M31. We cannot rule out the possibility that LMXBs generate some of the soft component, but the contribution of this component to their spectra is lower than in the unresolved emission. The nature of the unresolved emission remains unclear, however, we believe that the observation of an extended radio source of a similar size at the same position in M31 (Hjellming & Smarr (1982)) supports an interstellar gas hypothesis. The reality of diffuse emission in M31 is, in a sense, not a surprise - in our own Galaxy, we have long known of diffuse emission from the Galactic plane down to 3 keV (Valinia & Marshall 1998, Kaneda et al. 1999, and references therein). Although our measurements of M31 did not extend to these energies, and the soft component that we detected would be hidden by absorption in our own Galaxy, the Galactic measurements give evidence for thermal emission from a perhaps hotter phase of the interstellar medium.
Our study suggests that the resolved bright sources in the bulge of M31 may not be responsible for any of the soft X-ray excess in the spectrum. In this case, their integral spectrum strongly resembles the bright X-ray sources outside of the M31 bulge. This looks surprising because it is commonly accepted that disk and bulge sources belong to different populations of X-ray binaries. It may appear, however, that LMXBs cannot be distinguished from high-mass X-ray binaries solely on the basis of their X-ray spectra in ROSAT band. After all, the compact objects in both types of binaries are of the same nature.
Our conclusion that the soft spectral component mainly emerges from the unresolved emission does not depend on a quantitative deconvolution of the bulge spectrum. This is important, because the exact fraction in the soft component depends strongly on the spectral model parameters, and cannot be well evaluated with existing data. Our poor state of knowledge is reflected by the difference between Tr99 ( 15% soft fraction) and IB99 (38% or more). The fraction of the total bulge emission from point sources is also unclear. Trinchieri and Fabbiano (1991) found that 75% of the bulge emission was resolved into 46 point sources, but Primini et al. (1003) estimated that 45 point sources accounted for only 58% of the emission from the inner 5’, with the rest unresolved. With these uncertainties, it is difficult to determine the fraction of soft emission that comes from LMXBs based on integrated spectra, motivating our spatially-resolved analysis. New data from XMM-Newton and Chandra promises to clarify the picture.
The interpretation of our results goes far beyond the case of M31, because this galaxy, due to its proximity, often serves as a testbed for other early-type galaxies (see e.g. Irwin & Sarazin, 1998). The X-ray spectra of many X-ray-faint galaxies had been found to be the sum of a hard component and a very soft component, similar to the spectrum of the M31 bulge. Our analysis suggests that this soft component comes mostly from a hot interstellar gas, or some unknown population of faint, soft X-ray sources, but not from LMXBs.
5 ACKNOWLEDGMENTS
The ROSAT public data were extracted from the HEASARC electronic archive operated by the Goddard Space Flight Center (NASA). The authors are thankful to an anonymous referee and to J.Irwin for useful comments. KB is glad to acknowledge helpful discussion of the draft by M.Revnivtsev and A.Vikhlinin.
References
- Aschenbach (1988) Aschenbach, B. 1988, App.Opt., 27, 1404
- Aschenbach et al. (1981) Aschenbach, B., Braeuninger, H., Briel, U., Brinkmann, W., Fink, H., Heinecke, N., Hippmann, H., Kettenring, G., Metzner, G., Ondrusch, A. 1981, Space Sci.Rev., 30, 569
- Crane, Dickel & Cowan (1992) Crane, P. C., Dickel, J. R., & Cowan, J. J. 1992, ApJ, 390, L9
- Hjellming & Smarr (1982) Hjellming, R. M., & Smarr, L. L. 1982, ApJ, 257, L13
- Irwin & Bregman (1999) Irwin, J. A., & Bregman, J. N. 1999, ApJ, 527, 125 (IB99)
- Irwin & Sarazin (1998) Irwin, J. A., & Sarazin, C. L. 1998, ApJ, 499, 650
- Irwin, Sarazin & Bregman (2000) Irwin, J. A., Sarazin, C. L., & Bregman J. N. 2000, ApJ accepted (preprint astro-ph/0007408)
- Kaneda et al. (1999) Kaneda, H., Makishima, K., Yamauchi, S., Sugizaki, M., Yamasaki, N. Y. 1999, Astronomische Nachrichten, 320, 322
- Kim, Fabbiano & Trinchieri (1992) Kim, D.-W., Fabbiano, G., & Trinchieri, G. 1992, ApJ, 393, 134
- Pellegrini & Fabbiano (1994) Pellegrini, S., & Fabbiano, G. 1994, ApJ, 429, 105
- Pfeffermann & Briel (1982) Pfeffermann, E., Briel, U. 1982, AdSpR, 2, 255
- Primini, Forman & Jones (1993) Primini, F. A., Forman, W., & Jones, C. 1993, ApJ, 410, 615
- Stanek & Garnavich (1998) Stanek, K. Z., & Garnavich, P. M. 1998, ApJ, 503, L131
- Stark et al. (1992) Stark, A. A., Gammie, C. F., Wilson, R. W., Bally, J., Linke, R. A., Heiles, C., & Hurwitz, M. 1992, ApJS, 79, 77
- Supper et al. (1997) Supper, R., Hasinger, G., Pietsch, W., Truemper, J., Jain, A., Magnier, E. A., Lewin, W. H. G., van Paradijs, J. 1997, A&A, 317, 328 (Su97)
- Trinchieri & Fabbiano (1991) Trinchieri, G., & Fabbiano, G. 1991, ApJ, 382, 82
- Trinchieri et al. (1999) Trinchieri, G., Israel, G. L., Chiappetti, L., Belloni, T., Stella, L., Primini, F., Fabbiano, P., Pietsch, W. 1999, A&A, 348, 43 (Tr99)
- Valinia & Marshall (1998) Valinia, A., Marshall, F. E. 1998, ApJ, 505, 134
| , keV | , cm-2 | (d.o.f.) | R | ||
|---|---|---|---|---|---|
| 1.0(fixed) | 0.37 | 0.022 | 6.73(fixed) | 1.24 (192) | 0.69 |
| 1.0(fixed) | 0.37 | 0.032 | 6.06 | 1.19 (191) | 0.66 |
| 1.5(fixed) | 0.33 | 0.029 | 6.73(fixed) | 1.25 (192) | 0.56 |
| 1.5(fixed) | 0.30 | 0.69 | 4.38 | 1.21 (191) | 0.33 |
| 2.0(fixed) | 0.32 | 0.067 | 6.73(fixed) | 1.28 (192) | 0.31 |
| 2.0(fixed) | 0.31 | 0.88 | 5.84 | 1.18 (191) | 0.20 |
a – fraction of soft component in total unabsorbed model flux in 0.2-2.0 keV band
| region | , keV | (d.o.f.) | |||||
|---|---|---|---|---|---|---|---|
| inner 2 arcmin | 1.5(fixed) | 0.350.02 | 0.03(fixed) | 6.73(fixed) | 1.21 (172) | 10.6 | 0.610.03 |
| ellipse 6x8 arcmin | 1.5(fixed) | 0.320.02 | 0.03(fixed) | 6.73(fixed) | 1.25 (184) | 16.3 | 0.620.03 |
| 2-5 arcmin ring | 1.5(fixed) | 0.320.02 | 0.03(fixed) | 6.73(fixed) | 1.08 (180) | 10.5 | 0.500.02 |
| 5-8 arcmin ring | 1.5(fixed) | 0.32(fixed) | 0.03(fixed) | 6.73(fixed) | 1.06 (166) | 4.40 | 0.370.05 |
| XRBs near the core | 1.5(fixed) | 0.32(fixed) | 0.03(fixed) | 6.73(fixed) | 1.00 (186) | 14.1 | 0.480.02 |
| 1.8 0.2 | 0.300.03 | 1.0(fixed) | 5.870.55 | 0.89 (183) | 12.0 | 0.220.04 | |
| XRBs near the cored | 1.490.07 | - | - | 6.73(fixed) | 0.62 (186) | 5.28 | 0. |
| XRBs in the bulge | 1.5(fixed) | 0.32(fixed) | 0.03(fixed) | 6.73(fixed) | 1.17 (176) | 6.65 | 0.190.04 |
| XRBs in the bulged | 1.310.05 | - | - | 6.73(fixed) | 1.14 (176) | 4.36 | 0.0 |
| XRBs in the disk | 1.430.04 | - | - | 7.3 0.4 | 1.29 (86) | 2.18 | 0.0 |
| diffuse near the core | 1.5(fixed) | 0.310.01 | 0.03(fixed) | 6.73(fixed) | 1.06 (141) | 5.76 | 0.770.03 |
| 1.80.35 | 0.280.02 | 1.0(fixed) | 4.6 1.0 | 0.93 (139) | 5.76 | 0.470.07 | |
| diffuse in the bulge | 1.5(fixed) | 0.310.02 | 0.03(fixed) | 6.73(fixed) | 1.25 (129) | 3.98 | 0.800.05 |
a – in units of cm-2
b – total unabsorbed model flux in 0.2-2 keV band, in units of
ergs s-1 cm-2
c – fraction of soft component in total unabsorbed model flux
in 0.2-2 keV band
d – in this case the spectrum of diffuse emission
has been taken as a background