FUSE Observations of the Active Cool Star AB Doradus
Abstract
Far ultraviolet spectra were obtained of the active cool star AB Doradus (HD 36705) during the calibration and checkout period of the FUSE satellite. Observations in this early phase of the mission were taken at a resolving power of 12000–15000 (20–25 km s-1) and covered the spectral range 905–1187Å. The integrated spectrum exhibits strong, rotationally broadened stellar emission from C iii (977, 1175) and O vi (1032, 1037), and many weaker lines. Strong emission lines of C iii and O vi exhibit broad wings. The C iii 977 profile shows blue-shifted absorption at 30 km s-1and C ii 1036 absorption appears superposed on emission in the wing of O vi 1037. Rotational modulation of C iii and O vi is present, in harmony with its photometric variability. Flares were detected in the brightest lines and subexposures were analyzed to examine flux and profile variations. Downflows that extend to 600 km s-1 during a flare are found in the O vi profiles. These early observations demonstrate that FUSE will be an exceptional instrument for studying chromospheres in cool stars.
1 June 2000
1 Observations and Data Analysis

AB Doradus is a nearby (15 pc), rapidly rotating (Prot = 12.4 hr, sin = 90 km s-1), K0–2 IV–V pre-main sequence star that exhibits high activity and frequent flaring (e.g., Collier Cameron et al. 1999; Schmitt, Cutispoto & Krautter 1998; Vilhu et al. 1998). It is the first cool star observed by the Far Ultraviolet Spectroscopic Explorer (FUSE, cf. Moos et al. 2000). Observations were obtained on 1999 October 20 and 22, in the LiF channels (987–1187), and on 1999 December 14, when exposures in all four channels were made covering the range 905–1187. Exposures were taken in time-tagged mode at 1 second resolution through the 3030′′ aperture and were scheduled when AB Dor was in the continuous viewing zone. Thus good coverage was obtained over most of its rotational period each day. The only interruptions were due to South Atlantic Anomaly crossings, when detector high voltage is reduced. The total exposure time amounted to 79 ks for the LiF channels and 24 ks for SiC, of which 33 ks and 13 ks respectively were obtained during orbital night. The spectral resolving power was 12000–15000 (20–25 km s-1) but the considerable oversampling improves the spectral purity.
Since the spectrographs were not fully focused, care was exercised when comparing lines from different channels. Data sets were reprocessed with the calibration pipeline as improvements became available. Both airglow and the scattered solar spectrum can contribute emission lines expected to be present in cool stars; thus spectra obtained from data taken during orbital night were examined and analyzed separately in regions where the contamination was significant. For time variability studies, subexposures were created from the photon lists and reprocessed individually.
Wavelength calibration errors especially near the ends of detector segments are still present. For AB Dor, the easily identifiable lines and airglow lines allowed for local adjustments of the scale, but identifications for weaker lines had to be confirmed through comparisons with solar disk spectra from SUMER (e.g., Curdt et al. 1997). The wavelength scale uncertainty precludes at present an analysis of possible differential motions between the lines.
2 Line Spectrum
The FUSE spectrum of AB Dor is shown in Figure 1. The strongest lines arise from C iii (977, 1175), O vi (1032, 1037) and airglow lines of H i, O i, N i, and N ii. Most of the latter can be distinguished from stellar components by screening out parts of the exposures taken in daylight as shown in Fig. 1. We can tentatively identify fainter lines due to H i, He ii, C i, C ii, N iii, Si iii, Si iv, S iii, S vi, and Fe iii, which will be discussed in a later paper. The lines are broadened by the high rotation rate of the star.
Profiles of chromospheric and transition region lines can provide clues to heating mechanisms and mass motions in cool stars. With a resolving power of 12000–15000, FUSE can be used to study thermal and non-thermal motions, which typically range from 15 to hundreds of km s-1 in these stars (e.g., Wood, Linsky, & Ayres 1997). Figure 2 shows the O vi doublet region in detail for the time-integrated LiF1A spectrum on October 22. The 1032 component is cleanly separated from other features in the spectrum and is symmetrical. A Gaussian profile broadened by 90 km s-1 rotation with no limb darkening can adequately reproduce the core of the line, but does not fit the wings. Schmitt et al. (1997) were able to measure the rotational broadening in O vi with ORFEUS, but could not adequately discern the broad wings. The low scattered light properties of FUSE (Sahnow et al., 2000) and the relatively modest FUV count rates for AB Dor make an instrumental source unlikely to explain the extended profile. Extra flux in the wings of Si iv and C iv lines has been observed in other active stars (Wood, Linsky, & Ayres, 1997), and the O vi observations of AB Dor extend this phenomenon to greater line-formation temperatures. Since telescope focus and spectrograph calibration had not been completed, there is some disagreement in the details of the line profiles between the FUSE channels. Considering all the data, we find a two-Gaussian fit composed of a narrow (FWHM km s-1) and broad (FWHM km s-1) component, the latter contributing 38–56% of the total line flux depending on the data set, reproduces the 1032 profile when rotationally and instrumentally broadened. These values are comparable to widths of 68 and 334 km s-1 determined for C iv in AB Dor from GHRS spectra (Vilhu et al., 1998). Wood, Linsky, & Ayres (1997) found broad components in a number of cool stars to be correlated with C iv and X-ray surface fluxes, and proposed that their origin is microflare heating. However extended material may occur frequently in rapidly rotating cool stars. Co-rotating prominence material or an extended chromosphere as Collier Cameron & Robinson (1989) have identified on AB Dor might cause similar broadening. Another rapidly rotating K dwarf, V471 Tau, exhibits material at 105K extending to 1 above the surface (Guinan et al., 1986).
The weaker member of the O vi doublet (1037.61) is blended with C ii emission (1036.34, 1037.02) in its blue wing. A strong C ii 1036 absorption feature is superposed on the emission, likely due to interstellar or circumstellar material. Except for the blue wing, the O vi 1037 line is well matched by the same Gaussian fit from 1032 when shifted by the difference in wavelengths and scaled by the doublet ratio.
C iii 977 differs from O vi by additional absorption appearing 30 km s-1 from line center and irregularities in the wings of the line profile (Figure 3). We have considered several possible origins for this, which cannot be resolved until a better wavelength scale is available. A similar asymmetric profile in C iii was found in the luminous cool star Dra from ORFEUS spectra where it was attributed to a wind (Dupree & Brickhouse, 1998). AB Dor frequently displays transient absorption features in the H profile (Collier Cameron et al., 1999), and the C iii absorption may be a high temperature manifestation of the behavior in H. Finally, the presence of the C ii 1036 absorption line suggests that the C iii absorption could also be interstellar or circumstellar in origin.
3 Electron Densities
We compute a ratio of the density sensitive C iii lines of, 1175/977 = 0.651 0.172 (in erg units), although the absolute and relative flux calibration of FUSE is still at an early stage. This ratio, when compared to the calculations of the CHIANTI code, suggest that the density at T80000 K is near the high density limit, namely cm-3, and similar to the values derived from ORFEUS spectra of AB Dor (Schmitt, Cutispoto, & Krautter, 1998). However the uncertain calibration and presence of absorption in the 977 line, potentially weakening the line and increasing the inferred density, suggests that caution must be used in applying this diagnostic.
4 UV Flares on AB Dor
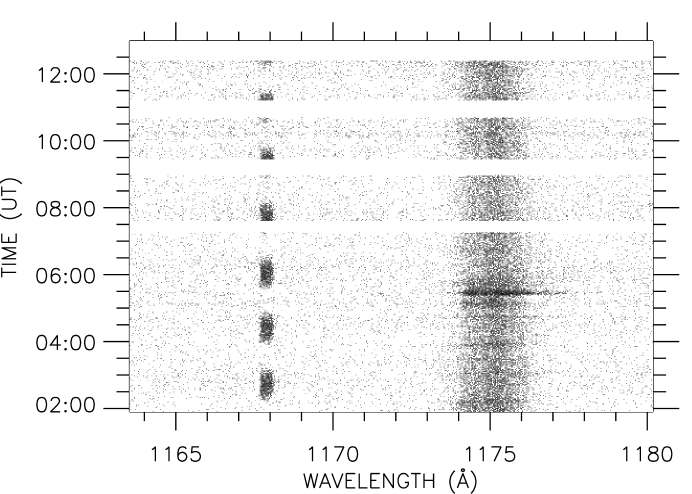
AB Dor undergoes frequent flaring, particularly in X rays; impulsive flares have also been detected in C iv (Vilhu et al., 1998). Several flares occurred during the FUSE observations; one was bright enough on 1999 October 22 to extract a spectrum in the strongest lines. Figure 4 shows a dynamic spectrum in the C iii 1175 region. Light curves for C iii 1175 and O vi show similar temporal behavior marking a short-duration (700 sec) flaring episode. The overall brightening of the 1175 line was accompanied by an enhanced red shifted component. Here care was taken in determining which features are stellar flares as distinguished from events bursts seen with the detector (Sahnow et al., 2000). Fig. 2 shows the spectrum of red shifted components in the O vi lines; the Doppler shift of a Gaussian fit to the flare component is centered at +235 km s-1, with extension to 600 km s-1. A flare in C iv observed by Vilhu et al. (1998) exhibited a broad blue-shifted Gaussian profile superposed on the quiescent profile and was attributed to evaporation of chromospheric material. Flares on AD Leo have shown high redshifts in C iv, amounting to 650 km s-1 with extensions to 1800 km s-1 (Bookbinder et al., 1992). Downward flowing flare material is a frequent occurrence in solar post-flare magnetic loops and could explain the profiles observed here.
5 Rotational Modulation
AB Dor undergoes optical and UV variations as active structures rotate through the line of sight. Maximum spottedness occurs at minimum light in V and U. In Figure 5, we show the variation of the strongest lines (C iii and O vi) on 1999 October 22, when AB Dor appears to have been most active, by dividing the FUSE observations into subexposures of 35 min apiece. Rotational phase is determined from the ephemeris of Innis et al. (1988): HJD = 2444296.575 + 0.51479 E. In this case, minimum light occurs at = 0.5. Photometry in 1999 December from Mt. Kent Observatory in Queensland confirms that AB Dor continues to be faint at =0.5 on this ephemeris, although coverage over the entire rotational period was not obtained.
A peak in the FUSE fluxes occurs near 0.6; this would be expected from enhanced high temperature activity due to star spots on the photosphere and overlying regions of activity. Comparable modulation amplitudes in C iii and O vi suggest the spatial distribution of the corona is similar between 80000 K and 2105 K where these lines are formed. Greater enhancement of C iii than O vi during the flare may be affected by the increased density enhancing the metastable level of C iii. The large flare on this date, however, occurs after the photometric minimum, near = 0.9 suggesting that it arose from an active region not associated with the maximal spot coverage.
Simultaneous ORFEUS and ROSAT observations are discussed by Schmitt, Cutispoto, & Krautter (1998), who found that FUV and X-ray variations are correlated but do not appear to be rotationally modulated, except at about the 15% level for X-ray emission. AB Dor is known to undergo night-to-night optical variations (Collier Cameron et al., 1999), so O vi rotational modulation could be a transient phenomenon dependent on the activity of the star. For the X-ray emission, either the coronal material is more homogeneously distributed than the lower temperature material or the activity is at higher latitudes, and hence, always visible. We note that Collier Cameron et al. (1999) find AB Dor has a stable polar cap of photospheric spots.
6 Conclusions
This first set of observations of a cool star demonstrates that FUSE can provide insight into a variety of phenomena on AB Dor. We have identified lines spanning more than a decade in line formation temperature that can be used to determine diagnostics in the far ultraviolet. Even though the instrument is not fully focused, the line profiles can be studied in detail, and we have begun examining the dynamics and heating processes in this star. Through time-resolved spectroscopy, we can study variability on different time scales, from seconds to days. Importantly, the redundant wavelength coverage from different channels provides high confidence in observed variations of features and structures.
References
- Bookbinder et al. (1992) Bookbinder, J., Walter, F., & Brown, A. 1992 in ASP Conf. Ser., 26, Cambridge Workshop on Cool Stars, Stellar Systems and the Sun, ed. M. S. Giampapa & J. A. Bookbinder (San Francisco:ASP), 27
- Collier Cameron & Robinson (1989) Collier Cameron, A., & Robinson, R. D. 1989, MNRAS, 236, 57
- Collier Cameron et al. (1999) Collier Cameron, A. et al. 1999, MNRAS, 308 493
- Curdt et al. (1997) Curdt, W., Feldman, U., Laming, J. M., Wilhelm, K., Schühle, U., & Lemaire, P. 1997, A&AS, 126, 281
- Dupree & Brickhouse (1998) Dupree, A. K., & Brickhouse, N. S. 1998, ApJ, 500, L33
- Guinan et al. (1986) Guinan, E. F., Wacker, S. W., Baliunas, S. L., Loeser, J. G., & Raymond, J. C. 1986, ESA SP-263, p. 197
- Innis et al. (1988) Innis, J. L., Thompson, K., Coates, D. W., & Lloyd Evans, T. 1988, MNRAS, 235, 1411
- Moos et al. (2000) Moos, H. W., et al. 2000, ApJ, this volume
- Sahnow et al. (2000) Sahnow, D. J., et al. 2000, ApJ, this volume
- Schmitt, Cutispoto, & Krautter (1998) Schmitt, J. H. M. M., Cutispoto, G., & Krautter, J. 1998, ApJ, 500, L25
- Schmitt et al. (1997) Schmitt, J. H. M. M., et al. 1997, A&A, 325, 249
- Vilhu et al. (1998) Vilhu, O., Muhli, P., Huovelin, J., Hakala, P., Rucinski, S. M., & Collier Cameron, A. 1998, AJ, 115, 1610
- Wood, Linsky, & Ayres (1997) Wood, B. E., Linsky, J. L., & Ayres, T. R. 1997, ApJ, 478, 745