Three high-redshift millimeter sources and their radio and near-infrared identifications
Abstract
We present millimeter wavelength detections of three faint sources that are most likely high-redshift starburst galaxies. For one of the sources, which was previously discovered with SCUBA at 850 m, we present a detection with the IRAM interferometer at 240 GHz (1.25 mm) that shows the object unresolved at an angular resolution of , and coincident within 1′′ with a radio source and a galaxy detected in the near-infrared. The two other sources were discovered in a deep 250 GHz (1.2 mm) survey with the Max-Planck Millimeter Bolometer (MAMBO) array at the IRAM 30 m telescope. Both have fluxes of mJy and radio counterparts with a 1.4 GHz flux density of Jy. Their radio–to–mm flux ratios suggest redshifts larger than 2. Both sources are faint in the optical and near-infrared, one showing a 20.5 mag -band counterpart. From our data and that available in the literature, we estimate the redshift distribution of twenty-two faint mm and sub-mm sources and conclude that the majority of them are likely to be at .
Key Words.:
Cosmology: observations — radio continuum: galaxies — infrared: galaxies — galaxies: distances and redshifts, starburst, evolution — mm continuum: galaxies1 Introduction
Recent determinations of the sky surface density of faint sub-millimeter sources have revolutionized our understanding of the star formation history of the universe by detecting a significant population of dust-obscured, massive star forming galaxies at high redshift. Detections at 350 GHz of apparently high-redshift sub-millimeter (sub-mm) sources in the Hubble Deep Field (Hughes et al. hughes98 (1998)), in three fields observed as part of the Canada-UK Deep Submillimeter Survey (Lilly et al. lilly99 (1999); Eales et al. eales99 (1999)), and in a survey of galaxy clusters (Smail et al. smail97 (1998); Ivison et al. 1998a , 1998b ) imply that optical studies may have under-estimated the integrated cosmic star formation rate at by at least a factor two, by missing dust-obscured massive star forming systems that can now be detected at sub-mm wavelengths. The preliminary redshifts assigned to the detected sub-mm sources would imply a rising co-moving star formation rate to redshifts of 3 at least (Blain et al. blain99 (1999); see Trentham et al. [trentham99 (1999)] for a deviating interpretation). This excess star formation seems to occur in galaxies with star formation rates between 102 M⊙ year-1 and 103 M⊙ year-1 (Lilly et al. lilly99 (1999)), i.e., up to ten times that observed for local ultraluminous IRAS galaxies, and over ten times higher than that inferred for typical high- galaxies seen in optical studies.
Unfortunately, our understanding of the faint sub-mm source population remains poor, principally due to the limited number of reliable identifications of sources in the optical or near-infrared (near-IR). Moreover, for those sources thus far identified, many are associated with faint optical and near-IR counterparts, which have typical magnitudes 20 to 21, and are occasionally very red, (Smail et al. smail99 (1999); Barger et al. 1999a ; Dey et al. dey99 (1999)). Hence, reliable optical and near-IR source identifications require accurate source positions. The sub-mm observations described above were made with the Submillimeter Common User Bolometer Array (SCUBA) at the James-Clerk-Maxwell Telescope (JCMT), whose FWHM beam at 850 m is too large to allow for proper source identification due to confusion in near-IR images (Downes et al. downes99 (1999); Barger et al. 1999b ; Smail et al. smail99 (1999)).
In order to increase the number of sub-mm/mm background sources with accurate positions, we have begun an extensive program using the IRAM Plateau de Bure radio Interferometer (PdBI) at 1.25 mm and the Very Large Array (VLA) at 20 cm wavelength. The PdBI was used to obtain accurate positions for the strongest source each in the Hubble and Canada-UK deep SCUBA fields detected by Hughes et al. (hughes98 (1998)) and Eales et al. (eales99 (1999)), respectively. Both sources were detected, allowing the determination of their positions to a fraction of one arcsecond. The detection and possible identification of the HDF850.1 source was presented by Downes et al. (downes99 (1999)), who find that the source falls in between a faint arc-like structure at a redshift between 1.7 and 3, and an elliptical galaxy at redshift 1.1, thus not permitting an unambiguous identification. The case is further complicated by the possible gravitational lensing of the sub-mm source by the elliptical galaxy, and by the lack of a significant radio counterpart. Although interesting in its complexity, the lack of a clear identification of the HDF source in the optical and near-IR limits its contribution to clarify the general nature of faint sub-mm sources.
In the following, we first present our PdBI observation of the brightest source detected in the Canada-UK Deep Submillimeter Survey carried out at 450 m and 850 m with SCUBA at the JCMT (Eales et al. eales99 (1999)) in fields used for the Canada-France Redshift Survey (Lilly et al. lilly95 (1995)).
Furthermore, we describe our program at the IRAM 30 m telescope, which entails wide field surveys of regions that have been observed to very faint levels with the VLA. To date, all blank field searches for sub-mm sources were conducted with only one instrument, SCUBA at the JCMT. The Max-Planck Millimeter Bolometer array (“MAMBO”, Kreysa et al. kreysa99 (1999)) at the IRAM 30 m provides comparable sensitivity, even taking into consideration the sharply rising spectrum of the thermal sources. The high resolution, sensitive VLA images are fundamental to source identification, providing sub-arcsecond source positions and a rough indication of source redshift when compared to the mm flux density (Carilli & Yun CY99 (1999); Blain blain99 (1999); Dunne et al. dunne00 (2000)). In this paper we present the first two source identifications from this program, including deep near-IR and optical imaging.
2 Observations and Results
2.1 Previous observation of CFRS14A
With an 850 m flux density of mJy, CFRS14A (Table 1) is the strongest sub-mm source detected by Eales et al. (eales99 (1999)) during the Canada-UK Deep Submillimeter Survey. A sensitive VLA 5 GHz survey of the field by Fomalont et al. (fomalont91 (1991)) reveals the weak radio source 15V18 nearly coincident with the SCUBA source. The radio source has a flux density of Jy and may be extended by arcsec. Lilly et al. (lilly99 (1999)) obtained deep ground based and HST images at the VLA position and found an optical/near-IR counterpart with , , , and , the colors of which suggest the galaxy to be at a redshift . Hammer et al. (hammer95 (1995)) detected the source at the same magnitude, and while they suggested it might be elongated by , Lilly et al. find it more compact, , but “not completely symmetrical.”
2.2 Interferometric observation of CFRS14A
We observed CFRS14A with the IRAM Plateau de Bure interferometer (Guilloteau et al. guilloteau92 (1992)) on 1998 November 25, 26 and 28. The five antenna array was used only in its most compact configuration, providing baselines extending up to 80 meters. The total integration time was 16 hours. The dual-channel receivers were tuned to 105 GHz LSB and 240 GHz USB. At 1.25 mm, data were taken in upper and lower sidebands. The correlator covered MHz at 105 GHz and MHz at 240 GHz.
Good weather conditions provided typical SSB system temperatures of 200 K at 105 GHz and 300 K at 240 GHz and rms phase noise at both frequencies. Flux densities were derived from observations of MWC349 (adopted flux densities were 1.06 Jy at 105 GHz and 1.75 Jy at 240 GHz) and/or CRL618 (1.55 Jy at 105 GHz and 2.00 Jy at 240 GHz). Temporal fluctuations of the phase and amplitude were calibrated by frequent observations of the nearby quasars and . The final flux density accuracy at 1.25 mm is estimated to be . Images were produced applying natural weighting and deconvolved using CLEAN.
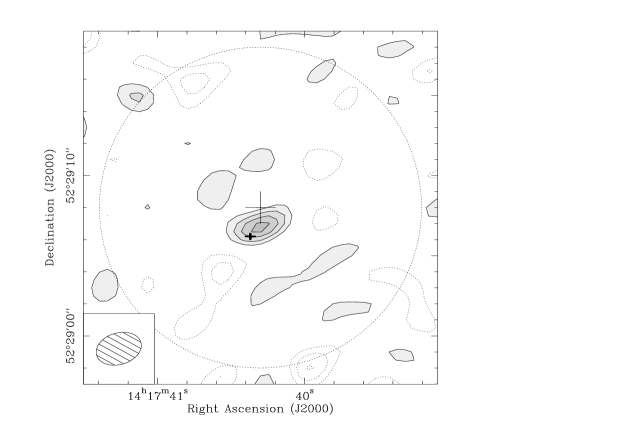
No source was detected at 105 GHz, to a limit of 0.6 mJy. The 240 GHz data reveal a mJy source (Fig. 1). The detection precludes a meaningful determination of an angular size (see Downes et al. [downes99 (1999)] for the discussion of the similar case of HDF850.1).
The emission peaks south of the 850m SCUBA source, north-west of the radio source, and north of the near-IR source. The astrometric errors are and along the beam major and minor axis, respectively. With a signal-to-noise ratio of 5, the statistical error adds , so that the total positional uncertainty is approximately . Within their errors the sub-mm, mm, radio, and near-IR positions are consistent with one single source. Future high-resolution VLA observations might better establish any offset between the radio and near-IR source position.
2.3 Sources from the MAMBO millimeter survey


The Max-Planck Millimeter Bolometer 37-element array “MAMBO” (effective frequency 250 GHz, bandwidth GHz) at the IRAM 30 m telescope was used from February to April 1999 and in December 1999 to March 2000 to map three fields with a total area of over 300 arcmin2 to 1 noise levels below 1 mJy (Bertoldi et al., in prep.).
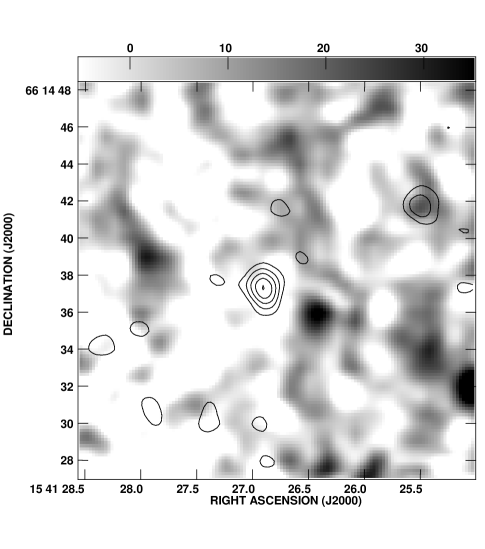
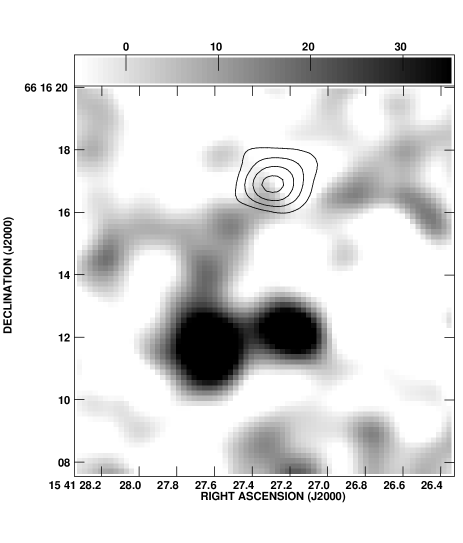
We here present two of the strongest mm sources found in our map toward the cluster Abell 2125, of which we had previously obtained a deep 1.4 GHz VLA image (, Owen et al., in preparation). Both mm sources stood out in the MAMBO maps, and coincided with VLA radio sources. The VLA radio positions were then targeted with deeper on-off bolometer integrations, the results of which are displayed in Figs. 2 and 3.
The on-off observations were conducted in standard chop-nod mode, with individual scans of 3 minutes, divided in 12 or 16 subscans of which each yields 10 seconds onoff source exposure. The secondary mirror was chopped by about 50′′ in azimuth at 2 Hz, and the telescope was nodded by the same distance after each subscan. The pointing accuracy is typically better than 2 arcsec. The data were analyzed with the MOPSI package (Zylka zylka98 (1998)). “Skynoise”, i.e., the rapid variation of the sky signal, was subtracted from each channel by subtracting the correlated signal of the surrounding six channels. The flux was calibrated with observations of Mars, Uranus, and Ceres, yielding 4900 counts/Jansky for the early 1999 data, and 12,500 counts/Jansky in early 2000, which we estimate to be accurate within 10%.
The observations of J154127+6616 were performed on five different days under good atmospheric conditions. The 52 scans add to 6795 seconds onoff source integration. The integrations of early 1999 yield almost identical results to those from early 2000: mJy in 3805 sec for 1999, mJy in 2858 sec for 2000. The merged data (Fig. 2) yield mJy. The quoted error is the integrated noise level of the central on-target channel. The signals of the off-target channels have a similar dispersion.
The observations of J154127+6615 were performed on three different days, 16 February 1999, 9 April 1999, and 24 March 2000, and add to 3446 seconds onoff target integration time. The individual observations yield less consistent results than for J154127+6616, possibly due to pointing problems or unstable atmospheric conditions. The individual observations yield source signals of mJy in 1069 sec, mJy in 1190 sec, and mJy in 1188 sec, on the respective dates. The merged data (Fig. 3) yield mJy. The final dispersion in the off target channels is 0.7 mJy. The actual source flux may be somewhat above 4 mJy, considering that the most recent detection gave a higher flux.
The positions of the 1.4 GHz VLA radio sources identified with the mm sources are given in Table 1. The 1.4 GHz size of J154127+6616 is , and its integrated flux is Jy. The more southern source, J154127+6615, has a 1.4 GHz size and an integrated flux density of Jy.
2.3.1 -band
An -band image including both mm/radio sources was taken with the KPNO 0.9 m telescope. It does not show any counterpart to either source brigher than mag.
2.3.2 -band
A -band image was obtained at the Apache Point Observatory (APO) with the ARC 3.5 m telescope on 1 July 1999. The detector was the GRIM II 256256 NICMOS array in F/5 mode with an image scale of 0.48 arcsec pixel-1. Sky conditions were photometric and the seeing at was . Zero point calibration was determined from observations of ARNICA IR Standard stars (Hunt et al. hunt98 (1998)).
The two MAMBO 1.2 mm identifications have a separation of 100 arcsec on the sky. As the field-of-view of the array was 120 arcsec, we were constrained to dither the field in E–W, keeping both positions in the FOV at all times. We exposed for 60 sec at each of the 5 dithered positions separated by 10 arcsec, for a total exposure time of 91 minutes.
The absolute positional errors of the images are (). The coordinate system was derived from the radio frame ( error), using the optical identifications to fix the solution on the -band image. The -band image was registered using objects from the image which also appear in the image. The same was done with the KPNO and Keck -band images.
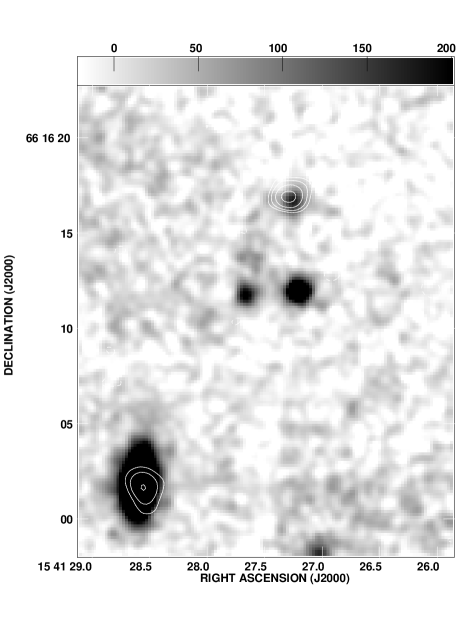
The -band image (Figs. 5 and 4) does not show any counterpart to both mm/radio sources brigher than 23.5 mag. However, a mag object appears about 3 arcsec away from J154127+6615, which we believe to be unrelated to the radio source, although the possibility that it is the mm counterpart is not excluded; we did not target this source with on-off bolometer observations.
2.3.3 -band
A -band image obtained with the Ohio-State NOAO Infrared Spectrometer on the 2.1 m telescope at the Kitt Peak National Observatory does not show any counterpart to either J154127+6615 or J154127+6616 brighter than mag ( limit in a 2 arcsec aperture).
A deep -band image obtained using the Near Infrared Camera (NIRC; Matthews & Soifer matthews94 (1999)) on the Keck I 10 m telescope reveals a mag counterpart to J154127+6616, and two more, mag and 19.7 mag, sources south of it (Fig. 6). The Vega-based magnitudes were measured in a 3′′ aperture. The identification of the 1.2 mm source with the northern of the three sources is most likely, because we did obtain MAMBO on-off observations pointed about 4 arcsec south and south-east of the VLA source position, which did not produce a signal at a comparable level.
The -band image shows a faint arc connecting the mm/radio counterpart with the source 4′′ south-west of it. This arc is also seen in the -band image (Fig. 5), whereas no -band counterpart appears at the position of the radio source. If this arc is real, it could suggest an association of the northern and southern sources in this system. Perhaps we observe an interacting group of galaxies, in which the northern source contains a dust-obscured starburst. However, all three sources have very different colors, with the southern source colors being more typical of low redshift sources. This may be a hint against their association with the very red /mm/radio source.
The possible arc is similar to structures seen toward several high-redshift sources, e.g., the dust emitting quasar BR 12020725 (Ohta et al. 2000). Arcs and multiple sources are indicative of lensing. However, the color differences between the three sources and the arc are significant, suggesting that they are not likely to be lensed images of one and the same source. The foreground cluster A2125 may magnify both mm source intensities by gravitational lensing, but since both sources are relatively far from the cluster center, the effect should be small.
3 Discussion
The faint sub-mm source in the CFH field, and the two sources in the A2125 field, follow a pattern that seems typical for many of the detected sub-mm sources. They have 10 to 100 Jy radio continuum counter-parts at 20 cm, they have very faint near-IR counter-parts, and they are mostly very red.
3.1 Redshift estimates
CFRS14A has a 350 GHz flux density of 8.8 mJy and a 240 GHz flux density of 2.0 mJy. The 350 GHz to 240 GHz flux ratio of CFRS14A implies a steep sub-mm spectral index,
| (1) |
Since such a value is typical for nearby starburst galaxies such as Arp 220 () or M82 (), the spectral index of CFRS14A does not indicate a flattening of the spectrum which would be found when the dust emission peak is redshifted to near 850 m. This indicates that the object may not be at very high redshift, i.e., at , which is consistent with the photometric redshift of derived from the observed optical/near-IR colors.
Carilli and Yun (CY99 (1999), CY00 (2000); CY) have shown that the radio–to–sub-mm spectral index provides a rough indication of redshift for star forming galaxies, based on the tight radio–to–far infrared correlation for star forming galaxies found by Condon (condon92 (1992); see also Dunne et al. dunne00 (2000); DCE). This correlation however assumes a narrow range of dust temperatures, because a high- object with warm dust would show the same spectral index as one with cool dust at low (Blain blain99 (1999)). Redshift estimates based on the radio–to–sub-mm spectral index are thus to be taken with caution.
CFRS14A has a radio flux density at 5 GHz of 44 Jy. Assuming a radio spectral index of , typical for star forming galaxies (Condon condon92 (1992)), implies an expected 1.4 GHz flux density of 120 Jy. The radio–to–sub-mm spectral index is then 0.78, which implies a most likely redshift of 1.9, with a reasonable lower limit of 1.3 using the (revised) mean-galaxy CY model based on 17 low redshift star forming galaxies. The DCE model based on 104 low redshift galaxies yields a most likely redshift of 1.6. Both redshifts are, within the errors, consistent with the photometric redshift estimate.
The two sources from the A2125 field have 250 GHz flux densities of about 4 mJy. The 1.4 GHz flux densities are around 75 Jy, leading to a spectral index between 1.4 and 250 GHz of 0.77.
Using the observed galaxy spectra from the revised CY model, a spectral index of 0.77 between 1.4 and 250 GHz implies a most likely redshift of 2.5, with a reasonable lower limit (84 confidence level) of . Using the DCE models leads to a most likely redshift of 2.2 (see discussion below).
3.2 Redshift distribution
We can use the observed or implied values of for the 3 sources discussed here, plus the 14 field galaxies in the Smail et al. (2000) sample, plus HDF850.1 and the three other sub-mm selected sources in the HDF and the HDF-FF with sensitive radio limits (Downes et al. downes99 (1999); Barger et al. barger00 (2000)), plus a source found by Ivison et al. (ivison00 (2000)) toward Abell 1835, to derive the redshift distribution of the faint sub-mm sources. For sources observed at 350 GHz we use the revised CY and the DCE models for the – relationship. The cumulative redshift distribution for these 22 sources is shown in Figure 7.

The CY model leads to a median redshift of 2.8, while the DCE model leads to a median redshift of 2.2. For 7 of these galaxies only lower limits to are available, which leads to lower limits to the possible redshifts. Most of these limits are in the range of to 3, leading to a steep rise in the redshift distribution in this range. It is likely that the distribution will become more gradual when more sensitive radio observations are made of these sources. It is also important to keep in mind that these models are relying on the idea that the radio–to–sub-mm correlation for star forming galaxies is independent of redshift.
Part of the offset between the CY and DCE redshift estimates may be due to the fact that the majority of the sources used by CY are in the upper half of the luminosity distribution of galaxies in the DCE sample. CY and DCE find a systematic trend for decreasing with increasing luminosity. In either case, these results strengthen the primary conclusions of Smail et al. (2000) that the majority of the faint sub-mm sources are likely to be at , and that there is no prominent low- tail in the distribution.
The distribution of CY redshift estimates is very close to that predicted from the fraction of uncollapsed structures in a standard cold dark matter Press-Schechter formalism with a bias factor of 2 (Peebles peebles93 (1993)). This agreement may be fortuitous, but it is remarkable.
Acknowledgements.
We thank R. Lemke and B. Weferling for their support during the MAMBO observations, and the anonymous referee for thoughtful comments on the manuscript. This work is based on observations carried out with the VLA, the IRAM 30 m and Plateau de Bure, Keck, Apache Point, and KPNO telescopes. IRAM is supported by INSU/CNRS (France), MPG (Germany) and IGN (Spain). We are thankful to the IRAM staff, especially U. Lisenfeld, A. Sievers and R. Neri, for their support with the observations and data reduction. The VLA is a facility of the National Radio Astronomy Observatory (NRAO), which is operated by Associated Universities, Inc. under a cooperative agreement with the National Science Foundation. Kitt Peak National Observatory is part of the National Optical Astronomy Observatories, which is a facility of the National Science Foundation operated under cooperative agreement by Associated Universities Inc. The W.M. Keck Observatory is a scientific partnership among the University of California, the California Institute of Technology, and the National Aeronautic & Space Administration, and was made possible by the generous financial support of the W. M. Keck Foundation. The Apache Point Observatory is owned and operated by the Astrophysical Research Consortium. C.C. acknowledges support from the Alexander von Humboldt Society.References
- (1) Barger, A.J., Cowie, L.L., Smail, I., Ivison, R.J., Blain, A., Kneib, P.-J., 1999a, AJ 117, 2656
- (2) Barger, A.J., Cowie, L.L., Sanders, D.B. 1999b, ApJ 518, L5
- (3) Barger, A.J., Cowie, L.L., Richards, E. 2000, AJ, in press (astroph 0001096)
- (4) Blain, A.W., Longair, M.S., 1993, MNRAS 264, 509
- (5) Blain, A. 1999, MNRAS 309, 955
- (6) Blain, A., Smail, I., Ivison, R.J., Kneib, J.-P., 1999, MNRAS 302, 623
- (7) Carilli, C.L., Yun, M.S., 1999, ApJ 513, L13
- (8) Carilli, C.L., Yun, M.S., 2000, ApJ 530, 816
- (9) Condon, J.J., 1992, ARAA 30, 575
- (10) Dey, A., Graham, J.R., Ivison, R.J., et al., 1999, ApJ 519, 610
- (11) Downes, D., Neri, R., Greve, A., et al., 1999, A&A, 347, 809
- (12) Dunne, L., Clements, D., Eales, S., 2000, MNRAS, in press (astroph 0002436)
- (13) Eales, S., Lilly, S., Gear, W., et al., 1999, ApJ 515, 518
- (14) Fomalont, E.B., Windhorst, R.A., Kristian, J.A., Kellerman, K.I., 1991, AJ 102, 1258
- (15) Guilloteau, S., et al., 1992, A&A 262, 624
- (16) Hammer, F., Crampton, D., Lilly, S.J., Le Fèvre, O., Kenet, T. 1995, MNRAS 276, 1085
- (17) Hunt, L. K., Mannucci, F., Testi, L., Migliorini, S., Stanga, R. M., Baffa, C., Lisi, F., Vanzi, L. 1998, AJ 115, 259
- (18) Hughes, D., Serjeant, S., Dunlop, J., et al., 1998, Nature 394, 241
- (19) Ivison, R.J., Smail, I., Le Borgne, J.-F., et al., 1998a, MNRAS 298, 583
- (20) Ivison, R.J., Dunlop, J. S., Hughes, D. H., Archibald, E. N., et al., 1998b, ApJ 494, 211
- (21) Ivison, R.J., Smail, I., Barger, A., et al., 2000, MNRAS in press, astro-ph 9911069
- (22) Kreysa, E., et al., 1999, SPIE 3357, 319
- (23) Lilly, S., Le Fèvre, O., Crampton, D., et al. 1995, ApJ 455, 50
- (24) Lilly, S., Eales, S.A., Gear, W.K., et al., 1999, ApJ 518, 641
- (25) Matthews, K., Soifer, B. T. 1994, in “Infrared Astronomy with Arrays: The Next Generation”, ed. I. McLean (Dordrecht: Kluwer), p. 239
- (26) Ohta, K., et al., 2000, PASJ, in press (astroph 0003107)
- (27) Peebles, P.J.E., 1993, Principles of Physical Cosmology (Princeton: Princeton Univ. Press)
- (28) Smail, I., Ivison, R.J., & Blain, A.W., 1997, ApJ 490, L5
- (29) Smail, I., Ivison, R.J., Kneib, J.-P., Cowie, L. L., Blain, A. W., et al., 1999, MNRAS 308, 1061
- (30) Smail, I., Ivison, R.J., Blain, A., Owen, F., Kneib, J.-P., 2000, ApJ 528, 612
- (31) Trentham, N., Blain, A.W., Goldader, J., 1999, MNRAS 305, 61
- (32) Zylka, R., 1998, Pocket Cookbock for the MOPSI Software, http://www.iram.es/Telescope/manuals/Datared/pockcoo.ps