Investigating the structure of the accretion disk in WZ Sge from multi-wave-band, time-resolved spectroscopic observations: Paper II
Abstract
We present our second paper describing multi-wave-band, time-resolved spectroscopy of WZ Sge. We analyze the evolution of both optical and IR emission lines throughout the orbital period and find evidence, in the Balmer lines, for an optically thin accretion disk and an optically thick hot-spot. Optical and IR emission lines are used to compute radial velocity curves. Fits to our radial velocity measurements give an internally inconsistent set of values for K1, , and the phase of red-to-blue crossing. We present a probable explanation for these discrepancies and provide evidence for similar behaviour in other short orbital period dwarf-novae. Selected optical and IR spectra are measured to determine the accretion disk radii. Values for the disk radii are found to be strongly dependent on the assumed WD mass and binary orbital inclination. However, the separation of the peaks in the optical emission line (i.e. an indication of the outer disk radius) has been found to be constant during all phases of the super-cycle period over the last 40 years.
keywords:
binaries: dwarf-nova, cataclysmic variables individual: WZ Sge1 Introduction
Dwarf-novae, among the cataclysmic variables (CVs), are semi-detached binary star systems where a white-dwarf (primary star) accretes gas from a cool companion (secondary star). The gas from the secondary star accretes through the inner Lagrangian point (L1), into the primary Roche lobe and slowly spirals in toward the white-dwarf. The in-flowing gas forms an accretion disk which orbits around the white-dwarf before actually being accreted onto the primary star. During the time the gas is within the accretion disk, current theory tells us that half of the gravitational energy of the gas is radiated outward while that which remains heats the accretion disk. Indeed most of the visible and IR light output by a typical dwarf-novae is from the accretion disk (?, ?). Emission lines seen in the spectra of a dwarf-nova arise from the vicinity of the accretion disk and can be double peaked due to the Doppler motions of the disk within the binary [Horne & Marsh 1986]. The velocity of the material within the disk, together with the emitted flux distribution over the disk, determines the line profile shape. Consequently, spectral line analysis is a fundamental method employed to understand the physical state of the accretion disk and its spatial flux distribution. The most common emission lines used in such analyses are those due to hydrogen and helium.
| Date of | Wavelength | Emission | Dispersion | App. dispersion | Exposure time | Run duration | Orbits | Number of |
|---|---|---|---|---|---|---|---|---|
| observations | range (Å) | Lines | (Å/pixel) | (km sec-1 ) | (sec) | (hours) | covered | spectra |
| 27/07/96 | 6375 - 6780 | H | 0.40 | 18.1 | 40 | 5.51 | 4.1 | 237 |
| 27/07/96 | 4590 - 4995 | H | 0.40 | 24.6 | 40 | 5.03 | 3.7 | 239 |
| 28/07/96 | 6375 - 6780 | H | 0.40 | 18.1 | 40 | 4.07 | 3.0 | 139 |
| 28/07/96 | 4590 - 4995 | H | 0.40 | 24.6 | 40 | 4.10 | 3.0 | 137 |
| 28/05/97 | 18000 - 24600 | Br, Br, He I | 13.2 | 193 | 480 | 2.70 | 2.0 | 18 |
| 08/08/98 | 10300 - 13400 | Pa | 6.22 | 145.6 | 240 | 6.73 | 3.5 | 30 |


In this paper, we continue the analysis of the accretion disk in WZ Sge which was started in ? (hereafter PAPER I). PAPER I presented Doppler tomography of optical and IR disk emission lines as well as ratioed Doppler maps. General conclusions reached there indicated different optical depth at the hot-spot and the accretion disk, and an accretion disk structure dissimilar to those predicted by models. In this paper (PAPER II), we perform spectral analysis by direct measurements of the emission line profiles. We organize the present paper in three main sections. Section 2 describes the orbital phase dependence of H, H, and IR emission lines. Section 3 presents newly determined radial velocity curves using optical and IR emission lines. We show that the amplitude and phase zero of the radial velocity curves are systematically biased. We show that this is due to different gas opacities in the hot-spot and the accretion disk, the hot-spot having a larger opacity than the accretion disk. We further develop the idea of increasing hot-spot contamination in systems where the difference between the optical depth in the hot-spot and the accretion disk is large, these systems being short orbital period, low mass transfer rate dwarf-novae. In section 4 we present our determinations for the accretion disk radii and compare our values with previously reported determinations.
Complete details concerning the data set used here (see table 1), are in PAPER I. All data are phased according to the photometric eclipse ephemeris stated in table 7, PAPER I. Optical spectra of WZ Sge were grouped into 50 phase bins per orbit in order to improve the signal-to-noise ratio of the data.
2 Emission lines
We analyze the emission lines evolution by inspecting their profile, measuring the fluxes and computing the Balmer decrement (last analysis on optical spectra only). Figure 4 summarizes the results from each analysis.
2.1 The line profiles
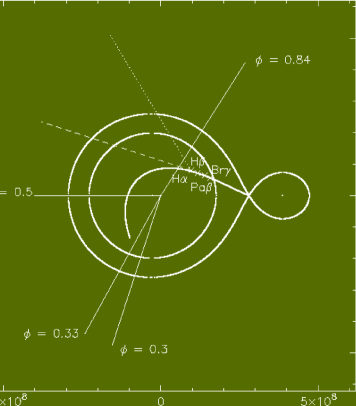
Figures 1 and 2 present a sample of optical and IR spectra respectively to show the complex emission line profiles and their dramatic evolution throughout an orbital period. Both optical and IR emission line profiles evolve similarly and owe most of their changes to the variable strength of the hot-spot around the orbit. Phases 0.3, 0.5, 0.84 and 0.63 are particularly suitable to point out the hot-spot evolution over the orbit.
Inspection shows that phase 0.3 is when the hot-spot, in both H and H emission lines, is at the center of the accretion disk emission, i.e. has zero radial velocity with respect to an observer co-moving with the white-dwarf. From the system geometry determined in PAPER I we expect the hot-spot in the middle of the accretion disk emission line at phase 0.3 only if the gas at the stream-disk impact region has just the stream velocity (see figure 4). This condition implies that the accretion disk density is low enough such that the gas at the stream-disk impact region keeps its stream velocity with little effect from the Keplerian motion of the underlying accretion disk material. In the IR spectra the phase of the hot-spot zero radial velocity occurs slightly later, i.e. at phase 0.33. Phase binning of the optical spectra with the same time resolution of the IR spectra has showed that such a delay is significant and implies different velocity of the hot-spot gas in different wave-bands. We explain such a phase delay with the hot-spot emission from different lines spreading along the stream trajectory (figure 4).
The hot-spot appears again at the center of the emission line at phase 0.84, both in the optical and IR spectra. The expected phase for the optical spectra is 0.80 in the assumption of symmetric and isotropic hot-spot emission. Further evidence for asymmetric and anisotropic hot-spot emission is in the hot-spot profile which appears double peaked at phase 0.84. This feature is real as it is common to both H and H binned spectra and is visible for a phase interval of 0.5 (see also the trailed spectrograms in figure 1 of PAPER I). A detailed study of the double structure is beyond the scope of this paper. The lower spectral resolution in the J and K bands does not resolve such a feature if present (the hot-spot peak separation is 9Å in the Balmer lines).
Phase 0.53 is when we expect the maximum hot-spot blue-shift and enhanced blue peak emission in the accretion disk lines. Observations do not confirm this expectation and show red and blue shifted peaks of roughly equal strength between phase 0.5 and 0.56, both in the optical and IR spectra. We explain this observation with little or no contribution from the hot-spot to the overall emission line flux. This is also evidence of the anisotropic hot-spot emission.
Asymmetries in the accretion disk are evident in the H emission line which displays a stronger red-shifted peak at phase 0.63. Doppler maps in PAPER I show asymmetric accretion disks also in the H, Br, He I, and Br lines. The accretion disk emission line profile evolves from a shallow U-shaped profile to a V-shaped profile, between phase 0.5 and 0.63. This is particularly evident in the optical spectra; among IR observations, only the J band spectra show similar evolution. ?) predict U-shaped emission line profiles for optically thin accretion disks, and V-shaped profiles for the optically thick case. This might suggest that the changing profile of the emission lines is evidence that some areas of the disk have optically thin line emission and some have optically thick.
2.2 Line flux
| Line | Max Flux | Min Flux | Flux at |
|---|---|---|---|
| H | 11.0010-14 | 6.7510-14 | 8.8010-14 |
| H | 4.9510-14 | 2.6510-14 | 4.0010-14 |
| Br | 1.1910-14 | 1.0110-14 | 8.3210-15 |
| He I 2.06m | 5.6710-15 | 3.5410-15 | - |
The emission line flux was measured by manually marking the position of line wings with the cursor and summing up the flux from each pixel in between; the continuum flux corresponding to a linear interpolation of the same two cursor position was automatically subtracted during the line flux measurements. Each of the emission lines measured (with the exception of the Pa line) show quite strong modulations apparently correlated with the line profile evolution (figure 3). The modulations display maxima at phase 0.84 and 0.3, and a minimum at phase 0.5. Thus, the hot-spot shows stronger emission when viewed from the outside (phase 0.84) and from the inside (0.3), while it does not contribute significantly to the emission line flux when viewed from upstream (phase 0.5). Assuming that the flux at phase 0.5 is due only to the accretion disk (see figure 1 and figure 2, and previous subsection) we can compute the relative contribution by the hot-spot to the total emission line flux. At phase 0.84 the hot-spot emits 50 of the total line flux in H and in H and the IR lines. When, viewed form the inside the hot-spot relative contribution decreases to 38 in H and to in H and Br. The He I 2.06m line does not display an evident hump at phase 0.3, thus the relative hot-spot contribution was not computed there. Assuming a spherical hot-spot with radius cm [Smak 1993], cylindrical accretion disk with thickness cm 111The value was derived computing the scale height H as given in [Williams & Shipman 1988] assuming a uniform temperature T=6000K in the accretion disk and a white dwarf mass of MM⊙ (PAPER I)., and inclination [Smak 1993], the decrease of the hot-spot flux from phase 0.84 to phase 0.30 due to occultation by an optically thick disk is 70%. We observe a decrease of only 30% in H and 50% in H and Br. Thus either the accretion disk gas is at least partially transparent to the hot-spot emission line flux, or the assumed geometry inappropriate.
The continuum light curve is expected to be double-humped as already observed by ?) in the IR, and by ?) and ?) in the optical. Right panel of figure 3 shows that only our K-band continuum measurements match with previous observations. The optical continuum shows large uncertainties on each data point and poor modulation throughout the orbit as the method used to measure line and continuum flux does not take into account the underlying white-dwarf absorption. The IR spectra, which do not show any evidence of white-dwarf features have the expected double-humped structure and smaller uncertainties in the continuum light curves. Fluxes from the Pa emission line and its underlying continuum have not been reported in figure 3 and table 2 because the data show variations throughout the run of observation. The run covered about four cycles and variations between cycles do not appear to be correlated. We cannot say whether this is due to intrinsic variability of the emitting source or to external causes.
2.3 The Balmer decrement

We measured the Balmer decrement for both the accretion disk and the hot-spot region to check for different opacities. The Balmer decrement is defined by the ratio of the line intensity in frequency units . The Balmer decrement, as measured from spectra, relies on line fluxes, because the line intensity is broadened by effects due to both the intrinsic properties of the emitting gas and the instrumentation used during the observation. The comparison of measured flux-ratios to tabulated intensity-ratios assumes that the emission lines of interest have identical profiles, each broadened in a similar way. We observe Balmer lines which are far from being identical in shape, however, table 6 of PAPER I show that time averaged disk profiles have identical velocity broadening. De-blending of the components is not possible without a complex model of hot-spot shape and accretion disk structure, thus we measured the peak intensity for each component, on continuum-subtracted spectra. We measured the disk emission at each phase using only the red or blue line peak, whichever was unaffected by the hot-spot emission at the given phase. The hot-spot line intensity has always some underlying disk emission blending, except near phase and , when the hot-spot emission is at the center of the emission line and the relative contribution from the accretion disk is negligible. The top panel of figure 5 shows that the Balmer decrement within the accretion disk is approximately constant throughout the orbit with an average value of , which is larger than the predicted value of for an optically thick accretion disk (?, ?). and each show phase dependent modulations, implying a non-uniform accretion disk emission, but their ratio remains constant. However, despite the uncertainties, the Balmer decrement in the accretion disk shows a clear trend around phase 0.3 toward higher opacities. The bottom panel of figure 5 shows the hot-spot Balmer decrement vs orbital period. The Balmer decrement here is strongly phase dependent and shows two deep minima at phase intervals 0.2-0.3 and 0.8-0.84, i.e. when observing perpendicular to the stream trajectory at the hot-spot position and measuring the hot-spot line intensities without any underlying accretion disk emission. The hot-spot Balmer decrement is 2. The value of outside phases 0.2-0.3 and 0.8-0.84 is 3 and approaches the average accretion disk Balmer decrement when the hot-spot emission is weak. In the hot-spot, shows a stronger modulation around the orbit than which is largely biased by the underlying accretion disk emission.
The Balmer decrement provides information about the gas temperature and density where the emission line forms; it gives a unique gas density for each assumed temperature. However, care must be taken because different temperatures may give the same value of the Balmer decrement depending on the assumption of optically thick or optically thin emission lines. In the interpretation of our results we mainly use models by ?) who modeled emission lines in optically thin accretion disks. He computed H strengths and Balmer decrements for a grid of temperatures, orbital inclinations, and mid-plane nucleon densities. In figure 6 we plot the results of ?) together with the Balmer decrement we measure at the hot-spot (lower horizontal line) and the accretion disk (upper horizontal line) in WZ Sge.

The value of =2 for the hot-spot region corresponds to a black-body optically thick emission with a temperature of T5000K. This decrement apparently matches a number of observed Balmer decrements in CVs [Williams 1983]. However, because we observe the He I emission line at 2.06m, parts of the hot-spot region must be at least 15000K (see section 3). An optically thin gas with a temperature of 15000K and a Balmer decrement of 2 corresponds to a gas density of in Williams’ model (see figure 6), which is lower than the derived gas density within the accretion disk (see below). The gas density in the stream is expected to be 3 to 4 times larger than the gas density within the accretion disk [Lubow & Shu 1976]. We thus conclude that the hot-spot is at least partially optically thick and characterized by a steep temperature gradient. The Balmer emission lines form down-stream from the initial impact region from a relatively low temperature (T5000K) optically thick gas, and the He I 2.06m emission line forms in the outer stream-impact region where the temperature is higher (see section 3).
The Balmer decrement = 3.82 of the gas within the accretion disk would correspond to a black-body of temperature T3400K. However, we expect the temperature to be higher as in an optically thick -disk the temperature is never expected to fall below 6000K over a wide range of mass accretion rate [Williams 1980]. Moreover, Ratioed Doppler tomograms and radial disk profile of WZ Sge (see PAPER I) suggest a partially optically thin accretion disk. We conclude that the accretion disk is optically thin in the Balmer emission lines. According to ?) a Balmer decrement of = 3.82 corresponds to an optically thin gas of temperature 6000K and density 13.5 (see figure 6). A roughly similar value of for gas at a temperature of T=5000K may be derived from ?) models. ?), using the escape probability approach, determined Balmer decrements and hydrogen lines strength for an infinite slab of gas at various opacities, temperatures, and densities. We can use these estimates to determine the optically thin accretion disk mass assuming: i) a uniform gas density of , ii) a cylindrical accretion disk with radii as determined in PAPER I (see also table 6), and height 2H as already defined in subsection 2.2. The result is an accretion disk mass of M, which is about 5 orders of magnitude smaller than the total mass accreted during the inter-outburst period (, ?). It is also 4 order of magnitude smaller than the critical mass (i.e. the maximum accretion disk mass before an outburst) expected in low mass transfer rate systems 222We derived the value M either using average values for the accretion disk radii and surface density as predicted by ?) (cm, cm, , for ), or formula (18) in ?) with as predicted for TOADs by ?).. However, typical values for the mass transfer rates and critical masses have been computed using the assumption of -disk models which are optically thick and cannot therefore be compared directly with optically thin gas models. ?) predicts an accretion disk that is only partially optically thin at a mass transfer rate of , the optically thin region starting from a radius of cm, outward. This value seems in quite good agreement with the radius of cm at which we observe the transition of the Balmer line ratio from optically thick to optically thin case (see section 4 and figure 7 in PAPER I).

| Line | Rest Wavelength | V/R crossing | amplitude | Systemic velocity |
|---|---|---|---|---|
| Å | km sec-1 | () km sec-1 | ||
| H | 4861.33 | 0.19100.0058 | 82.02.5 | -84.62.0 |
| H | 6562.7725 | 0.13310.0061 | 67.92.8 | -71.41.9 |
| Pa | 12818.1 | 0.2460.038 | 46.28.5 | 10.47.0 |
| He I | 20581.3 | 0.1570.014 | 121.412.6 | 144.19.2 |
| Br | 21655.3 | 0.2280.023 | 10815 | 20811 |
3 Radial Velocity Curves
Optical and IR spectra were used to measure radial velocity curves for H, H, Pa, Br and He I (m) emission lines. Radial velocity curve measurements were not produced for the two emission lines He I m and Pa as they were strongly blended together.
Figure 7 presents our radial velocity curves and their best fit for the five emission lines listed above. Each data point corresponds to the radial velocity of the emission line central wavelength. Central wavelengths were computed by using a technique similar to the Pogson’s method to determine the mid-time of an eclipsing binary with an asymmetric eclipse [Glasby 1970]. The radial velocity measurements were fit by a grid-search method minimizing . The sinusoidal fitting function used was:
| (1) |
where is the measured velocity and the observed photometric phase. The fitting parameters , K1, and are respectively the systemic velocity, the Keplerian velocity of the white-dwarf around the system’s center of mass, and the red-to-blue crossing in the radial velocity curve, corresponding to secondary inferior conjunction. We added the phase shift of 0.50 in Eq.1 in order to have exactly matching the secondary star inferior conjunction, and not the primary star inferior conjunction.
Our best fit parameters from each emission line represent an inconsistent set of values (see table LABEL:tab:rvfit). The systemic velocity, , runs from negative to positive values, spanning a range of 300km sec-1 wide. The white-dwarf Keplerian velocity, K1, runs from 46 to 120 km sec-1; while the red-to-blue crossing, , swings about phase 0.19, covering a range 0.1 in phase. Interestingly, a similarly inconsistent set of system parameters was determined for the optical radial velocity curves of the SU UMa type dwarf-nova VY Aqr [Augusteijn 1994].
When fitting and interpreting the sinusoidal radial velocity curves, it is assumed that: i) the disk orbits with Keplerian velocity around the white-dwarf, and ii) the accretion disk follows the white-dwarf motion around the binary’s center of mass. These approximations fail when hot-spot emission and disk asymmetries are not negligible. ?), shows that the hot-spot can induce a measured K1 larger than the true value and a spuriously delayed moment for inferior conjunction. ?) explain a larger K1 amplitude with non Keplerian motion.
We believe that our measured radial velocity curves result from combination of two different motions: 1) the motion of the accretion disk as described at points i) and ii) of the previous paragraph; and 2) the motion of the gas within the hot-spot region which moves along the ballistic trajectory at the stream velocity. Combination of the two velocity components in points 1) and 2) will change the amplitude and phase of a sinusoidal radial velocity curve, the largest departures occurring in systems where the hot-spot emission represents the largest fraction of the total emission line flux. An anisotropically emitting hot-spot may affect the velocity measurements. Optically thin accretion disks are likely to be low density gas regions (see section 3.1), which neither affects the stream velocity of the in-falling gas, nor absorbs the flux emitted at the impact region. Thus, emission line profiles from optically thin accretion disks are expected to be heavily biased by the hot-spot emission.

| Star Name | DN Type | Orbital Period | Phase Offset | i | Ref. |
|---|---|---|---|---|---|
| (days) | (deg) | ||||
| OY Car | SU | .06312 | .1167 .0058 | 83.30.2† | (1) |
| HT Cas | SU | .073647 | .095 .009 | 76.4 | (2) |
| Z Cha | SU | .0745 | .0904 .0017 | 81.7 | (3) |
| EM Cyg | ZC | .29090950 | .057 .011 | 6310† | (4) |
| U Gem | UG | .17708 | .015 .011 | 69.70.7† | (5) |
| V2051 Oph | UG? | .062427887 | .132 .020 | 80.52† | (6) |
| CN Ori | UG | .163190 | .03 .01 | 6570 | (7) |
| IP Peg | UG | .15820 | .067 .008 | 79.30.9 | (8) |
| WZ Sge | SU | .05668684707 | .1620 .0042 | 752 | (9) |
| DV UMa | SU? | .0859722 | .10 .02 | 72 | (10) |
| HS 1804+6753 | UG | .2099370 | .044 .002 | 84.20.6 | (11) |
The phase offset is found to be correlated with the energy required to produce each emission line. Figure 8 shows the observed phase offset versus the excitation potential of each H emission line as given by the standard formula. Figure 8 clearly shows a linear relationship between the observed phase offset and the emission line energy and implies a smeared out hot-spot region with decreasing excitation energy and temperatures as the gas moves down-stream. Results similar to those in figure 8 may be obtained using the data in ?) on VY Aqr. We fit the phase offset computed by Augusteijn for three hydrogen emission lines and found a linear relationship with almost identical slope and y-intercept as in figure 8.
The He I 2.06m emission line was not considered in figure 8. The He I line 2.06m is a transition strongly coupled with the resonant line at 584Å. Both lines decay from the same 21P level but the 584Å transition has a probability of occurrence which is times larger [Najarro et al. 1994]. Strong He I emission at 2.06m is rarely seen in astronomical objects and observed only in the extended atmosphere, wind and/or disk-like formations of WN and Be super-giant stars, where they form because of the high temperature, velocity and density of the out-flowing gas (15000-30000K, 700 Km sec-1, and M⊙ yr-1, respectively, ?). The presence of the He I 2.06m emission requires the He I 584Å line to form in an optically thick, high temperature 15000-30000K region, which, in short period dwarf-novae, can only occur in the shock heated stream-disk impact region. Formation of He I 2.06m in a hot corona is excluded by the Doppler tomogram in PAPER I figure 3.
We interpret our results above to provide a picture for the quiescent accretion disk in WZ Sge (figure 4), where each hot-spot emission line is likely to be aligned along the stream trajectory into the accretion disk, with the higher energy emissions arising at the higher temperature outer edge of the accretion disk impact region, and the lower energy lines primarily forming further down-stream.
3.1 Phase offset as a measure of the hot-spot bias
White-dwarf and/or hot-spot eclipses are present in the broad band photometric light curves of many dwarf-novae. In the case of the white-dwarf eclipse, the observed eclipse minimum defines the time of the secondary star inferior conjunction. In systems displaying only a bright spot eclipse, the phase offset between binary phase zero and the hot-spot eclipse is small (0.05 in phase, ?), so that we still have a good idea of the time of the true binary phase zero. Similarly, when measuring radial velocity curves, we expect the spectroscopic ephemeris to match the photometric one in systems with perfectly symmetric accretion disk, and a phase offset larger than zero in systems having asymmetries in their disk. In particular, a larger phase offset is expected in systems where the hot-spot represents the main asymmetry in the accretion disk and a considerable fraction of the total emission line flux. This is the case of WZ Sge given that our observations average out possible short term variation and Doppler tomograms in PAPER I show accretion disk asymmetries always considerably fainter than the hot-spot emission; moreover in section 2 we showed the accretion disk to be optically thin. To test the hypothesis of phase offset as a measure of the hot-spot bias and the optical properties of the accretion disk gas we searched the literature for measured dwarf-novae phase offsets and plot these values against the binary orbital period. Theory predicts low mass transfer rates in short orbital period systems [Howell, Rappaport & Politano 1997], implying low density possibly optically thin accretion disks.

Phase offsets have been observed in several different CVs (?, ?, and ?), but until now there has been no explicit or systematic search for its cause. ?), observed phase offsets in both nova-like and SU UMa stars, claiming that the hot-spot cannot be the cause of such an offset. ?) concluded that the best candidate to explain the phase offset observed in five dwarf-novae is only the hot-spot. Finally, ?) collected most of the observed phase offsets in the literature and plotted them vs. the binary orbital period but did not provide a possible explanation.
The eleven dwarf-novae listed in table 4 have been carefully selected in order to provide a homogeneous sample. This was achieved by selecting: i) high inclination dwarf-novae that show photometric eclipses, ii) only Balmer line radial velocity curves, and iii) publications reporting both photometric and spectroscopic analysis. Restrictions for point i) are to avoid biases other than the hot-spot and to reduce unknown inclination effects. Point ii) reduces the scatter in the measured phase offset by focusing on emission lines arising from regions with similar physical conditions, and finally, point iii) guarantees consistently measured phase offset and reduces any bias due to possible changes in the quiescent accretion state. Figure 9 plots our selected sample which provides evidence for the expected correlation: the phase offset is larger in short orbital period systems.
4 Accretion disk size
It is possible to estimate the inner and outer accretion disk radii in a dwarf-nova by measuring the emission line wing and peak separations respectively, and assuming a Keplerian velocity. For an annulus of gas in Keplerian motion at a distance from a white-dwarf of mass MWD, orbiting at an angle to the line of sight, the Keplerian velocity is:
| (2) |
In a double peaked emission line from an accretion disk, the Keplerian velocity of the outer disk radius corresponds to half the line peak separation (hereafter HPS); while, the Keplerian velocity at the inner accretion disk radius corresponds to half the line wing separation (hereafter HWS).
It is important both to have reasonable system parameters and to measure HWS and HPS on unbiased spectra, i.e. spectra in which the wings and peaks of the accretion disk emission line are not affected by hot-spot emission (figure 1, phase 0.3 and 0.84). Spectra in which the hot-spot emission clearly contaminates wings and/or peaks of the accretion disk emission line profile may provide a measure of the hot-spot bias. Both HWS and HPS were measured reading the cursor position with the IRAF task splot. HWS values from each spectra are the average over 5 measurements.
| Line | Uncontaminated Spectra | Average Spectra | Ref. | ||
| HPS | HWS | HPS | HWS | ||
| (km sec-1) | (km sec-1) | (km sec-1) | (km sec-1) | ||
| H | (1) | ||||
| H | (1) | ||||
| Br | (1) | ||||
| He I 2.06m | (1) | ||||
| P | (1) | ||||
| Pa | – | (1) | |||
| He I 1.08m | – | (1) | |||
| H | (2) | ||||
| q | i o | Rout (cm) | Rin (cm) | Fraction RL1 | Ref. | |||||||
|---|---|---|---|---|---|---|---|---|---|---|---|---|
| () | cm | H | H | Br | H | H | Br | H | H | |||
| 0.13 | 75 | 1.130.21 | 0.53 | 0.48 | (1) | |||||||
| 0.039 | 0.05 | 77 | 3.070.58 | 0.93 | 0.84 | (2) | ||||||
| 0.055 | 0.19 | 75 | 0.750.14 | 0.43 | 0.38 | (3) | ||||||
| - | 0.05 | 80 | 2.870.54 | 0.90 | 0.81 | (4) | ||||||
| 0.820.10 | - | 0.07 | 75 | 1.940.06 | 2.040.08 | - | 0.420.26 | 0.260.17 | - | 0.63 | (5) | |
4.1 Measurements on uncontaminated spectra
We selected a sample of uncontaminated phase binned H and H spectra. The assumption is that the hot-spot emission does not affect the wings of the accretion disk emission lines. This selection criteria produced three binned H spectra (at phases 0.28, 0.30 and 0.32) and six binned H spectra (at phases 0.28, 0.30, 0.32, 0.34, 0.82 and 0.84). We applied the same selection criteria to IR spectra and selected two uncontaminated spectra in both the J and K band (at phases 0.33 and 0.84 in each case). In case the hot-spot feature was not evident (figure 2, J-band, phase 0.3) we select those spectra which are the closest in phase to the uncontaminated optical spectra listed above. HWS and HPS were first measured on each bin separately, and then averaged. HWS and HPS measured values are in table 5. We see that values from optical and IR emission lines are in good agreement each other, the exceptions being the He I m and Pa lines which apparently have smaller HPS value and larger HWS values than in the H, H, and Br measurements. We applied a t-student test (to a confidence level of ), to check for statistical differences between pairs of values. The test showed that the HWS values have to be considered statistically identical in all the emission lines, i.e. the same inner disk radii; while the H HPS is statistically larger than the measured HPS from H, Br, He I m, and Pa, thus implying a smaller outer disk radius ().
Velocities from uncontaminated spectra were used in equation 2 to compute the accretion disk radii for a variety of primary masses and inclinations (see table 6). It is evident that small white-dwarf masses (MM⊙), imply a small accretion disk outer radius ( of the primary Roche lobe radius) and a relatively large ratio RWD/Rin (); while larger masses (MM⊙) give a large outer disk radius (up to 90% of the primary Roche lobe radius) and RWD/R, implying an annulus shaped accretion disk. The input value of the white-dwarf mass does not affect the ratio, R=Rin/Rout, which is equal to 0.2 in each case.
| Half Wing Separation (Km sec-1) | ||
|---|---|---|
| Uncontaminated Spectra† | Averaged Spectra | |
| Line | K1 subtracted | |
| H | ||
| H | ||
| Pa | ||
| He I (2.06m) | ||
| Br | ||
4.2 Measurements on the averaged spectra
Optical and IR average spectra show relatively symmetric accretion disk emission lines. This is expected because the hot-spot motion, i.e. the S-wave, smoothes out the hot-spot features at each phase, and evenly distributes its emission throughout the orbit. Average spectra also show broader emission lines than single spectra. This happens for two reasons: i) the common orbital motion of the accretion disk and the white-dwarf around the binary center of mass will broaden the disk emission line by a term K1, i.e. the white-dwarf Keplerian velocity; and ii) the wings of the hot-spot emission blend with the blue and red-shifted accretion disk emission lines. The S-wave velocity is usually smaller than the outer disk edge Keplerian velocity (?; hereafter GKS), thus, we expect average spectra with broader accretion disk emission peaks and smaller peak separation than observed in single spectra. HPS and HWS from average spectra are given in table 5. HPS values from optical and IR emission lines agree fairly well and confirm –with the exception of He I m and Pa– the expectation. HWS values are in good agreement too, emission lines with larger HWS value are probably affected by high velocity components from the hot-spot. HWS and HPS measured in the averaged spectra can give information about the S-wave bias when compared with wing and peak separations from uncontaminated spectra. They also test the assumptions used in the accretion disk radii computations.
We compared HWS values from averaged and uncontaminated spectra after correction for the white-dwarf orbital motion. HWS from uncontaminated spectra, and HWS from averaged spectra, K1 subtracted, should be equal in the absence of hot-spot high velocity components. Table 7 shows that HWS values from uncontaminated spectra and K1 subtracted averaged spectra agree very well each other in the case of H and Br emission lines; while H and He I m have HWS values from K1 subtracted average spectra which are 450 and 250 Km sec-1 larger than expected in the absence of high velocity components in the hot-spot. Such components bias both radial velocity curve measures and the accretion disk radii computation. The fact that we observe the largest hot-spot high velocity component in the H line is consistent with figure 4 and the less energetic emission forming downstream in the accretion disk. High velocity hot-spot components in the Pa emission line should be taken cautiously, because of larger uncertainties in the measurement.
It is worth noting that each average spectra was K1 subtracted by the correspondent white-dwarf orbital motion as determined in section 3. The K1 values from radial velocity curve fitting are biased by the hot-spot and do not reflect the true orbital motion of the white-dwarf. However, because the hot-spot bias is believed to increase the true K1 value (see section 3, ?, and ?), then the applied correction to our averaged spectra should be over-estimated.
Table 5 also reports HWS and HPS as we measured by hand from the average H spectra in figure 1 of GKS. Comparison of the GKS determinations with those from our averaged spectra gives a chance to check for changes in the quiescent accretion state of WZ Sge. The data in GKS were obtained almost one year after the last outburst of WZ Sge in Dec 1978 and ours were obtained about 18 years after the outburst. We measured larger HWS and HPS values in the GKS spectra than in our averaged spectra. In particular, in the GKS spectra the HWS is 200 Km sec-1 larger than in our averaged spectra; while, the HPS matches the values we measured on our uncontaminated spectra. Therefore, we may conclude that: i) the H hot-spot emission high velocity component was possibly larger one year after the super-outburst than 18 years later; ii) the hot-spot emission was probably weaker at the time of GKS observations such that it didn’t affect the accretion disk peak separation; iii) the peak separation in GKS spectra may be considered free from hot-spot bias and implies constant outer accretion disk radius in the H emission.
Particularly interesting is the conclusion of point iii) which claims a constant accretion disk outer radius. Indeed, the same HPS value has been observed in all quiescent spectra of WZ Sge obtained in the last 40 years (see table 8). One possible explanation is in the assumption of the outer accretion disk radius at the 3:1 tidal resonance radius. A constant accretion disk outer radius has some important implications relating to current outburst theory. Some disk outburst theories [Meyer-Hofmeister, Meyer & Liu 1998, Wynn et al. 2000] predict that, during quiescence, the outer radius slowly increases up to the 3:1 resonance radius. Once reached at the 3:1 resonance, quiescent super-humps should be present.
| Line | Date | yr† | (km/sec) | Ref. |
|---|---|---|---|---|
| H | 1956 Aug 15 | 10 | 720 | (1) |
| H | 1956 Aug 15 | 10 | 710 | (1) |
| H | 1962 Aug 4 | 16 | 72014 | (2) |
| H | 1962 Aug 4 | 16 | 72014 | (2) |
| H | 1979 July 16 | 1 | 731 | (3) |
| H | 1983 Nov 24-28 | 5 | 73030 | (4) |
| H | 1983 Nov 24-28 | 5 | 73030 | (4) |
| H | 1994 May 30 | 16 | 74740 | (5) |
| H | 1996 July 27/28 | 18 | 71110 | (6) |
| H | 1996 July 27/28 | 18 | 76228 | (6) |
| Line | U | R | Ref. | |||
|---|---|---|---|---|---|---|
| H | 0.070.02 | 0.1040.001 | 0.12 | 0.5 | 0.30 | (1) |
| H | 0.072 | 0.113 | 0.013 | 1 | 0.2 | (2) |
| H | 0.077 | 0.122 | 0.016 | 0.75 | 0.23 | (2) |
| H | 0.20 | (2) | ||||
| H | 0.20 | (2) | ||||
| H | 1.660.19 | 0.080.04 | (3) |
4.3 Smak’s method of determining Rin/Rout
The accretion disk radii ratio, R=Rin/Rout, is often the only value provided by authors because of the large uncertainties affecting the determination of the orbital inclination and the binary star masses. A commonly applied method to compute R is the one developed by ?).
Smak’s method assumes axially symmetric accretion disk in Keplerian motion and a power law flux distribution () for the disk emission. The R and values depend on the parameters U, A84, and A41 which are defined as follow: U=, with =instrumental resolution, A, and A, where W0.8, W0.4, and W0.1 are the emission line width at the fractions 0.8, 0.4, and 0.1 of the peak height above the continuum, respectively.
?) applied Smak’s method to WZ Sge and determined A, A, and R=0.3 (see table 9). A ratio R=0.3 is 50% larger than the value 0.2 we determined in section 4.1. We investigated such a difference to understand whether it reflects changes in the quiescent accretion disk size or it implies inconsistencies between the Smak’s method and the method described in section 4.1. We applied Smak’s method to our H and H uncontaminated spectra and found A84 and A41 values matching those by Mennickent and Arenas (see table 9). However, we expect a ratio . Then, we may conclude that: i) the two methods are consistent and, in particular, the assumptions of axisymmetric disk and power law flux distribution required by the Smak’s method are not fundamental to the determination of R and Smak’s method may be applied also to asymmetric accretion disks such as WZ Sge; ii) the two accretion disk radii ratio, R=0.3 by Mennickent and Arenas and R=0.2 by us, may correspond to a real change in WZ Sge’s quiescent accretion state and indicate an inward motion of the inner accretion disk radius toward the white-dwarf surface (in section 4.2 we showed that the outer disk radius remains constant during quiescence).
5 Summary and Conclusions
We observed both hot-spot and accretion disk line emission to vary in shape and strength throughout an orbital period, and conclude that both the hot-spot and the accretion disk are asymmetric and anisotropically emitting. We determined the gas at the impact region to have just the stream velocity, and the accretion disk is a low density gas with little drag effects on the in-falling material from the secondary star. There are different Balmer decrements at the impact region and in the rest of the accretion disk, and we conclude that the gas has a different opacity, , within the two regions. In particular, the hot-spot is optically thick in the lines, while the accretion disk appears to be optically thin in the lines.
Our measured radial velocity curves, from five emission lines in the optical and in the infrared are found to present an inconsistent set of system parameters. We explain this result as a bias due to the hot-spot emission. In particular, we showed that the hot-spot emission delays the apparent time of the secondary inferior conjunction with respect to photometric phase zero. We also show that the phase offset depends both on the excitation potential energy of the considered emission line and on the optical depth of the gas in the accretion disk. Our extended analysis of a selected sample of dwarf-novae shows increasing phase offset with shorter orbital period, consistent with the idea of optically thin accretion disks in low mass transfer rate systems.
Summarizing our results from the emission line profile analysis and radial velocity curve computations presented here, we can formulate a probable structure for the WZ Sge accretion disk. The accretion disk is generally a low density, optically thin gas. The accretion disk is neither symmetric, nor has it a uniform gas density or temperature structure (see also PAPER I). The hot-spot is optically thick in the emission lines, not symmetric in shape, and not an isotropic emitter. The hot-spot emission arises from a multicomponent extended region in which each emission component is not visible at all phases and the hot-spot emission varies in strength throughout the orbital period. These variable hot-spot emissions lead to an extended hot-spot region which does not emit strongly when viewed from the down-stream direction (phase 0.5 and following), and shows a temperature gradient along the stream trajectory. Figure 4 summarizes our conclusion.
The qualitative picture of WZ Sge provided by our observations and data analysis shows a peculiar quiescent accretion disk dissimilar to others observed at present. WZ Sge is the first short orbital period dwarf-nova showing evidence of optically thin emission both in the continuum (?, and ?), and the lines. Multicolor photometry of OY Car, Z Cha, and HT Cas (?, ?, ?) shows evidence of quiescent accretion disk optically thin in the continuum but thick in the emission lines. This work establishes a first step toward an understanding of the spatial flux and material distribution within the WZ Sge accretion disk and other TOAD (Tremendous Outburst Amplitude Dwarf-novae, ?) candidates.
The accretion disk radii determined in sec.4.1 show that determination of the inner and outer radius strongly depend on the assumed white-dwarf mass and the binary orbital inclination. Unfortunately, white-dwarf mass and radius determinations are still affected by large uncertainties. The uncertainties on the WZ Sge white-dwarf parameters prevent us from uniquely determing the actual size of the accretion disk, the fraction of the primary Roche lobe it fills, or its exact shape. Whether the accretion disk extends down to the white-dwarf surface or is a ring-like accretion disk as suggested by some previous studies (?, ?, ?), cannot be uniquely determined. We determined the accretion disk radii ratio in WZ Sge, R=Rin/Rout, to be 0.2, and observed that the outer accretion disk radius does not vary during the quiescence period. One explanation for the constant accretion disk outer radius is the assumption that the accretion disk extends to the 3:1 tidal resonance radius. One possible test of this idea would be to search for and find quiescent super-humps.
Acknowledgments
The optical data used in this study were obtained by Henke Spruit and Rene Rutten with the William Herschel Telescope of the ING at La Palma. The William Herschel Telescope is operated on the island of La Palma by the Isaac Newton Group in the Spanish Observatorio del Roque de los Muchachos of the Instituto the Astrophysica de Canarias. The United Kingdom Infrared Telescope is operated by the Joint Astronomy Centre on behalf of the U.K. Particle Physics and Astronomy Research Council. SBH acknowledges partial support of this research from the NSF grant AST 98-19770 and from the University of Wyoming office of research. We thank Dr. Peter Tamblyn for his help and information concerning He I emission.
References
- [Augusteijn 1994] Augusteijn T., 1994, A&A, 292, 481
- [Bailey & Ward 1981] Bailey M.E., Ward M., 1981, MNRAS, 196, 425
- [Barrera & Vogt 1989] Barrera L.H., Vogt N., 1989, A&A, 220, 99
- [Cheng et al. 1997] Cheng F.H., Sion E.M., Szkody P., Huang M., ApJ, 484, 149
- [Ciardi et al. 1998] Ciardi D.R., Howell S.B., Haushchildt P.H., Allard F., 1998, ApJ, 504, 450
- [Fiedler, Barwig & Mantel 1997] Fiedler H., Barwig H., Mantel K.H., 1997, A&A, 327, 173
- [Drake & Ulrich 1980] Drake S.A., Ulrich R.K., 1980, ApJSS, 42, 351
- [Gilliland, Kemper & Suntzeff 1986] Gilliland R., Kemper E., Suntzeff N., 1986, (GKS), ApJ, 301, 252
- [Glasby 1970] Glasby I.S., 1970, The Dwarf Novae, American Elesvier Publishing Company Inc., New York
- [Greenstein 1957] Greenstein J., 1957, ApJ, 126, 23
- [Hantzios 1988] Hantzios P.A., 1988, PhD thesis, Ohio State University
- [Horne & Marsh 1986] Horne K., Marsh T.R., 1986, MNRAS, 218, 761
- [Howell, Rappaport & Politano 1997] Howell S.B.,Rappaport S., Politano M., 1997, MNRAS, 287, 929
- [Howell, Szkody & Cannizzo 1995] Howell S.B.,Szkody P., Cannizzo J.K., 1995, ApJ, 439, 337
- [Howell et al. 1999] Howell S.B., Ciardi D.R., Szkody P., Van Paradijs J., Kuulkers E., Cash J., Sirk M., Long K., 1999, PASP, 111, 342
- [Krzeminski & Kraft 1964] Krzeminski W., Kraft R., 1964, ApJ, 140, 921
- [Lasota, Hameury & Hur 1995] Lasota J.P., Hameury J.M., Hur J.M., 1995, ApJSS, 53, 523
- [Lubow & Shu 1976] Lubow S.H., Shu F.H., 1976, ApJLett, 207, L53
- [Marsh 1987] Marsh T., 1987, MNRAS, 228, 779
- [Marsh, Horne & Shipman 1987] Marsh T.R., Horne K., Shipman H.L., 1987, MNRAS, 225, 551
- [Marsh 1988] Marsh T., 1988, MNRAS, 231, 1117
- [Mennickent & Arenas 1998] Mennickent R., Arenas J., 1998, PASJ, 50, 333
- [Meyer-Hofmeister, Meyer & Liu 1998] Meyer-Hofmeister E., Meyer F. & Liu B., 1998, A&A, 339, 507
- [Najarro et al. 1994] Najarro F., Hillier D.J., Kudritzki R.P., Krabbe A., Genzel R., Lutz D., Drapatz S., Geballe T.R., 1994, A&A, 285, 573
- [Neustroev 1998] Neustroev V., 1998, ARep, 42, 748
- [Paczynski, Piotrowski & Turski 1968] Paczynski B.,Piotrowski S.L.,Turski W., 1968, ASS, 2, 254
- [Patterson et al. 1996] Patterson J., Augustejin T., Harvey D.A., Skillman D.R., Abbott T.M.C.,Thotstensen J., 1996, PASP, 108, 748
- [Ritter & Kolb 1998] Ritter H., Kolb U., 1998, A&AS, 129, 83
- [Skidmore 1998] Skidmore W., 1998, PhD thesis, University of Keele
- [Skidmore et al. 2000] Skidmore W., Mason E., Howell S.B., Ciardi D.R., Littlefair S., Dhillon V.S., 2000, MNRAS, accepted
- [Shafter 1991] Shafter A.W., 1991, Fundamental Properties of Cataclysmic Variable Stars, Proceeding of the 12th North American Workshops on Cataclysmic Variables, 39
- [Schoembs & Hartmann 1983] Schoembs R., Hartmann K., 1983, A&A, 128, 37
- [Smak 1970] Smak J., 1970, Act Ast, 20, 311
- [Smak 1976] Smak J., 1976, Act Ast, 26, 277
- [Smak 1981] Smak J., 1981, Act Ast, 31, 395
- [Smak 1993] Smak J., 1993, Acta Ast, 43, 212
- [Spruit & Rutten 1998] Spruit H., Rutten R., 1998, MNRAS, 299, 768
- [Stover 1981] Stover R.J., 1981, ApJ, 249, 673
- [Stover, Robinson & Nather 1981] Stover R.J., Robinson E.L., Nather R.E., 1981, ApJ, 248, 696
- [Szkody & Howell 1993] Szkody P., Howell S.B., 1993, ApJ, 403, 743
- [Young, Schneider & Shectman 1981] Young P., Schneider D.P., Shectman S.A., 1981, ApJ, 245, 1043
- [Warner 1995] Warner B., 1995, Cataclysmic Variable Star, 691 Cambridge University Press, Cambridge
- [Watts et al. 1986] Watts D., Bailey J., Hill P., Greenhill J., McCowage C., Carty T., 1986, A&A, 154, 197
- [Williams 1980] Williams R.E., 1980, ApJ, 235, 939
- [Williams 1983] Williams G.A., 1983, ApJSS, 53, 523
- [Williams & Shipman 1988] Williams G.A., Shipman H.L., 1988, ApJ, 326, 738
- [Williams 1991] Williams G.A., 1991, AJ, 101, 1929
- [Wood, 1990] Wood J.H., 1990, MNRAS, 243, 219
- [Wood, Horne & Vennes 1992] Wood J.H., Horne K., Vennes S., 1992, ApJ, 385, 294
- [Wynn et al. 2000] Wynn G.et al., 2000, NewAR, in prep.