Optical and Infrared photometry of the type IIn SN 1998S: Days 11-146
Abstract
We present contemporaneous optical and infrared photometric observations of the type IIn SN 1998S covering the period between 11 and 146 days after discovery. The infrared data constitute the first ever infrared light curves of a type IIn supernova. We use blackbody and spline fits to the photometry to examine the luminosity evolution. During the first 2–3 months, the luminosity is dominated by the release of shock-deposited energy in the ejecta. After 100 days the luminosity is powered mostly by the deposition of radioactive decay energy from 0.150.05 M⊙ of 56Ni which was produced in the explosion. We also report the discovery of an astonishingly high infrared (IR) excess, , that was present at day 130. We interpret this as being due to thermal emission from dust grains in the vicinity of the supernova. We argue that to produce such a high IR luminosity so soon after the explosion, the dust must be pre-existing and so is located in the circumstellar medium of the progenitor. The dust could be heated either by the UV/optical flash (IR echo) or by the X-rays from the interaction of the ejecta with the circumstellar material.
keywords:
supernova, circumstellar matter, infrared excess1 Introduction
During the past decade a new, distinct subclass of type II supernovae has been recognised - supernovae type IIn (Schlegel 1990). In these events the broad absorption components of all lines are weak or absent (Filippenko 1997). Their early time spectra are dominated by strong narrow emission lines. The appearance of these narrow lines is attributed to the dynamical interaction of the ejected envelope with a dense circumstellar wind emitted by the progenitor (e.g. Chugai & Danziger 1994). Progenitor mass-loss rates as high as 10-3 M⊙ year-1 have been estimated from the strength of these lines (Chugai 1997). The mass loss can take place in several episodes sometimes lasting up to the time of explosion. Consequently, type IIn supernovae can provide unique information about the properties of circumstellar material (CSM) and the late stages of stellar evolution. In addition, the study of the interaction of these supernovae with the CSM can provide vital clues about galaxy evolution and the nature of active galactic nuclei (c.f. Terlevich et al. 1992).
SN 1998S is the brightest type IIn event so far. It was discovered on 1998 March 2.68 UT in NGC 3877 by Z. Wan (Li & Wan 1998) at a broadband (unfiltered) optical magnitude of +15.2. By March 18.4 it had brightened to (see section 2). There was no evidence of the supernova, down to a limiting apparent magnitude of +18, in a prediscovery frame obtained on 1998 February 23.7 (Leonard et al. 2000, IAUC 6835). We can thus assume that SN 1998S was discovered within a few days of the shock breakout. Optical spectra obtained on March 5 by Filippenko & Moran (1998) and Huchra (Garnavich et al. 1998) show prominent H and He emission lines with narrow peaks and broad wings superimposed on a blue continuum. Gerardy et al. (2000) present near-IR spectra of SN 1998S spanning 95–355 days post-maximum light. They identify emission from carbon monoxide and dust and discuss the environments of these materials. They also suggest that late-time multi-peak H and He line profiles in their spectra indicate emission from a disk-shaped or ring-shaped circumstellar component. Leonard et al. (2000) present optical spectroscopy and spectropolarimetry of SN 1998S spanning the first 494 days after discovery. They deduce the presence of a dense, asymmetrically distributed CSM exterior to the expanding ejecta.
Following the discovery of SN 1998S we began a programme of infrared and optical photometry and spectroscopy. In this paper we present the photometry covering the period 11–146 days after discovery. The spectra will be described in a separate paper (Fassia et al. 2000a). The photometric observations are described in section 2. In section 3 we determine the extinction to the supernova. In section 4 we apply blackbody and spline fits to photometry in order to examine the luminosity evolution and estimate the ejected 56Ni mass. We also consider the observed high infrared excess. The work is summarised in section 5.
2 Observations
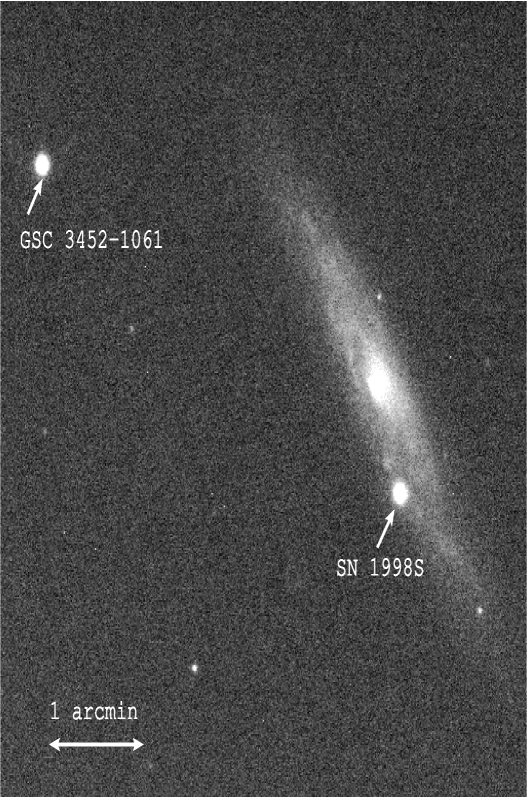
SN 1998S is located 16′′ west and 46′′ south of the nucleus of NGC 3877 (Figure 1). As mentioned above, SN 1998S was discovered within a few days of the shock breakout. We therefore adopt the time of discovery, 1998 March 2.68 UT = JD 2450875.2, as epoch 0 days.
2.1 Optical Photometry
images of SN 1998S were obtained during the period from 11 to 146 days. These data were acquired from a variety of telescopes: the 82 cm Instituto de Astrofisica de Canarias telescope (IAC80) on Tenerife, the 1.0 m Jacobus Kapteyn Telescope (JKT) on La Palma and the 3.5 m Wisconsin-Indiana-Yale-NOAO telescope (WIYN) at Kitt Peak. A list of the observations is given in Table 1. The IRAF CCDPROC package was used at Imperial College to reduce the JKT and WIYN data, following standard procedures. The IAC80 data were reduced at the IAC in a similar manner.
Unfortunately, most of the observations were taken under non-photometric conditions. For these nights, therefore, we performed differential photometry using for comparison the star GSC 3452-1061 which is located 230.54′′ east and 129.6′′ north of the supernova (see Figure 1). Instrumental magnitudes for SN 1998S and the comparison star were obtained using the aperture photometry package APPHOT of IRAF. Since seeing and pixel scales varied between epochs and sites, the software aperture size for a given image was allowed to vary. Of course, for each frame the same aperture sizes were used for SN 1998S and the comparison star. To calibrate the comparison star, Landolt (1992) standard fields were observed in under photometric conditions on April 11 and 13 at the IAC80, covering a range of airmasses. Thus, zero points and transformation coefficients linear in airmass were determined in . For the two photometric nights the average magnitudes for GSC 3452-1061 are: , , and .
To measure the flux from SN 1998S we had to take into account the background due to the spiral arm of NGC 3877. We estimated the background by examining the galaxy flux in both annular and circular apertures, with a range of radii, close to the supernova. The annular apertures were centered on the supernova. The circular apertures were placed at a number of positions near to the supernova. The galaxy background determined using the two types of aperture agreed to within 5%. We therefore took the mean value as the background underlying the supernova and this was used to correct the instrumental magnitudes. The final optical photometry for SN 1998S is listed in Table 1. The light curves are shown in Figure 2. These light curves agree very well with the light curves measured by the CFA group (Garnavich et al. 1999). For comparison we also show the and light curves of the type IIn SN 1988Z (Turatto et al., 1993).
| JD | Epoch | Telescope | Observer | ||||
|---|---|---|---|---|---|---|---|
| (2450000+) | (days) | ||||||
| 886.5 | 11.3 | - | - | 12.34(0.13) | - | JKT | A. Aragon-Salamanca, S. Bennett |
| 888.6 | 13.4 | - | - | 12.18(0.09) | - | JKT | A. Aragon-Salamanca, S. Bennett |
| 890.9 | 15.7 | 12.40(0.15) | 12.17(0.05) | 12.12(0.10) | - | WIYN | A. Saha |
| 891.9 | 16.7 | 12.46(0.1) | 12.28(0.1) | 12.34(0.13) | - | WIYN | P. Smith |
| 898.6 | 23.4 | 12.66(0.03) | 12.41(0.01) | 12.26(0.008) | 12.17(0.05) | JKT | S. N. Kemp |
| 903.5 | 28.3 | 12.87(0.03) | 12.58(0.007) | 12.38(0.008) | 12.14(0.01) | IAC80 | A. Alonso |
| 904.5 | 29.3 | 13.10(0.03) | 12.63(0.015) | 12.41(0.01) | 12.16(0.01) | IAC80 | S. N. Kemp, S.López |
| 907.8 | 32.6 | 13.17(0.04) | 12.81(0.04) | 12.48(0.03) | - | WIYN | D. Harmer |
| 908.4 | 33.2 | 13.23(0.03) | 12.78(0.015) | 12.50(0.015) | 12.25(0.015) | IAC80 | H.J.Deeg, S. N. Kemp |
| 909.4 | 34.2 | 13.26(0.03) | 12.81(0.01) | 12.55(0.01) | 12.27(0.01) | IAC80 | S. N. Kemp |
| 911.4 | 36.2 | 13.43(0.04) | 12.93(0.01) | 12.64(0.008) | 12.29(0.01) | IAC80 | H.J.Deeg |
| 913.5 | 38.3 | - | 13.00(0.01) | 12.68(0.007) | - | IAC80 | M.Rozas, F.Garzón, A.Gómez-Roldán |
| 915.5 | 40.3 | 13.60(0.03) | 13.10(0.05) | 12.75(0.12) | 12.42(0.09) | IAC80 | M.Rozas |
| 917.5 | 42.3 | 13.73(0.045) | 13.14(0.007) | 12.79(0.01) | 12.49(0.01) | IAC80 | M.R.Zapatero Osorio |
| 923.5 | 48.3 | 14.03(0.035) | 13.39(0.007) | 12.99(0.008) | 12.67(0.01) | IAC80 | A.Oscoz |
| 927.4 | 52.2 | 14.21(0.05) | 13.54(0.01) | 13.11(0.016) | 12.80(0.012) | IAC80 | G.Gómez, M.J.Arevalo |
| 931.5 | 56.3 | 14.38(0.03) | 13.65(0.012) | 13.22(0.008) | 12.88(0.011) | IAC80 | A. Oscoz |
| 939.5 | 64.3 | 14.72(0.03) | 13.94(0.014) | 13.42(0.01) | 13.04(0.01) | JKT | A. Pedrosa |
| 947.5 | 72.3 | 15.15(0.047) | 14.38(0.008) | 13.76(0.008) | 13.36(0.008) | IAC80 | A. Oscoz |
| 949.5 | 74.3 | 15.30(0.038) | 14.56(0.011) | 13.93(0.01) | 13.53(0.01) | IAC80 | A. Oscoz |
| 951.5 | 76.3 | 15.46(0.03) | 14.78(0.01) | 14.11(0.01) | 13.71(0.01) | IAC80 | A. Oscoz |
| 968.6 | 93.4 | 16.06(0.04) | 15.37(0.03) | 14.64(0.03) | 14.22(0.02) | WIYN/JKT | D. Harmer/ S. N. Kemp |
| 972.8 | 97.6 | 16.22(0.06) | 15.65(0.06) | 15.04(0.04) | 14.50(0.03) | WIYN | D. Harmer |
| 974.5 | 99.3 | 16.55(0.042) | 15.88(0.02) | 15.07(0.02) | 14.62(0.013) | JKT | J. Telting |
| 995.5 | 120.3 | 16.76(0.035) | 16.17(0.02) | 15.28(0.015) | 14.96(0.05) | IAC80 | A.Oscoz, D.Alcalde |
| 999.4 | 124.2 | 16.90(0.05) | 16.30(0.055) | 15.30(0.06) | 15.096(0.025) | IAC80 | A. Oscoz |
| 1000.5 | 125.3 | 16.85(0.03) | 16.14(0.05) | 15.35(0.02) | 15.10(0.04) | IAC80 | S. N. Kemp |
| 1021.5 | 146.3 | 17.29(0.085) | 16.64(0.12) | 15.67(0.04) | 15.53(0.05) | IAC80 | A. Alonso, C. Gutiérrez |
NOTE.- Figures in brackets give the internal error of each magnitude
| JD | Epoch | Telescope | Observer | ||||
|---|---|---|---|---|---|---|---|
| (2450000+) | (days) | ||||||
| 889.0 | 13.8 | 12.11(0.01) | 12.06(0.01) | 12.05(0.02) | IRTF | Bill Vacca | |
| 890.0 | 14.8 | 12.07(0.01) | 12.02(0.01) | 11.98(0.02) | IRTF | Bill Vacca | |
| 890.9 | 15.7 | 12.06(0.01) | 12.01(0.01) | 11.98(0.02) | IRTF | Bill Vacca | |
| 891.9 | 16.7 | 12.02(0.01) | 11.97(0.01) | 11.93(0.04) | IRTF | Bill Vacca | |
| 892.9 | 17.7 | 12.02(0.01) | 11.93(0.02) | 11.90(0.02) | IRTF | Bill Vacca | |
| 924.9 | 49.5 | 12.37(0.01) | - | - | IRTF | Bill Vacca | |
| 951.9 | 76.7 | 13.36(0.02) | 13.05(0.03) | 12.70(0.04) | IRTF | Bill Vacca | |
| 976.8 | 101.6 | 14.25(0.02) | 13.92(0.02) | 13.31(0.05) | - | UH2.2m | Bill Vacca |
| 984.8 | 109.6 | 14.33(0.01) | 14.02(0.02) | 13.43(0.11) | IRTF | Bill Vacca | |
| 1003.9 | 128.7 | 14.73(0.06) | 14.34(0.06) | 13.55(0.01) | - | UKIRT | Tim Hawarden |
| 1004.9 | 129.7 | - | - | 13.55(0.01) | 11.0(0.15) | UKIRT | Tim Hawarden |
NOTE.- Figures in brackets give the internal error of each magnitude


2.2 Infrared Photometry
broadband images of SN 1998S were obtained in the period 14 to 130 days. These data were acquired at the Infrared Telescope Facility (IRTF), the University of Hawaii Telescope (UH2.2m) and the United Kingdom Infrared Telescope (UKIRT), all on Mauna Kea. In addition, an image was obtained at UKIRT on day 130. The list of these observations is given in Table 2. All the infrared observations reported here were obtained under photometric conditions.
The IRTF data were acquired with the NSFCam infrared camera, a 1-5 m imager which incorporates a 256256 InSb array. For these observations, a plate scale of 0.3′′/pixel was used; this yields a field of view of 76.8′′. Images were obtained in the standard , , and broadband filters. In each filter, images of the supernova were acquired in a 7-point dither pattern, interspersed with equal integrations on an offset sky field which contained a bright star. Occasionally, two sets of dithered observations were obtained for a given filter. Each image consists of 5-10 coadded frames. Integration times for each frame were on the order of a few seconds. Images of UKIRT Faint Standard Stars FS21 and FS23 were obtained immediately before and after the SN images.
The UKIRT data were obtained using the IRCAM3 camera. This contains a 256256 InSb array with a plate scale of 0.281′′/pixel. For the observations a 5 point dither pattern and an integration time of few seconds was adopted. The UH2.2m data were acquired with the Quick Infrared Camera (QUIRC), which incorporates a 10241024 HgCdTe array (Hodapp et al. 1996). The broadband filters , , and and an integration time of 30 s were used for the observations. The plate scale was 0.19′′/pixel.
The IRTF data were reduced using IRAF scripts in the standard manner. Flat fields and sky frames were produced from the offset field images. Aperture photometry was carried out on each flat-fielded and sky-subtracted image using APPHOT in IRAF. An aperture radius of 12 pixels (3.6′′) was used; the background was estimated from a 5-pixel-wide annulus with an inner radius of 15 pixels from the center of each object. Instrumental magnitudes were converted to standard magnitudes using the observations of the UKIRT Faint Standard Stars and the published magnitudes given by Hunt et al. (1998). Because the standard stars were observed over a very limited range in airmass and have a limited range in color, we adopted the median extinction coefficients for Mauna Kea in each passband, as given by Krisciunas et al. (1987), and the average color term derived from both these and previous observations of other SNe with the same observational set up. Therefore, we fitted only the zero points, and applied the zero points and the color and extinction coefficients to the instrumental mags of the SN and the star in the offset field. Uncertainties were derived from the standard deviations of the 7-14 instrumental magnitude estimates of the SN in each filter, which were then carried through the photometric transformation equations. The errors presented in Table 2 are statistical only; the observations of the star in the offset field provide a measure of the systematic errors, which are less than about 0.04 mags.
The observations and data reduction of the UH2.2m data were carried out in a manner similar to that employed for the IRTF/NSFCam images. A source aperture with a radius of 15 pixels (2.8′′) was used for the photometry. Flux calibration was carried out using images of UKIRT Standards FS21, FS23, FS27, and FS35. Because multiple observations of these stars were acquired, a full solution for the photometric coefficients (zero point, color coefficient, and extinction coefficient) could be obtained. -band spectra taken by Fassia et al. (2000a) and Gerardy et al. (2000) on days 109 and 110 respectively show strong emission from the first overtone of the CO molecule. To take into account the effect of the CO emission the transformation of the mags to mags was performed as follows. We created transmission functions for the and bands using the UH2.2m filter functions and the standard Mauna Kea atmospheric transmission. We then multiplied the -band spectrum by the band transmission function and hence derived an apparent magnitude. Assuming that the CO emission remained constant between 101.6d (UH2.2m photometry) and 109d (-band spectra) we then scaled the -band spectrum to obtain a match of the apparent magnitude to the photometry. We then multiplied the scaled -band spectrum with the -band transmission function and determined the magnitude of SN 1998S on day 101.6.
The UKIRT data were reduced using the Starlink package IRCAMDR (Aspin 1996). They were first corrected for the dark-current. Median flatfields created from the target images were used for the flatfield correction. The resulting frames were then mosaiced together. Instrumental magnitudes were measured using the aperture photometry package APPHOT in IRAF. The determination of the galaxy background was performed in the same way as for the optical data (cf. Section 2.1). Calibration of the data was relative to the standard star FS21 (airmass corrected). Calibration of the image was relative to HD105601 () and HD106965 ().
The magnitudes are listed in Table 2. The data are plotted in Figure 3. To our knowledge these represent the first ever determination of the infrared light curves of a type IIn supernova. We note the astonishingly large infrared excess of exhibited at just 130 days. This excess persisted for more than a year and a half after discovery (Fassia et al. 2000b) and it is discussed in Section 4.2.
2.3 The colours
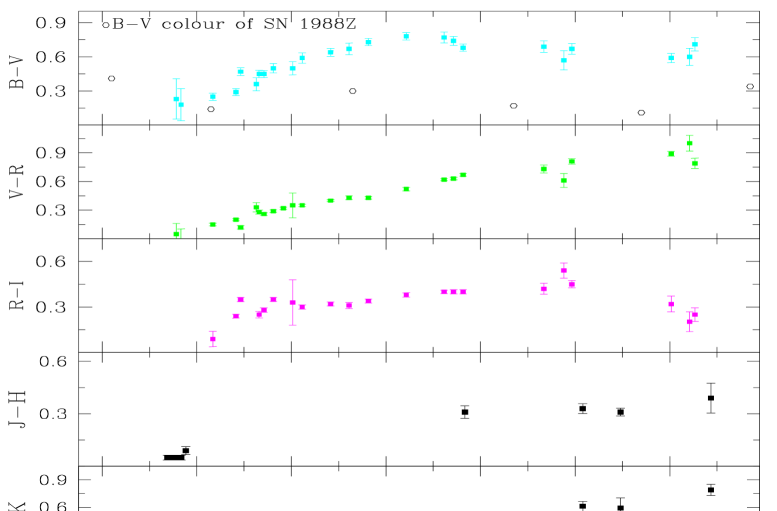
In Fig. 4 we present the optical and IR colour evolution of SN 1998S. In general, reddening of the colours took place between days 15 and 70. This is consistent with photospheric cooling, and is discussed in section 4.1 (cf. Fig 8.) Between days 80 and 130 the various colour indices evolve differently. The and bands are significantly affected by the evolution of the H and Ca II triplet lines (Fassia et al. 2000a) . The increasing prominence of H was responsible for the continued reddening in , while the strength of the Ca II triplet relative to H accounts for much of the evolution. In the IR, the colour continued to redden right up to the last observation on day 130. This is discussed in Section 4.3.
3 Extinction
In order to determine the extinction towards SN 1998S we examined interstellar Na I D lines in high-resolution spectrum obtained at the William Herschel Telescope, La Palma, on 1998 April 8.0 (Bowen et al. 2000; Fassia et al. 2000a). These are shown in Fig. 5. The spectrum is of sufficiently high signal-to-noise ratio and resolution (7.4 km/s FWHM) to allow us to determine the physical parameters of the interstellar absorbing clouds. We fitted theoretical Voigt profiles to the data (see Carswell et al. 1991 for details). For each feature in the spectra a model profile was computed for an initial set of values of the column density, , the heliocentric velocity, , and the Doppler parameter (i.e. the velocity dispersion within a cloud), . The instrumental profile was approximated by a Gaussian whose FWHM is determined from fits to unblended emission lines from the comparison lamp. The theoretical profiles were then convolved with the instrumental response function. Finally, the model parameters were adjusted to match the observed profiles by minimising .
Several constraints were imposed in the profile fitting procedure. For each feature we required that both components of the doublet were fitted. The number of absorption systems (i.e. clouds) was kept to a minimum by demanding that only features which were at least partially resolved were included in the fit. In the cases where a large range of values were obtained for , we chose the largest value and then repeated the fit with only and as the free parameters. For such cases this approach yields a lower limit to (Nachman & Hobbs 1973).
The final fits are shown in Figure 6 superimposed on the observed data points. The parameters of the model fits are presented in Table 3 where for each absorption system we give the heliocentric velocity, , the Doppler parameter, , and the column density, (Na I). Seven individual velocity systems are identified, with +824 to +885 km/s. Also given are the directly measured equivalent widths for the blends of systems 1–5 and 6–7. Measurements of the systemic velocity of the host galaxy, NGC 3877, vary from +838 km/s using optical observations of the nuclear region (Ho et al. 1995), to +902 km/s, using the H I 21 cm emission line (De Vaucouleurs et al. 1991). Thus, the absorption systems are clearly associated with NGC 3877. For each absorbing cloud, the derived can be related to the total hydrogen column density, (H)=(H I) + (H II) by adopting the correlation between these quantities established for the Milky Way Galaxy. Hobbs (1974, 1976) showed that (Na I)((H))2. However, for measurements that sampled lower column-density regions, Ferlet, Vidal-Madjar & Gry (1985) showed that the relation between (Na I) and (H) is close to linear for (H)1021cm-2 (corresponding to (Na I)5.61012cm-2 ). In particular they found that (Na I)=(1.040.08)(H)9.09 with a 1 scatter of 3dex. Given the column densities in Table 3, we therefore used this relation to derive (H) from our (Na I) measurements. The (H) values were then used to find the extinction towards SN 1998S. In doing this, we assumed the same gas-to-dust ratio in NGC 3877 as in our Galaxy i.e. we adopted the relation: (H)=5.810 (Bohlin et al. 1978). Summing over all the absorption systems we get .
| System | (Na I) | (H) | Wλ(D2) | Wλ(D1) | ||
|---|---|---|---|---|---|---|
| Number | (km/sec) | (km/sec) | (cm-2) | (cm-2) | (mÅ) | (mÅ) |
| 1 | 824.20.2 | 3.680.22 | 11.990.01 | 20.260.3 | 36625 000Sum of systems 1-5, which are blended together | 24530a |
| 2 | 834.70.6 | 1.450.43 | 11.790.07 | 20.070.3 | ||
| 3 | 842.80.6 | 2.390.78 | 11.760.04 | 20.050.3 | ||
| 4 | 853.30.3 | 3.350.53 | 12.010.01 | 20.280.3 | ||
| 5 | 862.90.9 | 0.300.07 | 12.120.30 | 20.390.3 | ||
| 6 | 875.20.3 | 3.480.35 | 11.990.01 | 20.260.3 | 13015 000Sum of systems 6-7, which are blended together | 8717b |
| 7 | 885.40.3 | 1.471.21 | 11.310.44 | 19.610.3 |
Given the large uncertainty in the extinction derived from the column density of Na I we also employed a different approach and estimated the extinction of SN 1998S using empirical relations between equivalent widths of the Na I D lines and the reddening . The total equivalent widths of the Na I D lines summing over all the components are =33035, =50030 and =82845. Barbon et al. (1990) provided a sample of supernovae for which both the reddening and the equivalent width of the Na I D lines was known. A linear fit to these observations gives . From this we get for SN 1998S. Munari & Zwitter also provided relations between equivalent widths of the Na I D lines and reddening using observations from early B stars. Using their results we get for SN 1998S. Finally, using the linear fits that Richmond et al. 1994, applied to the Sembach et al. (1993) sample of 57 stars in the Milky Way we get from the lines and from the lines. Averaging these two results and taking into account the scatter among the points of the Sembach et al. sample we estimate . We adopt the mean value of found by all the methods described above (including the estimate derived from the Na I column density) and get . However, given that all the estimates are based on the Na I D column density, we recognise that the values are probably not truly independent. Moreover, to the extent that the correlation between Na I column density and extinction is uncertain all the values may be subject to systematic error. Adding reddening due to dust in the Milky Way viz. (Schlegel et al. 1998) we get a total . Adopting A (Whitford 1958) for NGC 3877, this translates to .


4 Analysis and Discussion
4.1 Total Luminosity
In order to examine the energetics of SN 1998S, we used the photometry to examine the total luminosity as follows. For each date on which we acquired photometry in any waveband we assembled a complete set of magnitudes by interpolating to the specific date using both the data presented here and those published by (Garnavich et al. 1999). The -band data were taken exclusively from Garnavich et al. Magnitudes were converted to fluxes using the calibrations of Wilson et al. (1972) and Bessel (1979). Adopting the -band extinction value derived in the previous section, the fluxes were then de-reddened using the Cardelli et al. (1989) law.
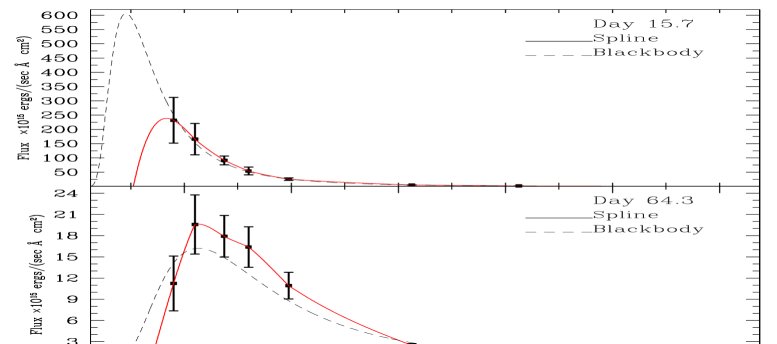
In one procedure, we fitted blackbody functions to the de-reddened data via minimisation, and then integrated under the best-fit blackbody curve to find the total luminosity. We shall refer to this as the “blackbody luminosity”. As well as providing total fluxes, this method also provided estimates of the photospheric temperature (T) and radius (R). We also estimated the velocity of material at the photosphere, Vph, by dividing R by the corresponding epoch. In a second approach we fitted spline curves to the data (Press et al. 1992), and again integrated under the curve. However, in this case the integration range was fixed by the limits of the filter functions used in the observations viz. =3500 Å and =25000 Å(i.e. we did not extrapolate beyond this wavelength range). This procedure provided what we shall call the “ luminosity”. As well as avoiding significant extrapolations into the UV, this method made no assumptions about the exact shape of the spectrum in the to range. Examples of blackbody and spline fits are shown for representative days in Fig. 7. The estimated fluxes were converted to luminosities by adopting a distance of 17.01.2 Mpc to NGC 3877 (Tully 1988). These are listed in Table 4, together with the temperatures, radii and velocities given by the blackbody fits, and are plotted in Fig. 8. Errors in the above quantities were estimated from the quality of the fits taking also into account uncertainties in the extinction and distance.
| JD | Epoch | T | R333Radii, velocities and luminosities have been calculated assuming that the distance of SN 1998S is 17 Mpc (Tully 1988, Nearby Galaxies Catalogue) | Vph | FBlackbody | FSpline | LBlackbody | LSpline |
|---|---|---|---|---|---|---|---|---|
| (2450000+) | (d) | (K) | (1014cm) | (km/s) | (10-10 erg | (10-10 erg | (1041 erg | (1041 erg |
| sec-1 cm-2) | sec-1 cm-2) | sec-1) | sec-1) | |||||
| 886.5 | 11.3 | 18000(2500) | 9.60(1.12) | 9800(1143) | 19.67(9.77) | 6.18(2.15) | 680.0(324.5) | 213.6( 79.9) |
| 888.6 | 13.4 | 17150(3300) | 10.27(1.48) | 8870(1278) | 18.80(12.4) | 6.40(2.17) | 650.0(419.4) | 221.2( 81.0) |
| 889.0 | 13.8 | 15710(2700) | 11.10(1.51) | 9270(1264) | 15.33(9.18) | 6.35(2.14) | 530.0(308.9) | 219.5( 79.9) |
| 890.0 | 14.8 | 15540(2300) | 11.35(1.43) | 8900(1119) | 15.48(8.19) | 6.38(2.13) | 535.0(273.2) | 220.5( 79.6) |
| 890.9 | 15.7 | 15950(2500) | 11.26(1.40) | 8300(1028) | 16.92(9.29) | 6.52(2.10) | 585.0(310.9) | 225.4( 78.9) |
| 891.9 | 16.7 | 14100(2100) | 12.45(1.56) | 8600(1079) | 12.73(6.75) | 6.20(2.05) | 440.0(225.3) | 214.3( 76.8) |
| 892.9 | 17.7 | 13400(1200) | 13.10(1.21) | 8560( 788) | 11.14(3.94) | 5.95(1.93) | 385.0(125.4) | 205.7( 72.5) |
| 898.6 | 23.4 | 11100(1150) | 15.50(1.68) | 7700( 831) | 7.67(3.09) | 5.01(1.50) | 265.0(100.5) | 173.2( 57.1) |
| 903.5 | 28.3 | 9700( 850) | 17.70(1.78) | 7220( 728) | 5.64(2.02) | 4.30(1.27) | 195.0( 64.6) | 148.6( 48.4) |
| 904.5 | 29.3 | 9170( 750) | 18.44(1.82) | 7300( 717) | 4.92(1.69) | 3.92(1.14) | 170.0( 53.5) | 135.5( 43.6) |
| 907.8 | 32.6 | 8560( 650) | 19.50(1.87) | 6900( 663) | 4.19(1.38) | 3.48(1.00) | 145.0( 43.2) | 120.3( 38.3) |
| 908.4 | 33.2 | 8470( 630) | 19.63(1.84) | 6850( 641) | 4.05(1.31) | 3.40(0.96) | 140.0( 40.8) | 117.5( 36.9) |
| 909.4 | 34.2 | 8300( 600) | 19.90(1.82) | 6750( 616) | 3.91(1.23) | 3.30(0.92) | 135.0( 38.3) | 114.1( 35.5) |
| 911.4 | 36.2 | 7900( 540) | 20.54(1.68) | 6600( 535) | 3.47(1.03) | 3.00(0.82) | 120.0( 31.4) | 103.7( 31.7) |
| 913.5 | 38.3 | 7700( 520) | 20.85(1.87) | 6300( 565) | 3.18(0.97) | 2.80(0.77) | 110.0( 29.8) | 96.8( 29.8) |
| 915.5 | 40.3 | 7400( 480) | 21.24(1.99) | 6100( 571) | 2.89(0.88) | 2.60(0.70) | 100.0( 27.0) | 89.9( 27.2) |
| 917.5 | 42.3 | 7300( 450) | 21.35(1.93) | 5850( 527) | 2.60(0.76) | 2.40(0.63) | 90.0( 23.3) | 83.0( 24.6) |
| 923.5 | 48.3 | 6830( 400) | 21.30(1.93) | 5100( 461) | 2.02(0.58) | 1.92(0.49) | 70.0( 17.7) | 66.4( 19.2) |
| 924.9 | 49.5 | 6560( 350) | 22.00(1.87) | 5120( 435) | 1.85(0.50) | 1.86(0.47) | 64.0( 15.0) | 64.3( 18.5) |
| 927.4 | 52.2 | 6640( 370) | 20.80(1.87) | 4600( 414) | 1.74(0.49) | 1.66(0.42) | 60.0( 14.7) | 57.4( 16.5) |
| 931.5 | 56.3 | 6420( 345) | 20.60(1.73) | 4230( 356) | 1.48(0.40) | 1.50(0.37) | 51.0( 11.9) | 51.9( 14.6) |
| 939.5 | 64.3 | 6400( 340) | 18.00(1.59) | 3200( 286) | 1.16(0.32) | 1.16(0.28) | 40.0( 9.5) | 40.1( 11.1) |
| 947.5 | 72.3 | 6200( 320) | 16.15(1.42) | 2580( 226) | 0.81(0.22) | 0.83(0.19) | 28.0( 6.6) | 28.7( 7.7) |
| 949.5 | 74.3 | 6120( 310) | 15.80(1.41) | 2460( 219) | 0.72(0.20) | 0.73(0.17) | 25.0( 5.9) | 25.2( 6.8) |
| 951.5 | 76.3 | 5700( 280) | 16.30(1.38) | 2020( 209) | 0.58(0.15) | 0.62(0.14) | 20.0( 4.5) | 21.4( 5.7) |
| 968.6 | 93.4 | 5980( 290) | 11.64(1.03) | 1440( 127) | 0.35(0.09) | 0.37(0.08) | 12.0( 2.8) | 12.8( 3.3) |
| 972.8 | 97.6 | 5750( 290) | 11.40(1.01) | 1350( 120) | 0.29(0.08) | 0.30(0.07) | 10.1( 2.4) | 10.4( 2.8) |
| 974.5 | 99.3 | 5590( 270) | 11.50(0.99) | 1340( 115) | 0.27(0.07) | 0.27(0.06) | 9.2( 2.1) | 9.3( 2.4) |
| 976.8 | 101.6 | 5280( 140) | 11.80(0.88) | 1350( 100) | 0.23(0.05) | 0.25(0.06) | 7.8( 1.3) | 8.6( 2.4) |
| 984.8 | 109.6 | 5660( 290) | 10.12(0.93) | 1070( 98) | 0.22(0.06) | 0.22(0.05) | 7.5( 1.8) | 7.6( 2.0) |
| 995.5 | 120.3 | 5530( 300) | 9.80(1.42) | 940( 136) | 0.19(0.07) | 0.20(0.04) | 6.4( 2.1) | 6.9( 1.7) |
| 999.4 | 124.3 | 5280( 290) | 10.10(0.95) | 944( 88) | 0.16(0.05) | 0.18(0.04) | 5.7( 1.4) | 6.2( 1.6) |
| 1000.5 | 125.3 | 5550( 240) | 9.56(0.92) | 890( 85) | 0.18(0.05) | 0.19(0.04) | 6.3( 1.5) | 6.6( 1.7) |
| 1003.9 | 128.7 | 5420( 130) | 10.60(0.80) | 950( 71) | 0.20(0.04) | 0.19(0.04) | 6.8( 1.1) | 6.6( 1.7) |
| Phase | Period (days) | Decline Rate (mag/day) |
|---|---|---|
| 1 | 11-30 | 0.08444This rate is determined from the blackbody-derived luminosities |
| 2 | 30-70 | 0.045555This rate is determined from the luminosities |
| 4 | 90-130 | 0.01b |
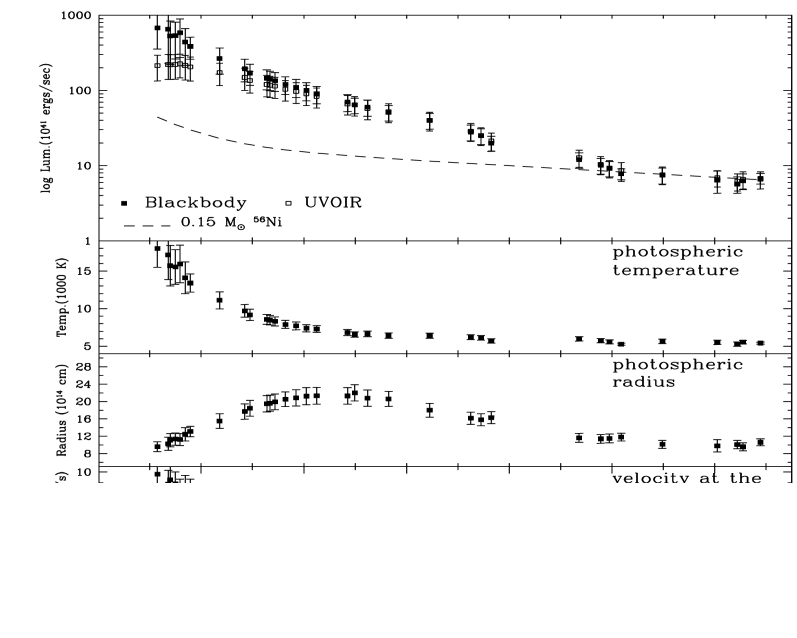
The SN 1998S luminosity evolution can be divided into three phases (cf. Table 5):
(i) Days 11-30. During this phase, good fits to the photometry are achieved with blackbody curves. This probably reflects the fact that the supernova spectrum is indeed close to being a blackbody at this time. Therefore, in spite of the large extrapolation into the UV, it is likely that the blackbody luminosity provides a more reliable estimate of the bolometric luminosity during this era i.e. the luminosity severely underestimates the bolometric luminosity. The blackbody-derived luminosity and temperature decreased steadily. The temperature fell from 18000 K to 9000 K. The photospheric radius approximately doubled in size. To within the uncertainties, the velocity of material at the photosphere (i.e. radius/epoch) remained at about 9,000 km/s. During this period, the emission is probably due mostly to the diffusive release of shock-deposited energy in the expanding, cooling ejected envelope. However, the presence of the narrow lines in the spectra (eg. Fassia et al. 2000a) indicate that SN 1998S is surrounded by dense circumstellar material (CSM). Thus, reprocessing of the UV-flash by the CSM may also contribute to the total light.
(ii) Days 30-70. After 30 days the spectrum became increasingly affected by emission/absorption features so the blackbody fits become poorer and less appropriate. This, together with the fact that the proportion of the flux in the inaccessible UV is much reduced means that the spline fits would be expected to provide a better estimate of the bolometric luminosity in this era. Nevertheless it can be seen from Fig. 8 that the blackbody and luminosities steadily converge, and by about day 40 the difference is barely significant. We believe that the use of the blackbody fits in this era still provides useful information about the temperature, radius and velocity.
Between days 30 and 70, the decline rate of the light curve resembles that of type IIL supernovae viz. 0.05 mag/day (Young & Branch 1989). At first, the temperature continued to decline but then levelled off at about 5500 K by day75. This is close to the recombination temperature for hydrogen. The photospheric radius remained roughly constant at while the velocity of material at the photosphere declined from 7,000 km/s to 2,500 km/s. We can interpret the decline in velocity as being due to the recession of the hydrogen recombination front through the expanding ejecta, releasing shock-deposited energy. During this phase in the classic type IIp event, the release of shock-deposited energy maintains the bolometric luminosity during the plateau phase. However there is little sign of such a phase for SN 1998S. We suggest that this is due to a reduced H-envelope. Indeed, the presence of narrow H-emission lines in the spectra (Filippenko & Moran 1998; Garnavich et al. 1998; Fassia et al. 2000a) indicates that the progenitor of SN 1998S lost a considerable amount of its hydrogen envelope prior to the explosion. We also suggest that the steepening of the decline at 70 days corresponds to the end of the plateau phase in the more typical type IIp event. At this epoch, the photosphere reaches the helium mantle. Since this has a higher recombination temperature than the hydrogen envelope, it would have already recombined resulting in the steeper decline of the light curve. However, by this epoch, the photosphere may already be encountering upwardly-mixed radioactive 56Ni/56Co (Fassia et al. 1998). The locally deposited -ray energy will tend to counter the recombination, thus slowing the inward progression of the photosphere and producing the observed decline rate of the bolometric light curve (eg. Swartz et al. 1991, Eastman et al. 1994).
(iii) Days 100-130. Sometime between day 80 and 100, the light curve decline rate slowed to about 0.01 mag/day, close to the radioactive decay rate of 56Co (cf. Fig. 8). By this epoch, both the photospheric radius and the velocity of material at the photosphere have declined sharply. The blackbody temperature remains at about 5500 K. However, the increasingly nebular nature of the spectrum means that blackbody-derived parameters are of decreasing physical meaning. In particular the blackbody derived photospheric velocities for the 100-130 days era are 1000km/s. This is substantially smaller the velocities inferred from the wings of the emission profiles of the optically thin Balmer lines, 5000km/s (Leonard et al. 2000, Fassia et al. 2000a). However, we note that the appearance of a broad asymmetric and flat-top H profile at day 100 (Leonard et al. 2000, Fassia et al. 2000a) indicates that the interaction of the ejecta with the circumstellar material further out must have already began around this epoch (Leonard et al. 2000). Consequently, emission from the shocked, high-velocity ejecta could contribute to the observed H line profile during this period (eg. Chugai & Danziger 1994) thus increasing its width.
The decline rate of the light curve during this period exhibits a remarkably good match to the radioactive decay luminosity decline rate of 56Co (cf. Fig. 8). We therefore suggest that, by this era, all the shock-deposited energy has been released and the ejecta are being powered by radioactive decay energy. Moreover, all the -rays and positrons are still being trapped in the ejecta at this phase. We can therefore estimate the total mass of 56Ni produced in the explosion. On the basis of the luminocities on days 109.6–128.7, and assuming an explosion date of 1998 February 28.0, we find a total initial 56Ni mass of 0.150.05 M⊙. Of course, as mentioned above, the H line profile during this epoch indicates that interaction of the ejecta with the CSM must have started. Thus emission from the interaction could be adding to the bolometric luminosity. However, given the match to the 56Co radioactive decline rate we conclude that the proportion of this contribution is less than 15%. It should be remembered that the derived mass of 56Ni is subject to any uncorrected systematic errors in the extinction correction (see Section 3).
4.2 Comparison with SN 1988Z
In Figure 4 we showed the evolution of the well-observed type IIn SN 1988Z (Turatto et al. 1993). Clearly, its behaviour was rather different from that of SN 1998S. During its first 100 days, SN 1988Z declined more slowly (cf. Figure 2). Turatto et al. (1993) suggested that the slowly declining light curve of SN 1988Z indicated the ejection of a massive, extended envelope in the explosion. However, Chugai & Danziger (1994) modelled the evolution of the H profile of SN 1988Z and concluded that the ejected envelope was 1 M⊙. They argued that SN 1988Z originated from a 8-10 M⊙ main sequence star which lost most of its mass through a high mass-flow wind which lasted right up to the explosion. Chugai (1997) estimates a mass loss rate of where is the wind velocity in units of 10km/s. In this scenario the interaction of the ejecta with the CSM began very soon after the explosion. This interaction produced the observed high luminosity and slow-declining light curve, masking the thermal emission of the supernova ejecta (Chugai & Danziger 1994, Chugai 1997).
The optical light curves of SN 1998S decline faster than those of SN 1988Z and, as indicated in the previous section, resemble more the light curve of the linear type II supernova (e.g. SN 1979C, Barbon et al. 1982). Linear type II supernovae are thought to arise from stars with main sequence masses 8-20 M⊙ (Blinnikov & Bartunov 1993). Similar to the scenario suggested for SN 1988Z by Chugai & Danziger (1994), these stars lose most of their envelope mass through stellar winds prior to explosion. However, the winds are considerably weaker. For SN 1979C, Chugai (1997) estimated a rate of , yielding an envelope of 2 M⊙ at the time of the explosion. We therefore suggest that the fast decline of the optical light curves of SN 1998S indicates that the mass of the supernova-ejected envelope was quite low but that the wind was weaker than in the case of SN 1988Z. Thus, at least in the first few months, the ejecta expanded without significant interaction.
Based on optical spectra of SN 1998S, Leonard et al. (2000) suggest that the progenitor of SN 1998S underwent a significant mass-loss episode that ended 60 years prior to the explosion. They also suggest that a second, weaker, mass-loss episode began seven years prior to the explosion. When the star exploded it immediately interacted with the most recent wind completely engulfing it within a few days. The interaction with the older, more massive wind started after 100 days.
4.3 and excess
The colour around day +17 is about +0.03 which is consistent with the (reddened) blackbody temperature given in Table 4. However, by day +76.7, the colour exhibits an excess of at least 0.15 mag relative to the blackbody temperature. This excess continued to increase attaining by day 128.7. Up to day 110, the appearance and growth of this excess is due mostly to CO emission. -band spectra shown in Fassia et al. (2000a) on day 109, and in Gerardy et al. (2000) on day 110 (using our definition of epoch 0 days) show strong emission in the CO first overtone band. Beyond day 110, however, thermal emission from dust (see below) may have made an increasingly significant contribution to the . As we argue below, cool dust (800K) is present in the vicinity of the supernova. Thermal emission from such cool dust would increase the band flux whereas it would have a negligible contribution to the band flux.
On day 130 we observed mag. Yet, for the temperature deduced from the blackbody fit on day 130 (6000 K) we would expect a colour of only about +0.15 (including extinction reddening). This is illustrated in Fig. 9. Moreover, we know that there was strong first overtone CO emission in the -band at about this time, which would tend to produce a colour even bluer than +0.15. We are unaware of any species which would produce sufficient line emission in the -band to account for the very red colour. We also know that by day +324 IR spectra (Fassia et al. 2000b) show a -band continuum which rises steeply towards long wavelengths. We believe therefore that the extremely red indicates the presence of an additional continuum source of IR emission.
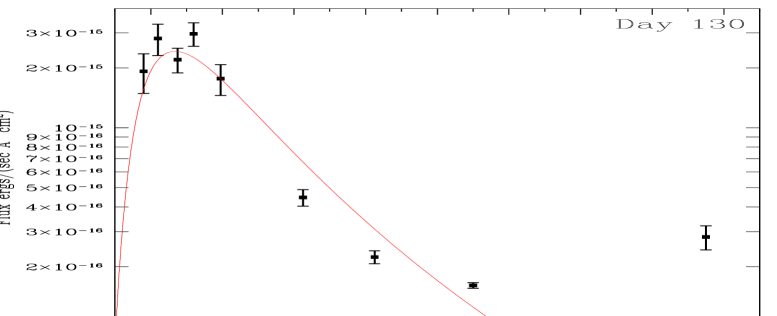
The occurrence of such an IR excess has been observed in other supernovae (e.g. Graham et al. 1984; Dwek 1983) and is commonly attributed to emission from warm dust. We believe that this is also the case here. We wish to determine the origin of the dust and its energy source. The flux of thermal emission from dust at a given temperature must come from a region at least as large as a blackbody of the same temperature. Constraints on the epoch of dust condensation can therefore be obtained by comparing the flux from the dust on day 130 with the size of the supernova at the same epoch. For a dust temperature of 1500 K (i.e. close to evaporation temperature) and a distance of 17 Mpc to NGC 3877, the magnitude (+11.1) on day 130 requires a blackbody radius of at least 1016 cm. If dust formed in the ejecta after the explosion, to achieve this radius by day 130 the dust (or its constituent elements and molecules) would have to travel with a velocity of 10700 km/s. Such a high velocity would be associated with the hydrogen envelope. However, densities and abundances favourable to dust condensation are only likely to occur much deeper in the ejecta, in the slow-moving layers of metals (Graham et al. 1983). Moreover, the spectra of SN 1998S show no evidence of fast-moving metals (Fassia et al. 2000a). Thus we conclude that most of the thermal emission from dust observed on day 130 originates from grains which condensed prior to SN 1998S, in the stellar wind of the progenitor. On days 325 and 355 respectively, Fassia et al. (2000b) and Gerardy et al. (2000) observed a near-IR continuum rising towards longer wavelengths. Gerardy et al. argue that the observed continuum is likely due to dust heated by the CSM-ejecta interaction either by direct shock-heating or by absorption of X-rays from the interacting region. However, they are unable to distinguish whether the emitting dust is pre-existing dust in the CSM or newly formed dust in the supernova ejecta. We note that the attribution of the strong IR-excess, observed on day 130, to pre-existing dust in the CSM does not contradict the dust condensation scenario. Dust could have formed in the ejecta at later epochs. The observed mag , corresponds to a blackbody temperature of K. However, spectral energy distributions () measured by us (Fassia et al. 2000b) between 130 and 691 days post explosion revealed that by 324 days, the temperature had risen to nearly 1300 K. It subsequently fell to K by 691 d. This later, hotter IR emission could be due to an episode of dust condensation in the ejecta. We shall investigate this further in Fassia et al. (2000b).
How might circumstellar dust be heated at epoch 130 days? One possibility is that optical/UV photons emitted from the supernova around maximum light heat the dust which then re-radiates this energy in the thermal IR. Light-travel time effects cause a delay in the reception of the IR flux at earth. This is usually referred to as an “IR-echo” (Bode & Evans 1980; Dwek 1983; Graham et al. 1984; Graham & Meikle 1986; Roche et al. 1989; Felten & Dwek 1989). Alternatively, the dust could be heated by X-rays from the ejecta-CSM shock front. At epoch 130 days, given the data available, it is difficult to choose between these two scenarios. However, second- and third-season observations show a strong excess persisting to at least day 690. The energy required to maintain the IR emission for such a long time probably favours the latter (X-ray) scenario, at least for later times. This will be discussed further in Fassia et al. (2000b).
5 Summary
We have presented infrared and optical photometric observations of SN 1998S covering the first 130 days after explosion. This is the first time that such extensive wavelength coverage has been achieved for a type IIn event. A value of mag is derived from interstellar Na I D lines measurements. Using our photometry we carried out blackbody and spline fits to determine the bolometric light curve. During the first 2–3 months, the luminosity is dominated by the the release of shock-deposited energy in the ejecta. During the first month, the photosphere stayed at about the same position with respect to the ejecta and the shock-deposited energy escaped by diffusion up to the photosphere. Subsequently, the shock energy was released as the photosphere receded inwards through the hydrogen envelope. After day 70, the bolometric light curve exhibited a steepening decline rate which we associate with the recombination front reaching the hydrogen-helium boundary. By day 100 the light curve decline rate slowed to about 0.01 mag/day matching the radioactive decay rate of 56Co. This agreement indicates that, by this time, the luminosity was dominated by the deposition of radioactive-decay energy and that all the -rays and positrons were trapped in the ejecta. From the bolometric luminosity after day110 we estimate that 0.150.05 M⊙ of 56Ni was produced in the explosion. On day 130 a strong IR “excess” was observed. We have argued that this must be due to pre-existing dust in the circumstellar material of SN 1998S. The dust could be heated either by the initial UV/optical flash of the supernova or by the X-rays from the CSM-shock front interaction.
Acknowledgements
We would like to thank Diane Harmer for co-ordinating the WIYN observations and Paul Smith and A. Saha for obtaining some of the WIYN observations. We are also very grateful to Bob Carswell who provided us with the software that fitted Voigt profiles to spectroscopic data. S. Bennett is supported by a PPARC studentship. AAS acknowledges generous financial support from the Royal Society. The JKT is operated on the island of La Palma by the Isaac Newton Group in the Spanish Observatorio del Roque de los Muchachos of the Instituto de Astrofisica de Canarias. The WIYN Observatory is a joint facility of the University of Wisconsin-Madison, Indiana University, Yale University, and the National Optical Astronomy Observatories. The IAC80 telescope is at the Observatorio del Teide, operated by the Instituto de Astrof’isica de Canarias. Finally we acknowledge that some of the data reported here were obtained as part of the UKIRT Service Programme.
References
- [1] Aspin C, 1996, Starlink User Note, 41.0
- [2] Barbon R., Benetti S., Rosino L., Cappellaro E., Turatto M., 1990, A&A, 237, 79
- [3] Barbon R., Ciatti F., Rosino L., Ortolani S., Rafanelli P.,1982, A&A, 116, 43B
- [4] Bessel M. S., 1979, PASP, 91, 589
- [5] Blinnikov S. I., Bartunov O. S., 1993, A&A, 273, 106
- [6] Bode M. F., & Evans A., 1980, MNRAS, 193, 21
- [7] Bohlin R. C., Savage B. D., Drake J. F., 1978, ApJ, 224, 132
- [8] Bowen, D. V., Roth K., Meyer D. M., Blades J. C., 2000, Apj, in press
- [9] Cardelli J, Clayton G, Mathis,J, 1989, ApJ, 345, 245
- [10] Carswell R. F., Lanzetta K. M., Parnell H. C., Webb J. K., 1991, ApJ, 371, 36
- [11] Chugai N. N., Danziger I. J., 1994, MNRAS, 268, 173
- [12] Chugai N. N., 1997, Astron. Reports, 41, 672
- [13] Dwek E., 1983, ApJ, 274, 168
- [14] De Vaucouleurs G., De Vaucouleurs A., Corwin JR., Buta R. J., Paturel G., Fouque P., 1991, Third Reference Catalogue of Bright Galaxies, version 3.9
- [15] Eastman R. G., Woosley S. E., Weaver T. A., Pinto P. A., 1994, ApJ, 430, 300
- [16] Fassia A., Meikle W. P. S., Geballe T. R., Walton N. A., Pollacco D. L., Rutten R. G. M., Tinney C., 1998, MNRAS, 299, 150
- [17] Fassia et al., 2000a, in preparation
- [18] Fassia et al., 2000b, in preparation
- [19] Felten J. E., Dwek E., 1989, Nature, 339, 123
- [20] Ferlet R., Vidal-Madjar A., Gry C., 1985, ApJ, 298, 838
- [21] Filippenko A. V., Moran E. C., 1998, IAU Circ. No. 6830
- [22] Filippenko A. V., 1997, Annu. Rev. Astron. Astrophys., 35, 309
- [23] Garnavich P. et al., 1999, http://cfa-www.harvard.edu/cfa/oir /Research/supernova/spectra/sn98s_lightcurve.gif
- [24] Garnavich P., Jha S., Kirshner R., 1998, IAU Circ. No. 6832
- [25] Gerardy C. L., Fesen R. A., Höflich P., Wheeler J. C., 2000, in press
- [26] Graham J. R., Wright G. S., Meikle W. P. S., Joseph R. D., Bode M. F., 1984, Nature, 310, 213
- [27] Graham J. R., Meikle W. P. S., 1986, MNRAS, 221, 789
- [28] Ho L. C., Filippenko A. V., Sargent W. L., 1995, ApJS, 98, 477
- [29] Hobbs L. M., 1974, ApJ, 191, 381
- [30] Hobbs L. M., 1976, ApJ, 203, 146
- [31] Hodapp K. W., Hora J. L., Hall D. N. B., Cowie L. L., Metzger M., Irwin E., Vural K., Kozlowski L. J., Cabelli S. A., Chen C. Y., Cooper D. E., Bostrup G. L., Bailey R. B., Kleinhans W. E., 1996, New Astronomy, 1, 177
- [32] Hunt L. K., Manmucci F., Testi L., Migliorini S., Stanga R. M., Baffa C., Lisi F., Vanzi L., 1998, ApJ, 115, 2594
- [33] Krisciunas K., Sinton W., Tholen K., Tokunaga A., Golisch W., Griep D., Kaminski C., Impey C., Christian C.,1987, PASP, 99, 887
- [34] Landolt A. U., 1992, AJ, 104, 340
- [35] Leonard D. C., Filippenko A. V., Barth A. J., Matheson T., 2000, ApJ, in press
- [36] Li C., Wan Z., 1998, IAU Circ. No. 6829
- [37] Munari U., Zwitter T., 1997, A&A, 318, 269
- [38] Nachman P., Hobbs L. M., 1973, ApJ, 182, 481
- [39] Press W. H., Teukolsky S. A., Vettering W. T., Flannery B. P., 1992, in Numerical Recipes, 2nd ed., publ. Cambridge University Press
- [40] Richmond M. W., Treffers R. R., Filippenko A. V., Paik A. V., Leibundgut B., Schulman E., Cox C. V., 1994, AJ, 107, 1022
- [41] Roche P. F., Aitken D. K., Smith C. H., James S. D., 1989, Nature, 337, 533
- [42] Sembach K. R., Danks A. C., Savage B. D., 1993, A&AS, 100, 107
- [43] Schlegel E. M., 1990, MNRAS, 244, 269
- [44] Schlegel D. J., Finkbeiner D. P., Davis, M., 1998, ApJ, 500, 525
- [45] Swartz D. A., Wheeler J. C., Harkness R. P., 1991, ApJ, 374, 266
- [46] Terlevich R., Tenorio-Tagle G., Franco J., Melnick J., 1992, MNRAS, 255, 713
- [47] Tully R. B., 1988, in Nearby Galaxies Catalog, publ. Cambridge University Press
- [48] Turatto M., Cappellaro E., Danziger I. J., Benetti S., Gouiffes C., Della Valle M., 1993, MNRAS, 262, 128
- [49] Whitford A.E., 1958, AJ, 63, 201
- [50] Wilson W. J., Schwartz P. R., Neugebauer G., Harvey P. M., Becklin E. E., 1972, ApJ, 177, 523
- [51] Young T. R., Branch D., 1989, ApJ, 342, L79