Digital Sky Surveys: Software Tools and Technologies
Large digital sky surveys, over a broad range of wavelengths, both from the ground and from space observatories, are becoming a major source of astronomical data. Some examples include the Sloan Digital Sky Survey (SDSS) and the Digital Palomar Observatory Sky Survey (DPOSS) in the visible, the Two-Micron All-Sky Survey (2MASS) in the near-infrared, the NRAO VLA Sky Survey (NVSS) and the Faint Images of the Radio Sky at Twenty centimeters (FIRST) in the radio. Many others surveys are planned or expected, in addition to the previously named surveys. While most surveys are exclusively imaging, large-scale spectroscopic surveys also exist. In addition, a number of experiments with specific scientific goals, e.g., microlensing surveys for MACHOs, searches for near-Earth asteroids, are generating comparable data volumes. Typical sizes of resulting data sets (as of the late 1990’s) are in the range of tens of Terabytes of digital information, with detections of many millions or even billions of sources, and several tens of parameters measured for each detected source.
This vast amount of new information presents both a great scientific opportunity and a great technological challenge: how to process, and calibrate the raw data; how to store, combine, and access them using modern computing hardware and networks; and how to visualize, explore and analyses these great data sets quickly and efficiently. This is a rapidly developing field, which often entails collaborative efforts between astronomers and computer scientists.
Broadly speaking, the steps along the way include: obtaining the data (telescope/observatory and instrument control software), processing the data into catalogs of detected sources and their observed properties, calibrating the data, archiving the results, and providing the tools for their scientific analysis and exploration.
Survey Pipeline Software
The actual gathering and processing of the raw survey data encompasses many steps, which can often be performed using a software pipeline. The first step involves hardware-specific data acquisition software, used to operate the telescopes and the instruments themselves. In principle this is not very different from the general astronomical software used for such purposes, except that the sky surveying modes tend to require a larger data throughput, a very stable and reliable operation over long stretches of time, and greater data flows than is the case for most astronomical observing. In most cases, additional flux calibration data are taken, possibly with separate instruments or at different times. Due to the long amounts of time required to complete a survey (often many years), a great deal of care must be exercised to monitor the overall performance of the survey in order to ensure a uniform data quality.
The next step is the removal of instrumental effects, e.g., flat-fielding of CCD images, subtraction of dark current for infrared detectors. Other than the sheer size of the data, this process is extremely similar to the usual astronomical observational data reduction techniques.
At this point one does some kind of automated source detection on individual survey images, be it CCD frames, drift scans, photographic plate scans, their subsections, or whatever other “raw” image format is being generated by the survey. This process requires a good understanding of the noise properties, which determines some kind of a detection significance threshold: one wants to go as deep as possible, but not count the noise peaks. In other words, maximize the completeness (the fraction of real sources detected) while minimizing the contamination (the fraction of noise peaks mistaken for real sources). Typically one aims for the completeness levels of at least 90%, and contamination of less than 10% in the first pass, and typically the source catalogs are purified further at subsequent processing steps.
Most source detection algorithms require a certain minimum number of adjacent or connected pixels above some signal-to-noise thresholds for detection. The optimal choice of these thresholds depends on the power spectrum of the noise. In many cases, the detection process involves some type of smoothing or optimal filtering, e.g., with a Gaussian whose width approximates that of an unresolved point source. Unfortunately, this also builds in a preferred scale for source detection, usually optimized for the unresolved sources (e.g., stars) or the barely-resolved ones (e.g., faint galaxies), which are the majority. This is a practical solution, but with the obvious selection biases, with the detection of sources depending not only on their flux, but also on their shape or contrast: there is almost always a limiting surface brightness (averaged over some specific angular scale) in addition to the limiting flux. The subject of possible missing large populations of low surface brightness galaxies has been debated extensively in the literature. The truth is that a surface brightness bias is always present at some level, whether it is actually important or not. Novel approaches to source, or more accurately, structure detection involve so-called multi-scale techniques.
Once individual sources are detected, a number of structural parameters are measured for them, including fluxes in a range of apertures, various diameters, radial moments of the light distribution, etc. , from which a suitably defined, intensity-weighted centroid is computed. In most cases, the sky background intensity level is determined locally, e.g., in a large aperture surrounding each source; crowding and contamination by other nearby sources can present problems and create detection and measurement biases. Another difficult problem is deblending or splitting of adjacent sources, typically defined as a number of distinct, adjacent intensity peaks connected above the detection surface brightness threshold. A proper approach keeps track of the hierarchy of split objects, usually called the parent object (the blended composite), the children objects (the first level splits), etc. Dividing the total flux between them and assigning other structural parameters to them are nontrivial issues, and depend on the nature of the data and the intended scientific applications.
Object detection and parameter measurement modules in survey processing systems often use (or are based on) some standard astronomical program intended for such applications, e.g., FOCAS, SExtractor, or DAOPHOT, to mention just a few of the programs often used in 1990’s. Such programs are well documented in the literature. Even if custom software is developed for these tasks, the technical issues are very similar. It is generally true that all such systems are built with certain assumptions about the properties of sources to be detected and measured, and optimized for a particular purpose, e.g., detection of faint galaxies, or accurate stellar photometry. Such data may serve most users well, but there is always a possibility that a custom reprocessing for a given scientific purpose may be needed.
At this point (or further down the line) astrometric and flux calibrations are applied to the data, using the measured source positions and instrumental fluxes. Most surveys are designed so that improved calibrations can be reapplied at any stage. In some cases, it is better to apply such calibration after the object classification (see below), as the transformations may be different for the unresolved and the resolved sources. Once the astrometric solutions are applied, catalogs from adjacent or overlapping survey images can be stitched together.
Object classification, e.g., as stars or galaxies in the visible and near-IR surveys, but more generally as resolved and unresolved sources, is one of the key issues. Classification of objects is an important aspect of characterizing the astrophysical content of a given sky survey, and for many scientific applications one wants either stars (i.e. , unresolved objects) or galaxies; consider for example studies of the Galactic structure and studies of the large-scale structure in the universe. More detailed morphological classification, e.g., Hubble types of detected galaxies, may be also performed if the data contain sufficient discriminating information to enable it. Given the large data volumes involved in digital sky surveys, object classification must be automated, and in order to make it really useful, it has to be as reliable and objective as possible, and homogeneous over the entire survey.
In most cases, object classification is based on some quantitative measurements of the image morphology for the detected sources. For example, star-galaxy separation in optical and near-IR surveys uses th fact that all stars (and also quasars) would be unresolved point sources, and that the observed shape of the light distribution would be given by the point-spread function, whereas galaxies would be more extended. This may be quantified through various measures of the object radial shape, e.g., moments of the light distribution in various combinations. The problem of star-galaxy separation thus becomes a problem of defining a boundary in some parameter space of observed object properties, which would divide the two classes. In simplest approaches such a dividing line or surface is set empirically, but more sophisticated techniques use artificial intelligence methods, such as the Artificial Neural Nets or Decision Trees (artificial induction software). They require a training data set of objects for which the classification is known accurately from some independent observations. Because of this additional information input, such techniques can outperform the methods where survey data alone are used to decide on the correct object classifications.
There are several practical problems in this task. First, fainter galaxies are smaller in angular extent, thus approaching stars in their appearance. At the fainter flux levels the measurements are noisier, and thus the two types of objects become indistinguishable. This sets a classification limit to most optical and near-IR surveys, which is typically at a flux level a few times higher than the detection limit. Second, the shape of the point-spread function may vary over the span of the survey, e.g., due to the inevitable seeing variations. This may be partly overcome by defining the point-spread function locally, and normalizing the structural parameters of objects so that the unresolved sources are the same over the entire survey. In other words, one must define the unresolved source template which would be true locally, but may (and usually does) vary globally. Furthermore, this has to be done automatically and reliably over the entire survey data domain, which may be very heterogeneous in depth and intrinsic resolution. Additional problems include object blending, saturation of signal at bright flux levels, detector nonlinearities, etc.
The net result is that the automated object classification process is always stochastic in nature. Accuracies better than 90% are usually required, but accuracies higher than about 95% are generally hard to achieve, especially at faint flux levels.
In other situations, e.g., where the angular resolution of the data is poor, or where nonthermal processes are dominant generators of the observed flux, morphology of the objects may have little meaning, and other approaches are necessary. Flux ratios in different bandpasses, i.e. the spectrum shape, may be useful in separating different physical classes of objects.
Survey Archive Software
Once all of the data has been extracted from the image pixels by the survey pipeline software, it must be persisted in order to facilitate scientific exploration. Basically, this data archiving can take one of two forms: raw data access through the web or some suitable storage and distribution medium (e.g., CD-ROMs or data tapes), or utilization of a database system designed specifically to handle a given digital sky survey archive. The former storage technique, while considerably less expensive, is certainly not optimal for any real analysis, especially for very large data volumes. On the other hand, using a database system provides significant advantages (e.g., powerful query expressions) limited primarily by how much a survey can afford. Currently, most surveys are accessible from the Internet, whether it is a simple ftp location or a full featured, web-accessible, query engine.
While certainly flexible and generally easy to establish, web accessible data is subject to limitations on bandwidth. Despite technological advances which promise to ease such concerns, the rapid growth in available data will continue to swamp available resources. To illustrate this bandwidth problem, for a typical building network (e.g., shared Ethernet at 10 Mbit/s), it would take nearly a week and half to sift through a Terabyte of data (which is the current benchmark for large sky surveys), and this assumes a dedicated bandwidth. Even at fast SCSI speeds (e.g., 100 Mbit/s), it would take approximately one day to merely move the data of interest.
Each archival center is presented with the challenging problem of storing and serving vast amounts of complex data. Currently the majority of the software written for these applications is in either C++ or Java, while the actual data is transferred via ASCII, FITS, or XML. Recently, many of the major data centers have begun to work on sharing knowledge and expertise in order to simplify the development process, as well as improve the overall efficacy of astronomical archives. This work is leading to standards which dictate how archives can communicate with each other, how archives can describe themselves (i.e. their metadata, or data that describes the data), how archives can transfer large amounts of dynamic information, and how sources in different archives can be cross-identified.
In general, the data processing flow is from the pixel (image) domain to the catalog domain (detected sources with measured parameters). This usually results in a reduction of the data volume by about an order of magnitude (this factor varies considerably, depending on the survey or the data set), since most pixels do not contain statistically significant signal from resolved sources. However, the ability to store large amounts of digital image information on-line opens up interesting new possibilities, whereby one may want to go back to the pixels and remeasure fluxes or other parameters, on the basis of the catalog information. For example, if a source was detected (i.e. cataloged) in one bandpass, but not in another, it is worth checking if a marginal detection is present even if it did not make it past the statistical significance cut the first time; even the absence of flux is sometimes useful information!
The two most common types of database management systems used within astronomy are relational-based (where data are manipulated as tables), and object-based (where data is manipulated individually as objects). Each of the two methods have working sites which demonstrate the technology in action(e.g., the 2MASS project uses Informix, while the GSCII project uses Objectivity). In general, relational systems offer more features including third-party add-ons, and powerful query mechanisms due to their dominant position in the business world. On the other hand, object-based systems have shown higher performance and better potential for scaling to extremely large data sets (e.g., CERN is developing an object-based persistence solution to multi-Petabyte archives).
Regardless of how the data is actually persisted, with the advent of the Internet, essentially all archives are Web accessible. This trend away from tabular or media based archiving produces datasets which are distributed in nature, allowing users and tools equal access to vast amounts of data, which in the past were nearly impossible to efficiently query. As a result, astronomical data is now able to be utilized in a more democratic fashion resulting in uses which the survey institutions did not even imagine.
Scientific Analysis and Exploration
The end goal of digital sky surveys is to enable scientific investigations. In some cases, the goals are so specific that the best approach is to use analysis software designed and optimized to tackle them, e.g., as in the studies of the cosmic microwave background, in gravitational microlensing experiments, etc. However, most of the modern survey data sets are so information-rich, that a wide variety of different scientific studies can be done with the same data. This entails some general tools for the exploration, visualization, and analysis of large survey data sets.
The tools which will be utilized with the new datasets will need to employ cutting-edge techniques from computer science. For example, clustering techniques to detect rare, anomalous, or somehow unusual objects, e.g., as outliers in the parameter space, to be selected for further investigation (i.e. follow-up spectroscopy). Other examples include genetic algorithms to improve current detection and supervised classification methods, new data visualization and presentation techniques, which can convey most of the multidimensional information in a way more easily grasped by a human user, and the use of semi-autonomous AI or software agents to explore the large data parameter spaces and report on the occurrences of unusual instances or classes of objects.
The nature of sky surveys and the resulting data sets dictates the kinds of science one may wish to do with them. For example, most surveys would cover a large solid angle, but not go as deep as the typical “pointed observations”. This, in turn, drives the kinds of data analysis software needed for their scientific exploration. Broadly speaking, the kinds of astronomical investigations for which surveys are well suited include the following:
- Multiwavelength Astronomy
-
Combining surveys done at different wavelengths, for a more panchromatic view of the universe. Typically, optical IDs are needed for most of the follow-up work. An obvious example are the optical identifications of radio or x-ray sources. A typical basic software requirement is efficient and accurate matching of sources detected in different wavelengths. If positional accuracies and source densities in matched surveys are comparable this is a relatively straightforward task; however, if either of these two conditions is not satisfied, more sophisticated algorithms may be needed to assign matching probabilities to multiple candidates. These techniques can generally be optimized for certain classes of sources by utilizing as much a priori knowledge as possible.
- Statistical Astronomy
-
Studies of the large-scale structure (if one detects galaxies in copious numbers), or studies of the Galactic structure (if one detects stars in copious numbers). The sheer numbers of detected sources make the Poissonian fluctuations unimportant, but systematic errors may limit the results. Accurate and uniform flux calibrations and source classifications are essential for such applications, and possible biases should be modeled. In addition, the sheer size of most surveys allows for further subdivision of various analysis (e.g., by morphological or spectral type) for more specific results.
- Rare Object Searches
-
Searches for rare types of objects or groups of objects, whose frequency of occurrence is so low that huge input source catalogs are necessary in order to find them. This “needle in a haystack” search is facilitated by the vast number of sources in current surveys (i.e. a one in a million object would appear a thousand times in a billion source survey). Typically such rare objects are found as outliers in some parameter space, e.g., colors: the bulk of “ordinary” sources (normal stars, galaxies, etc. ) would form well-defined clusters in the parameter space of observables, and some rare or peculiar types of objects may be found away from them. Unsupervised classification and cluster analysis techniques may be especially useful for this task. This data-mining also facilitates significantly higher efficiencies in performing follow-up spectroscopy of unusual objects. We note that rare objects may belong to known classes (e.g., distant quasars, brown dwarfs, etc.), which can be known to occupy some a priori determined portion of the given parameter space. Alternatively, there may be previously unknown or unexpected types of objects discovered in this manner.
Future Directions
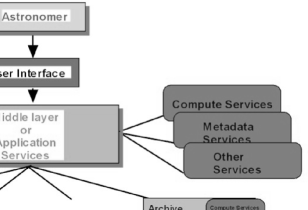
Astronomy finds itself at an interesting time, as several, large area, digital sky surveys are currently underway. In the future, the number of such surveys, as well as the wavelength coverage, will only continue to increase, providing temporal as well as spatial coverage of the sky. This flood of data necessitates a new approach to data handling – a virtual observatory (see Figure 1). Individual surveys are important in their own right, but the federation of multiple, cross-wavelength digital surveys provides a tremendous opportunity to truly quantify the origins of stars, galaxies and the universe itself.
This future situation provides the opportunity to adopt a new research paradigm for studying the heavens, as the ability to perform cutting edge research will not be restricted to those fortunate enough to have access to the best facilities. Instead, anyone who has the diligence and ability to sift through the avalanche of data can perform novel science.
Further Readings
The field of large digital sky surveys, the related software methodologies, and the new astronomy they enable are developing very rapidly as of this writing (late 1999). There are thus no standard texts or reviews, and whatever articles do exist tend to become obsolete very quickly. Probably the best way to find more up to date information is through the World Wide Web (and the Interested Reader will know how). While many web sites can be somewhat ephemeral, we suggest one which will provide a number of useful links in this field, and which we hope will be active throughout the useful shelf life of this Encyclopedia: http://www.digital-sky.org
Another possibility is conference proceedings on this and related subjects, e.g., the series of volumes on “Astronomical Data and Software Systems”, published by the Astronomical Society of the Pacific in their Conference Series. A number of useful papers can also be found in the proceedings of IAU Symposium 179, “New Horizons From Multi-Wavelength Sky Surveys”, eds. B.J. McLean et al. , Dordrecht: Kluwer Academic Publ. (1998).
An example of a particular software system for processing of digital sky surveys is described by Weir, N., et al. 1995, Publ. Astron. Soc. Pacific 107, 1243.
S. George Djorgovski
Robert J. Brunner