[
Measuring Supernova Neutrino Temperatures using Lead Perchlorate
Abstract
Neutrino interactions with lead produce neutrons in numbers that depend on neutrino energy and type. A detector based on lead perchlorate, for example, would be able to measure the energy deposited by electrons and gammas in coincidence with the number of neutrons produced. Sorting the electron energy spectra by the number of coincident neutrons permits the identification of the neutrino type that induced the reaction. This separation allows an analysis which can determine the temperatures of and from a supernova in one experiment. The neutrino reaction signatures of lead perchlorate and the fundamentals of using this material as a neutrino detector are described.
pacs:
PACS numbers: 97.60.Bw, 25.30.Pt]
I Introduction
Recently a number of groups have expressed interest in using Pb as a target for neutrino interactions to study supernovae[1, 2] or oscillations[3], and this inspired an estimate of the cross section[1]. The interest arises because of the large cross section and the low relative cost of Pb. As a result, additional cross section calculations were done recently by Fuller, Haxton, and McLaughlin[4] (hereafter referred to as FHM) and Kolbe and Langanke[5, 6] (hereafter referred to as KL).
The interesting neutrino interactions with Pb consist of
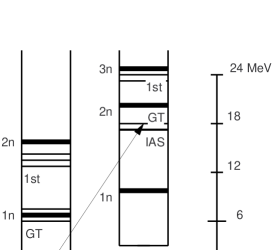
Fig. 1 shows the energetics of these transitions. The number of neutrons emitted (0, 1, or 2) depends on the neutrino energy and whether the transition is induced by a charged current (CC) or neutral current (NC) interaction. The nuclear physics of this system is described in detail in Refs. [4, 6].
An ideal lead-based neutrino detector would have an appreciable density of lead atoms and the capability of detecting the electrons, gammas and neutrons produced in the reaction. Lead perchlorate (Pb(ClO4)2) has a very high solubility in water (500 g Pb(ClO4)2/ 100 g H2O [7]) and the mixture is transparent. This transparency raises the hope that a erenkov detector can be assembled. Additionally, the presence of a neutron moderator (hydrogen) and a neutron capture nucleus (35Cl) provides a method for observing the neutrons. The high-energy (8.6 MeV), neutron-capture rays from Cl would Compton scatter in the fluid and be observed via the erenkov light of the recoil electrons.
Supernovas emit on the order 1058 of all types. The average energies of neutrinos emitted by a supernova follow a hierarchy: where indicates either or neutrinos and their anti-particles. The predicted values of the average energies for the three neutrino classes differ a great deal and are estimated to be MeV, MeV, and MeV[8, 9].
Although not strictly thermal, the supernova neutrino energy spectra can be described well by a thermal distribution,
where is the normalized neutrino spectral shape, is an effective neutrino temperature, is the neutrino energy, and is the degeneracy parameter (chemical potential divided by ). For and , the supernova model predictions for the flux is well fit with = 3, whereas for the flux is better described with = 0. The normalization factor has the values = 1.803 and = 18.969. The total neutrino fluence from a supernova can be estimated by
where is the released energy and D is the distance to the supernova.
The supernova spectrum is too soft to produce a large number of multiple-neutron inverse-beta-decay events in Pb. However, if the higher energy oscillate into , the hardening of the spectrum will greatly alter the expected number of 2-neutron events[4]. Thus the response of a Pb detector is intriguing because if T is found to be larger than T, it would be strong evidence that neutrino oscillations are taking place. However, the uncertainties in the neutrino energy distribution as predicted by the supernova models may complicate the interpretation of a measurement of the spectral parameters.
The FHM paper demonstrated that the NC and CC interaction rates in Pb are sensitive probes of , , and . This paper further discusses the details of studying supernova neutrinos with Pb. In particular the use of the added data arising from observing the product electrons and gammas in coincidence with neutrons is described. These data permit the separation of the NC and CC rates and a further division of CC and events. This collection of data can be interpreted in terms of the 3 temperatures of interest. The CC event division is discussed here in detail. Although any Pb-based experiment that measures electrons, gammas and neutrons might apply the techniques described herein, the example of using lead perchlorate as a target material is discussed.
II Physical and Optical Properties
| Isotope | |||
|---|---|---|---|
| Pb | |||
| 204Pb | |||
| 206Pb | |||
| 207Pb | |||
| 208Pb | |||
| Cl | |||
| 35Cl | |||
| 37Cl | |||
| O | |||
| 16O | |||
| 17O | |||
| 18O | |||
| H | |||
| e- |
To build a reasonably large detector viewed by photo-multiplier tubes from the periphery, the attenuation of the erenkov light must be minimal. Therefore the transmission of light through the medium is critical. To understand the transmission, measurements were made at several wavelengths through several concentrations of Pb(ClO4)2[10]. The maximum achievable transmission is still under study with attentuation lengths exceeding 2.5 m having been measured in an 80% solution. A large mass detector may require segmentation to minimize adverse effects from light loss.
The erenkov response of the medium depends on the index of refraction, which for Pb(ClO4)2 is 1.5 for an 80% solution by weight. The density of this solution is 2.7 g/cm3, the corresponding 208Pb number density is /cm3 and the hydrogen number density is /cm3. Some additional pertinent data for Pb(ClO4)2 are given in Table I.
The number of erenkov photons emitted by an energetic electron in Pb(ClO4)2 is about 185/cm[11] in the wavelength region of interest for phototubes. The stopping power of 80% (50%) Pb(ClO4)2 is about 0.2 cm/MeV (0.33 cm/MeV). Hence a 15 MeV electron will emit a total of about 550 (920) photons in 80% (50%) Pb(ClO4)2. Due to the modest light yield, the resolution (20%) will be modest. The resonance widths will also contribute an uncertainty in relating the electron energy to the incoming neutrino energy by a comparable amount (few MeV).
Because solutions of Pb(ClO4)2 contain a great deal of water and Cl, the neutron thermalization and capture time is of the order of 10-100 s. This time scale is short compared to the detection rate during a supernova, but long enough to identify whether there are 0, 1, or 2 neutrons in coincidence with a primary e- or .
III Cross Section Models
The FHM[4] paper pointed out the importance of the 208Pb - cross section and the production of neutrons. They noted that the total number of neutrons produced by neutrino interactions with Pb is sensitive to the effective temperature of the supernova energy spectrum especially for reactions which produce multiple neutrons. However, they did not consider detection schemes that could measure the energy released in the form of electrons and gamma rays (hereafter referred to as the electromagnetic energy). Neutral current events release a large number of neutrons but very little electromagnetic energy. Hence NC events can be isolated from CC events by measuring the electromagnetic energy in coincidence with the neutrons.
The papers by FHM and KL provided effective cross sections for neutrino-lead interactions averaged over the neutrino energy spectra and summed over all the product nucleus states. It is just these distributions, however, which are needed to simulate the response of a detector and to optimize its design parameters. This section summarizes the nuclear physics model implemented to calculate these distributions. In the following section, these distributions and their use in analyzing the neutrino spectra are described.
| Transition | Product Nucleus | Fraction | Fraction | Fraction |
|---|---|---|---|---|
| Energy Level | decays | decays | decays | |
| w.r.t. Pb | with 0 n | with 1 n | with 2 n | |
| CC IAS | 17.53 MeV | 0 | 1 | 0 |
| CC GT | 17.9 MeV | 0 | 0.9 | 0.1 |
| CC first forb. | 24.1 MeV | 0 | 0 | 1 |
| NC GT | 7.32 MeV | 0.55 | 0.45 | 0 |
| NC first forb. | 14 MeV | 0 | 1 | 0 |
Specifically, the energy dependence of the five primary transitions of interest as identified by FHM is calculated: two for the NC interaction and three for the CC interaction. The parameters describing these transitions are given in Table II. For the isobaric analog state (IAS) CC and Gamow-Teller (GT) NC and CC transitions, the analytic expressions and matrix element values from Ref. [4] are used. For the first forbidden transitions, the cross section can not be written in closed form. Software to calculate that contribution to the cross section as used by FHM was obtained[18] and hence the cross section calculations presented here agree with FHM by design.
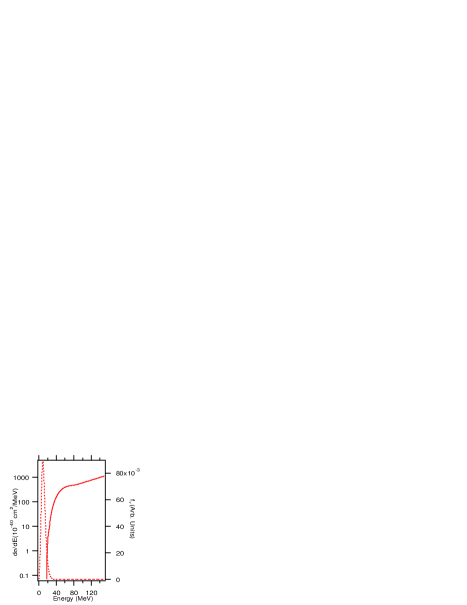
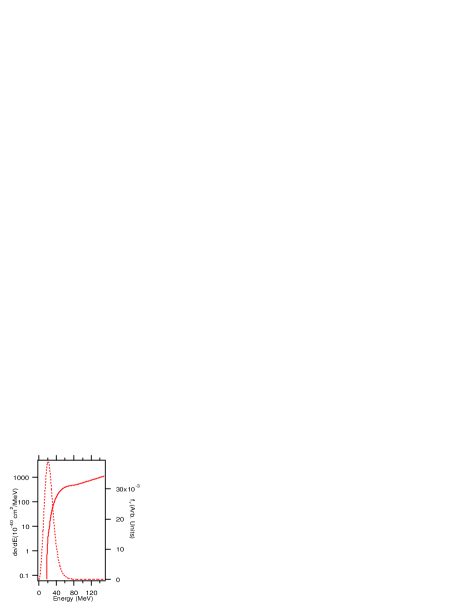
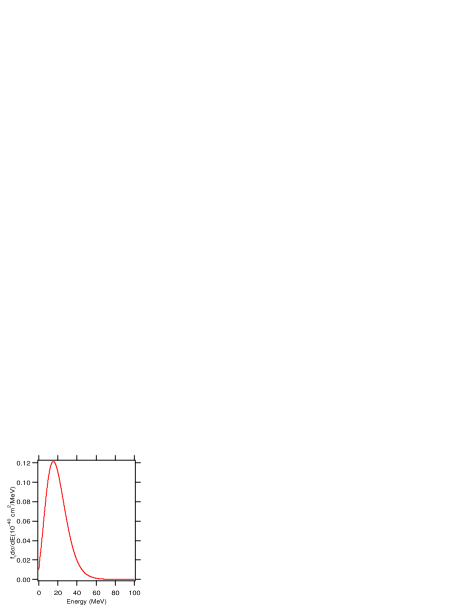
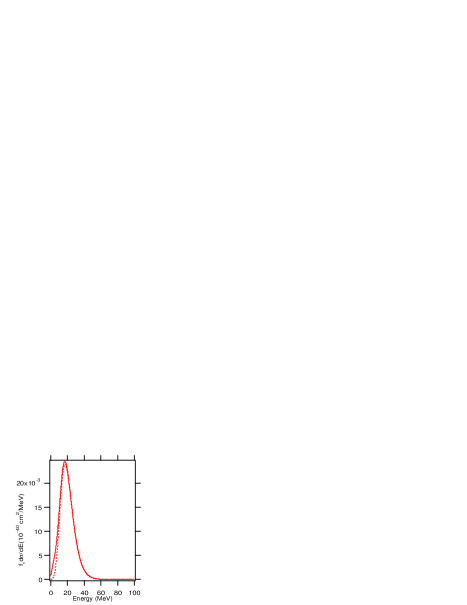
Figure 2 shows the cross section overlaid on a normalized thermal flux distribution (=2.76 MeV, =3). Figure 3 shows the same for a higher neutrino temperature (=6.27 MeV, =3). The origin of the large increase in the interaction rate with temperature is clear from a comparison of these plots. The onset of the Pb cross section lies between these two temperature extremes. As a result, the interaction rate in Pb is highly sensitive to . This is especially true for the first forbidden transition which leads to the emission of 2 neutrons.
| Isotope | At 30 MeV | DAR | SN |
|---|---|---|---|
| 208Pb()X | 31. [5], 44a | 59.6[6] | 34.[6], 47.5[4] |
| 37Cl()37Ar | 1.0 [12] | ||
| 35Cl()X | 0.62[4] | ||
| 35Cl()X | 0.14[4] | ||
| 16O()X | 0.01 [13] | 0.11b [13] | |
| 16O()X | 0.03[5] | ||
| D()X | 0.41 [14] | 0.53 [15] | 0.4[14] |
| H()n | 0.6[16] | 0.5 | |
| (e,e’) | 0.003 [17] | 0.0023b [13] |
Tables III and IV show some cross sections and relative interaction rates for the various components of Pb(ClO4)2. It is clear that the interactions with Pb and H dominate. Contributions from Cl, O, and elastic scattering of electrons are at the few percent level. The CC interaction of on protons is a major contribution because the hydrogen density is large in Pb(ClO4)2 solutions. For other isotopes found in Pb(ClO4)2 but not listed in the table, FHM note that the cross section models vary like N-Z or NZ/A. For Pb, these dependencies are small for the naturally occurring isotopes. Hence one can anticipate that their response to neutrinos will be similar. This is not the case for Cl. However, the difference in cross section between 35Cl and 37Cl is still probably smaller than other uncertainties and thus the Cl interaction rate is small.
| Element | |
|---|---|
| 208Pb(,e) | |
| 37Cl(,e) | |
| 16O(,e) | |
| H()n | |
| (e,e’) |
IV The Electromagnetic Energy
A detector based on lead perchlorate would be able to measure the energy deposited by e- and in coincidence with the number of neutrons produced. The energy deposited in the detector due to e- and is here referred to as the electromagnetic energy to contrast it with that resulting from neutron capture. To identify a particular class of neutrinos, one sorts the electromagnetic energy spectra by the number of coincident neutrons. CC events always produce an electron which can have substantial energy in coincidence with neutrons. NC events produce either a high-energy with no neutrons or neutrons with little or no energy.
First consider the separation of NC from CC events. The product nucleus from the neutrino interaction can produce 0, 1, or 2 neutrons. (Particle decays other than neutrons (alphas and protons) of the product nucleus states have a much lower branching ratio (see KL) and are ignored here.) When the interaction does produce a neutron, the neutrons carry away the available energy and there is little electromagnetic energy produced. Hence for the NC events, the electromagnetic energy is only appreciable when 0 neutrons are emitted. Thus events which do have appreciable electromagnetic energy in coincidence with neutrons are indicative of 208Pb - or H - CC interactions.
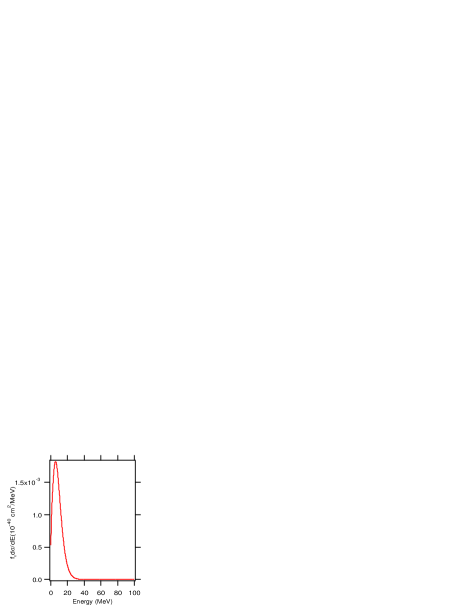
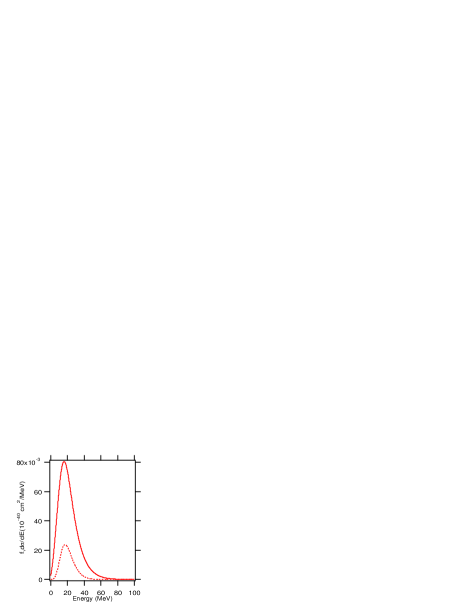
Next consider the separation of the CC events into or events. The 2-neutron event rate is dominated by -induced CC transitions to the first forbidden level in Bi. Since the electromagnetic energy for the CC reactions is related to the incoming neutrino energy, the 2-neutron event spectrum provides data on the incident energy spectrum. In contrast, the IAS and GT transitions induced by produce mostly 1-neutron events. Furthermore, although do not have an appreciable CC cross section on Pb, they have a large cross section on H. The 1-neutron spectrum is therefore generated by reactions induced by and . But those are the only reactions that contribute significantly to the 1-neutron electromagnetic energy spectrum and therefore the 1-neutron spectrum provides data on the energy distribution. The 2-neutron and 1-neutron spectra thus relate directly to the spectral features of the incident neutrino flux. Figs. 4 through 7 show spectra of the electromagnetic energy for events in coincidence with 1 or 2 neutrons for two different neutrino energy distributions. These spectra have been convolved with an estimate for the detector resolution.
For NC events, only GT excitations can produce an event with no neutrons as the resonance straddles the neutron separation energy. A ray of approximately 7.3 MeV is then emitted. This would produce a line in the 0-neutron electromagnetic energy spectrum. NC transitions can also produce 1-neutron events and a modest number of 2-neutron events. As there will be little electromagnetic energy in coincidence, the 1-neutron events will be interpreted as an 8.6-MeV line in the 0-neutron spectrum. The strengths of these two lines in the 0-neutron spectrum provide a measure of the NC rate. Due to the resolution, these two lines will most likely be blended. These rates will be large even for low-temperature profiles.
One background to the CC 1-neutron spectrum comes from 2-neutron NC events. One of the 2 neutrons would be taken as a neutron but the second would be mistaken for electromagnetic energy. For =6.27, =2.76, =3, the NC rate of 2-neutrons events will be comparable to the CC rate[4, 6] because, although the NC cross section is much smaller, there are 4 times as many as and their temperature is much higher. Thus at low , this background must be separated. Note that because there are several sharing the energy and photons Compton scatter more than once before losing all their energy, the erenkov light produced by neutrons capturing on Cl will be isotropic in comparison to electrons from inverse beta decay. This could lead to a technique for separating this background. Otherwise an electromagnetic energy threshold of 10 MeV would eliminate it.
With the spectra in hand, one deduces the temperature by relating it to the average electromagnetic energy from the 1-neutron spectrum () and the 2-neutron spectrum () (Fig. 8). One also counts the total number of 1-neutron events () and 2-neutron events () in these spectra (Fig. 9). The ratio (R=/) depends strongly on the temperatures of the two types of neutrinos but is insensitive to uncertainties in the supernova distance scale. Using these parameters (, , , , R), the pair of neutrino temperatures that fit the data are determined.
If the electron neutrino temperature is clearly greater than that of the electron anti-neutrino temperature, it would be considered strong evidence for or oscillations. This condition is satisfied by the top left hand section of these two-temperature plots. It should be noted that the contour plots were done for thermal spectra. If oscillate, the spectral shape could be complicated depending on the oscillation conditions and this analysis would have to be extended.
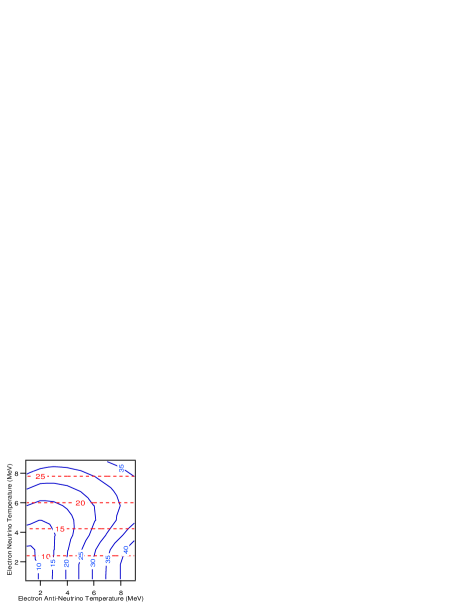
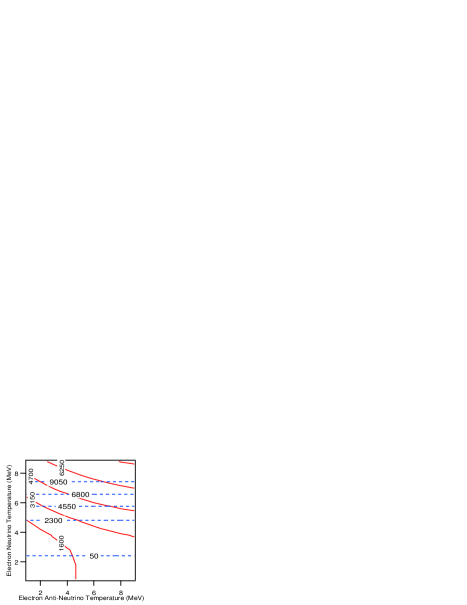
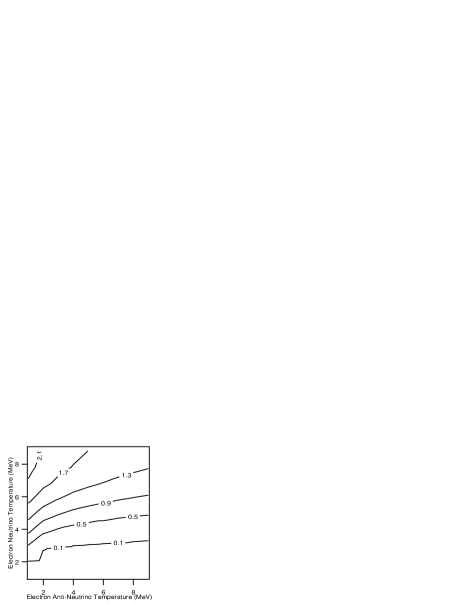
To use this set of figures to determine the temperatures with some precision, one must estimate the uncertainty in the measured parameters. These uncertainties are mostly determined by the number of events observed. Regions in Figs. 8 through 10 are defined by the values of these parameters and their uncertainties. The boundaries of these regions indicated on the axes provide the corresponding temperature ranges that describe the data. For a commonly considered supernova at 10 kpc with ergs of released energy and a 10 kt-Pb detector (24 kt of lead perchlorate), one expects to measure = 11.0 0.5 MeV, = 19.6 0.2 MeV, = 1530, = 82, and R = 0.053 0.006 for non oscillating spectra ( = 2.76, = 3, = 11; = 4.01, = 3, = 16). The uncertainties for the average energies were estimated by calculating the variance of the distribution and dividing by the square root of the number of observed counts. The resulting statistical uncertainty in the temperatures is small and the precision improves if is larger because the event rate is higher.
V Summary
The Sudbury Neutrino Observatory (SNO)[19] and Super-Kamiokande[20] experiments are operating. In the event of a supernova, Super-Kamiokande will observe a large number of -H events ( for = 4.01, = 3) and SNO will see a number of -D events ( for = 2.76, = 3). The average energy measured for these two reactions could be compared in a two-temperature plot in a similar analysis as described above. Due to the smaller number of events, the uncertainty comparing these energy distributions would be determined by the SNO measurement. For these temperatures, a 24 kt Pb(ClO4)2 experiment would count a number of 2-neutron events comparable to the number of SNO D(,e-)pp events. Thus the average energy analysis of a Pb(ClO4)2 experiment would have a sensitivity similar to the SNO-SK comparison. But the total number of counts in a Pb(ClO4)2 experiment is much more sensitive to the neutrino temperatures. SNO (Pb(ClO4)2 ) would observe about 3 (60) times as many D(,e-)pp (2-neutron) events at = 6 than at 2.76 MeV. This extra handle on the data adds a powerful redundancy to the analysis.
It is obvious from Table V that there are still large uncertainties in the nuclear physics of these interactions. Furthermore, reactions on the other Pb isotopes have not been considered although they would tend to increase the signal. Therefore the response of such a detector should be measured in a prototype. The spectrum from stopped decay is comparable to that from supernovae. So the 2-neutron and 1-neutron spectra could be measured at a beam stop facility [21] without the influence of . Since the -proton reaction is well understood, it does not need additional study and the measurement would focus on what is currently poorly known: the nuclear physics parameters of the lead reactions. Thus the theoretical uncertainties in the cross section could be diminished by a beam stop experiment.
The details of the analysis presented in this paper will alter as the nuclear physics of this system becomes better known. But the general conclusions generic to lead detectors will not. It is very powerful to measure not just the total number of neutrons produced but the 2-neutron and 1-neutron rates separately. Furthermore the observation of electrons and gamma rays in coincidence with the neutrons can permit the separation of NC and CC interactions. If one observes a supernova with a Pb detector, these combinations of data can be analyzed to estimate the temperatures of the neutrino spectra.
| Transition and | FHM | KL |
| spectral input | ||
| Pb(,e)X =4.0 MeV, =3. | 6.9 | 6.7 |
| Pb(,e)X =8.0 MeV, =0. | 58 | 43 |
| Pb(,’)X =4.0 MeV, =3. | 0.66 | 0.23 |
| Pb(,’)X =8.0 MeV, =0. | 4.5 | 1.4 |
| Pb(,e)X decay at rest | 91a | 59.6 |
VI Acknowledgements
I would like to thank Peter Doe, Hamish Robertson, Thomas Steiger, John Beacom, Edwin Kolbe, Gail McLaughlin and George Fuller for useful conversations. I am especially grateful to Wick Haxton for providing code to estimate the first forbidden transition cross section. This research was support by the Department of Energy, grant number DE-FG03-97ER41020.
REFERENCES
- [1] C. K. Hargrove, et al., Astropart. Phys. 5, 183 (1996).
- [2] D. B. Cline et al., Phys. Rev. D50, 720 (1994); P. F. Smith, Astropart. Phys. 8, 27 (1997).
- [3] C. K. Hargrove, private communication.
- [4] George M. Fuller, Wick C. Haxton, and Gail C. McLaughlin, Phys. Rev. D59, 085005 (1999).
- [5] E. Kolbe, private communication at ”Low-Energy Neutrino Physics” program at the Institute for Nuclear Theory (INT-99-2), Summer 1999.
- [6] E. Kolbe and K. Langanke, Preprint Nucl-th/0003060.
- [7] Handbook of Chemistry and Physics, 65th edition, ed. R. C. West, (CRC Press, Boca Raton, FL, 1984).
- [8] D. S. Miller, J. R. Wilson, and R. W. Mayle, Astrophys. J. 415, 278 (1993).
- [9] H.-T. Janka and W. Hillebrant, Astron. Astrophys. J. 224, 49 (1989).
- [10] P. J. Doe, S. R. Elliott, C. Paul, and R. G. H. Robertson, Nucl. Phys. B (Proc. Suppl.) 87, 512 (2000).
- [11] C. Caso, et al., Europ. Phys. J. 3, 1 (1998).
- [12] T. Kuramoto, M. Fukugita, Y. Kohyama, and K. Kubodera, Nucl. Phys. A512, 711, (1990).
- [13] W. C. Haxton, Nucl. Instrum. Meth. A264, 37, (1988).
- [14] K. Kubodera and S. Nozawa, Inter. J. Mod. Phys. 3, 101 (1994).
- [15] S. Ying, W.C. Haxton, and E. M. Henley, Phys. Rev. C45, 1982 (1992).
- [16] P. Vogel, Phys. Rev. D29, 1918 (1984), and P. Vogel and J. F. Beacom, PR D60, 053003 (1999).
- [17] John N. Bahcall, Neutrino Astrophysics, (Cambridge U. P., Cambridge, 1989).
- [18] W. C. Haxton, private communication.
- [19] J. Boger, et al., Nucl. Instrum. and Meth. A449, 172 (2000).
- [20] Y. Fukuda, et al., Phys. Rev. Lett. 82, 2430, (1999).
- [21] F. T. Avignone et al. (the ORLaND Collaboration), in Perspectives in Nuclear Physics, eds J. H. Hamilton, H. K. Carter, and R. B. Piercy, World Scientific, 1999, p 25-34.