BeppoSAX – ROSAT PSPC observations of the Shapley Supercluster: A3562
Abstract
We present a combined analysis of the BeppoSAX and ROSAT PSPC observation of the cluster of galaxies A3562, a massive member of the core of the Shapley Supercluster. With a complex and interacting structure composed from two groups of galaxies and A3558 to the West, the surface brightness of A3562 shows excess in the sectors to East and South when compared with an azimuthally averaged model of the emission. The emission tends to be flatter, and the distribution of the gas broader, along the merging axis and in opposition to the two groups. We present the first determination of the gradients of the gas temperature and metallicity for a cluster in the Shapley region at large distance from cluster center. From an analysis of the BeppoSAX data in annuli and sectors, we observe both the profiles to be flat within 8′ ( 0.62 Mpc), with an emission-weighted values of keV and . The value of the temperature is consistent with recent ASCA measurements and is significantly higher than previous estimates obtained from ROSAT and EXOSAT. We discuss the possible reasons of this disagreement. Between 8′ and 20′, the plasma temperature declines to about 3.2 keV. When a polytropic profile is used to represent the gas temperature profile, the best fit polytropic index is . These results imply a total mass within the virial radius of , between 40 and 80 per cent lower than the optical estimate, and a gas mass fraction of about 30 per cent.
keywords:
galaxies: clusters: individual: A3562 – dark matter – X-ray: galaxies.1 INTRODUCTION
Superclusters of galaxies are the largest and more massive structures in the Universe and have a dynamical status that provides direct information on the evolution of structures formed by accretion of matter in a hierarchical bottom up scenario. Numerical simulations on scales of cosmological relevance (e.g. Cen & Ostriker 1994) reveal that merging in a Cold Dark Matter dominated Universe happen along preferential directions at whose intersection rich clusters and core of Superclusters form.
The Shapley Supercluster is a remarkable concentration of galaxies and clusters of galaxies in the nearby Universe (Raychaudhury 1989, Scaramella et al. 1989, Raychaudhury et al. 1991, Zucca et al. 1993) and presents a highly overdense core formed by three ACO (Abell et al. 1989) clusters, A3556, A3558 and A3562. This structure is elongated by in the East–West direction with a comoving size of about 15 Mpc. The size of the core region is typical for a structure that is collapsing, with A3556 and A3562 that are on the way to merge with the more massive A3558 (Metcalfe et al. 1994, Bardelli et al. 1994, Ettori et al. 1997, Hanami et al. 1999). Considering how the region is undergoing strong interaction among the component clusters, it represents an ideal place in the local Universe to investigate the dynamical status of massive structures.
For these reasons, several multiwavelength studies have been dedicated to the Shapley Concentration of galaxies since the very first observation by Shapley in 1930. In the recent years, Bardelli et al. (1994, 1998a, 1998b, 2000), Quintana et al. (1995, 1997) and Drinkwater et al. (1999) have investigated its optical properties. Venturi et al. (1997, 1998) have analyzed the radio emission from galaxies in the region and its interaction with the intracluster gas. In the X-ray energy band, analyses of the Shapley supercluster have been performed with GINGA (Day et al. 1991), Einstein (Raychaudhury et al. 1991, Breen et al. 1994), pointed (Ettori et al. 1997) and All-Sky Survey (Kull & Böhringer 1999) ROSAT PSPC observations and ASCA (Hanami et al. 1999) data to describe both spectroscopically and spatially its extended emission.
In particular, the study of the distribution of the hot plasma in the X-ray waveband within each cluster and its environment can provide detailed informations on the merging history of the Shapley Supercluster. A detailed analysis of the most massive cluster, A3558, was based on spatial and spectral analysis of a ROSAT PSPC observation (Bardelli et al. 1996) and ASCA spectra (Markevitch & Vikhlinin 1997). From ASCA data, Hanami et al. (1999) have proposed a scenario of the evolution sequence of the clusters in the Shapley Supercluster, from an ongoing merger (SC1329-313), to a post-merger cluster (A3556), to the relaxed poor cluster (SC1327-312) and to the rich clusters with mergers in succession (A3558 and A3562). Kull & Böhringer (1999) have found evidences of a physical filamentary structure of hot gas embedding the three clusters (A3558, A3556, A3562).
The scenario of the merging evolution of the A3558-A3556-A3562 structure, as the remnant of a cluster-cluster collision seen just after the first core-core encounter, is also supported from an analysis of galaxy colors and substructures in Bardelli et al. (1998b).
With the present work, we start an investigation of the members of the core of the Shapley Supercluster combining the spatial resolution of ROSAT PSPC with the higher spectral capabilities of the Italian-Dutch satellite BeppoSAX .
We present in Table 1 the X-ray observations of A3562 discussed in this work. The ROSAT PSPC data were retrieved from the archive, while the BeppoSAX observation has been our AO2 target. All the errors quoted are at the 68.3 per cent confidence level () unless otherwise stated. Hereafter, we assume a cosmological model with a Hubble constant, , of km s-1 Mpc-1, the density parameter, , equal to 1 and . Therefore, corresponds to a proper radius of 78 kpc at the redshift of A3562 of (Bardelli et al. 1998a).
The paper is organized as follows: in Section 2, we discuss the spatial morphology of the X-ray emission from A3562 and the results of the spectral analysis using the ROSAT PSPC observation; in Section 3, the BeppoSAX spectra are analyzed. The constraints on the masses obtained from the observed gas temperature profile are presented in Section 4. Finally, we discuss the main conclusions of this work in Section 5.
| Satellite | Detector | Band | Date | Exposure (ksec) |
| ROSAT | PSPC B | 0.1–2.4 keV | 1993 Jan 19 | 20.2 |
| BeppoSAX | LECS | 0.1–4 keV | 1999 Jan 31 | 18.9 |
| BeppoSAX | MECS 2+3 | 2–10 keV | 1999 Jan 31 | 45.9 |
2 ROSAT PSPC data
The ROSAT (the ROentgen SATellit, Trümper 1983) Position Sensitive Proportional Counter (PSPC) has a field of view with a diameter of and is divided by the ribs into (i) an unobscured central circular region of 20 arcmin in radius, and (ii) an outer annulus sectioned in eight equal sectors. The FWHM of the on-axis Point-Spread-Function (PSF) is of about 25 arcsec. The energy resolution of the PSPC is (FWHM) over the entire sensitive area of the detector and in the energy band 0.1–2.4 keV.
The reduction and analysis of these data have made use of the Ftools version 4.2 package, Xselect 1.4b and Xspec 10.00 (Arnaud 1996).
2.1 Spatial analysis
The PSPC images with pixel size of 15″have been constructed from counts in the 0.5–2 keV band, where the Galactic and particle background are minimum, after correction for instrumental and telemetry dead time, and exclusion of times of high background counts. The total livetime is 16,597 seconds. We also require the Master Veto count rate to be less than 170 counts s-1 (cf. guidelines for reduction of PSPC data in Snowden et al. 1994). Using the ROSAT Interactive Data Language (IDL) user-supplied libraries, we have divided the images by the respective exposure maps in the same energy band and corrected them for vignetting and exposure-time. The region of the detector support rib has been masked out as well all detected point sources.
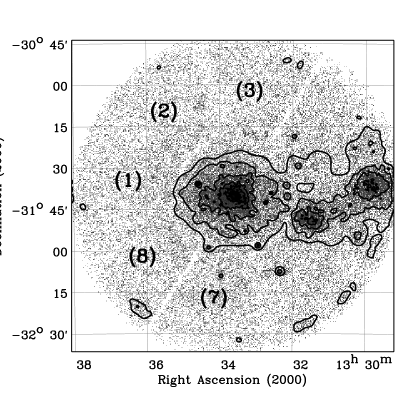
The raw image has been smoothed in IDL with an adaptive kernel method, ASMOOTH (Ebeling, White & Rangarajan 1999), using a Gaussian kernel with size between 0.2 and 74.8 pixels and a characteristic smoothing threshold of 5 times the map of the local background (Fig. 1). The contoured image shows clearly the interactions in act between A3562 and the two groups westwards.
The local background (and the respective error) is estimated from the average of the counts in the three exposure-corrected -sectors located eastward (cf. Sectors 1, 2 and 8 in Fig. 1), in opposition to the two groups, between 40′ and 45′ from the X-ray emission center (RA, Dec) = 13h 33m 355, –31°40′05″. The choice of these Sectors is driven from the necessity to reduce the contamination from the extended sources to the West that seems to affect 5 out of 8 sectors in different proportion (see Table 2).
We measure an average local background of cts s-1 arcmin-2. The background map is then the product of this value with the exposure map calculated in the same energy band, 0.5–2.0 keV.
| Sector | bkg ( cts s-1 arcmin-2) |
|---|---|
| 1 | |
| 2 | |
| 3 | |
| 4 | |
| 5 | |
| 6 | |
| 7 | |
| 8 |
To characterize the azimuthal deviations in the X-ray surface brightness, we have represented the azimuthally averaged profile with a -model (Cavaliere & Fusco-Femiano 1976):
| (1) |
We have binned the profile in bins with width of 30 arcsec and used the local average background. The radial profile is extracted up to the outer radius, Mpc, defined as the last radial bin where the signal to noise ratio is above 2. The best-fit results over the radial range 0–1.51 Mpc provide a core radius, , equals to arcmin, or Mpc, and ( with 36 d.o.f.). The errors are at the 68.3 per cent confidence level () and are obtained from the distribution of 500 repetitions of the fitting process applied to a surface brightness profile randomly generated from the original one and taking into account the Poisson error in each radial bin. These results are consistent with previous measurements (see, e.g., Mohr, Mathiesen & Evrard 1999, Neumann and Arnaud 1999). Moreover, we find evidence of elongation of the surface brightness when the two dimensions distribution is analyzed. Fitting the distribution with an elliptical King profile, we find an axial ratio of about 0.75 with a position angle of 190 degree (clockwise from 0 degree at West). Using a single core radius, the two dimensional fit is consistent with the one dimensional radial fitting discussed above.
In Fig. 2, we investigate the residuals (significant at the 95 per cent confidence level) obtained when the original raw image, , is compared with a cluster, , simulated by using the best-fit results obtained from the model added to the local background. Both and are in counts pixel-1. The significance of the residuals is assessed in terms of a distribution (see Press et al. 1992, p. 614):
| (2) |
where and are the numbers of pixels in the rows and columns in the selected sectors of 225 in annular circular bins of 1.5 arcmin.
The model of the azimuthally averaged surface brightness can account for about 98 per cent of the total flux from the central 19′-radius region. We individuate three main deviations from this circular model: (i) the core region, which is affected from the presence of a small cooling flow of year-1 (Peres et al. 1998) and from its elliptical shape; (ii) a slice pointing to South-West, along the axis between A3562 and SC1329-313; (iii) a region to East, starting 5 arcmin away from the X-ray center and extending outward, that produces an excess of about 3.3 per cent of the total flux, or a luminosity of about erg s-1 at the redshift of the cluster.
To investigate through a -model the characteristics of the azimuthal profiles, we have extracted the surface brightness profiles from eight 45°-sectors enclosed between the ribs and extending up to a radius where the signal is above 2 times the uncertainty present in that radial bin.
The results of the -model fitting are presented in Fig. 3. The value for the emission eastward (Sector 1) is remarkably smaller () than the value for the azimuthally averaged profile. In Sectors 7 and 8 (located East and South-East), the values of the core radius are larger than the value obtained from the azimuthally averaged profile of 0.097 Mpc. Considering that the parameters of the -model correlate between them, so that higher values corresponds to higher , we conclude that both of these results support the evidence for a much flatter distribution of the gas eastward, probably due to the broadening of the plasma for the merging action along that direction. Finally, we note how poor is the representation with a model of the cluster emission in Sector 5, which is located in opposition to Sector 1 and covers the area in the direction toward the neighboring groups. This region also appears as a deviation at 95 per cent confidence level from the azimuthally-averaged profile in the map of residuals in Fig. 2.

2.2 Spectral analysis
We use the REV2 events file, rp800237n00, processed on January 10th, 1997 from the original dataset. The main correction applied in the REV2 data that affects the spectral analysis is an updated boresighting in the attitude solution that corrects a mean offset of about 6″ observed in the PSPC events (see ROSAT News n.49 111 available at http://wave.xray.mpe.mpg.de/rosat/mission/rosat_news). The REV2 events file is then corrected for temporal and spatial gain variations with the Ftools/Rosat Perl script pcpicor 2.2.0 (Snowden et al. 1995, Turner et al. 1995).
We make use of the redistribution matrix file pspcb _gain2 _256.rmf and calculate with pcarf 2.1.1 the ancillary response file for each source spectrum. Another Ftools/Rosat Perl script, pcbgdcor 1.0.0, has been used to create background spectra with given source region file and background region file that allow a proper vignetting correction. The original background spectrum is obtained from a circular region with a radius of 4′ at arcmin eastward (cfr. Sector 1 in Fig.1), to avoid any contamination from the interacting clumps to the West. The results of this spectral analysis are discussed below. We note that these results are consistent with those obtained both using background spectra obtained from different regions and from the simultaneous fitting of the source and background spectra using a model for the background (see, e.g., Ebeling, Mendes de Oliveira, White 1995) that combines a power law with photon index 1.97 to account for the particle background (Snowden et al. 1992), a thermal component at 0.124 keV and observed power law with photon index 2.12 for the solar scattered photons (Snowden & Freyberg 1993) and unresolved AGN (Hasinger 1992), respectively.
The Pulse-Invariant channels are grouped to collect a minimum of 20 counts in each energy bin to allow the use of the analysis. The spectra are then fitted over the energy range 0.2–2.0 keV to avoid energy regions with known poor calibration (see Table 3.3 in Section 3.4 of the ROSAT User’s Handbook)

The results of the spectral analysis are shown in Table 3. Due to the low spectral capabilities of the PSPC, we have fixed the metal abundance to 0.4 times the solar value (Anders & Grevesse 1989) as obtained in the BeppoSAX analysis (see next section). In the central 6′-radius region, we measure a temperature of keV (90 per cent confidence level), a flux of erg cm-2 s-1 in the 0.1–2.4 keV band, with a corresponding un-absorbed luminosity of erg s-1. In fitting the PSPC spectra, we leave the galactic absorption free to vary to improve the goodness of the fit (Fig. 4). If we fix the absorption to the galactic value of 3.84 cm-2 (Dickey & Lockman 1990), we measure a temperature of about 2.7 keV but the fit is not statistically acceptable ( with 174 d.o.f.).
The temperature obtained from ROSAT PSPC is in agreement with a previous 2–10 keV EXOSAT observation (Edge & Stewart 1991): keV (90 per cent c.l.). However, as we discuss in subsection 3.1.1, these temperature estimates disagree (probably for two different reasons) with measurements obtained from high band-pass X-ray instruments.
| data | ring | kT | abundance | (d.o.f.) | |
| arcmin | keV | cm-2 | |||
| PSPC | 0–6 | 0.4 (fix) | 1.16 (173) | ||
| LECS + MECS | 0–8 | 3.84 (fix) | 1.09 (210) | ||
| LECS (0.1–4 keV) | 0–8 | 1.13 (83) | |||
| LECS (0.2–2 keV) | 0–8 | (90 per cent c.l.) | (fix) | 1.02 (53) | |
| MECS | 0–8 | 3.84 (fix) | 1.09 (124) | ||
| MECS | 0–2 | 3.84 (fix) | 1.21 (69) | ||
| MECS | 2–4 | 3.84 (fix) | 1.17 (78) | ||
| MECS | 4–6 | 3.84 (fix) | 1.16 (60) | ||
| MECS | 6–8 | 3.84 (fix) | 0.91 (60) | ||
| MECS | 8–12 | 3.84 (fix) | 0.78 (53) | ||
| MECS | 12–16 | 3.84 (fix) | 1.31 (40) | ||
| MECS | 16–20 | 3.84 (fix) | 1.14 (28) |
3 BeppoSAX MECS and LECS data
The cluster A3562 was observed by the BeppoSAX satellite (Boella et al. 1997a) between 1999 January 31 and February 1. We discuss here data from two of the instruments onboard BeppoSAX : the Medium-Energy Concentrator Spectrometer (MECS) and the Low-Energy Concentrator Spectrometer (LECS). The MECS (Boella et al. 1997b) is presently composed of two units, working in the 1–10 keV energy range. At 6 keV, the energy resolution is and the angular resolution is 0.7′ (FWHM). The LECS (Parmar et al. 1997), consists of an imaging X-ray detector, working in the 0.1–9 keV energy range, with 20 spectral resolution and 0.8′ (FWHM) angular resolution (both computed at 1 keV). Standard reduction procedures and screening criteria have been adopted to produce linearized and equalized event files. The MECS (LECS) data preparation and linearization was performed using the Saxdas (Saxledas) package under Ftools environment. The observed count rate for A3562 is 0.1740.002 cts s-1 for the 2 MECS units and 0.1330.003 cts s-1 for the LECS. Here we note that the counts rate observed in the high energy instrument on board of BeppoSAX , i.e. the Phoswich Detection System (PDS, 15–200 keV), is consistent with zero and presents a 90 per cent upper limit of 0.13 cts s-1.

3.1 Broad Band Spectroscopy
Considering the present status of the calibration of the BeppoSAX instruments and following the suggestions in Fiore, Guainazzi, Grandi (1999), we have extracted a MECS spectrum, in the 2–10 keV band, and a LECS spectrum, in the 0.1–4 keV, both from a circular region of 8′ radius ( 0.62 Mpc), centered on the emission peak. From the ROSAT PSPC radial profile, we estimate that about 70 per cent of the total cluster emission falls within this radius. The background subtraction has been performed using spectra extracted from blank sky event files in the same region of the detectors as the source. The counts are then grouped to be a minimum of 25 per bin to apply properly the statistics in the fitting analysis.
The spectra from the two instruments have been fitted simultaneously with an optically thin thermal emission model (MEKAL code in the Xspec package), absorbed by a galactic line of sight equivalent hydrogen column density, , of 3.84 cm-2 (Dickey & Lockman 1990). A numerical relative normalization factor among the two instruments has been added to account for the slight mismatch in the absolute flux calibration of the MECS and LECS response matrices employed in this paper (September 1997 release). The MECS vignetting is included in the response matrix thanks to the Effarea program (see Molendi et al. 1999 for details). For the LECS we have used two redistribution matrices and ancillary response files, the first computed for an on-axis pointlike source and the second for a source with a flat brightness profile. The temperatures and abundances we derive in the two cases do not differ significantly, as the telescope vignetting in the 0.1–4.0 keV energy range is not strongly dependent upon energy. As expected, the relative normalization factor is significantly different, 0.550.02 in the case of the fit with the point source effective area, and 0.770.02 in the case of the diffuse source effective area, where the effects of vignetting are included.
The MEKAL model yields an acceptable fit to the data, 229.1 for 210 d.o.f. (see Figure 5). The best fitting values for the temperature and the metal abundance are 5.13 keV and 0.390.05 solar units (Anders & Grevesse 1989), respectively. These values are consistent with the results obtained fitting the single spectrum of LECS and MECS.
From the best-fit results (cfr. Table 3), we measure an un-absorbed flux of () erg cm-2 s-1 in the 2–10 (0.1–2.4) keV band with a corresponding rest-frame luminosity of () erg s-1. The bolometric luminosity is erg s-1.
3.1.1 Comparison with previous estimates
The estimate of the BeppoSAX broad-band gas temperature is not consistent with both the ROSAT and EXOSAT estimates by and , respectively (see Section 2.2 and 3.2). Once the absorption in front of the thermal model is fixed to the Galactic value, the ROSAT measurement provides a larger disagreement with the BeppoSAX result. In particular, if we extrapolate the MECS results to the ROSAT energy band, we observe large deviations below 0.5 keV (Fig. 6). Therefore, we select the PSPC counts between 0.5 and 2 keV (instead of 0.2–2.0 keV as done for the analysis presented in Section 2.2). Doing this, the reduced value diminishes to 0.97 with 144 d.o.f. (the improvement is significant to the 87 per cent confidence level, using the F-test), but still the best-fit gas temperature remains low ( keV, 1 ; note that if we fix the parameters of the spectral fit to the best values obtained from the BeppoSAX spectra – keV, and galactic absorption– the is 1.14 and can not be excluded at 0.05 significance level given the probability distribution). Finally, if we fit the LECS spectrum between 0.2 and 2 keV, we obtain a reasonable good agreement with both the Galactic absorption and the temperature estimate as measured from MECS data only (cf. Table 3).
On the other hand, using the Japanese-US satellite ASCA that operates in a similar energy band as the BeppoSAX MECS instrument, Hanami et al. (1999) and White (2000) observe a gas temperature in A3562 of and keV, respectively, with a metallicity of about 0.3 times the solar value and fixing the absorption to the galactic value. Moreover, White (2000) finds a statistical evidence (90 per cent confidence level) that a cooling flow component is required from the ASCA GIS spectra. Including this component, the ambient gas temperature raises to keV.

About the EXOSAT measurement, it is worth to note that the spectrum was obtained from the Medium-Energy array of proportional counters that has no spatial resolution and a quite large field-of-view of 45′45′. We have verified that the observation has been centered between A3562 and SC1329-313, at (RA, Dec) = 13h 32m 144, –31°41′22″, and covers only 65 per cent of the central circular region of the PSPC centered on the cluster. Therefore, a significant contamination from the cooler group of galaxies could have affected the measurement of the cluster temperature.
In principle, a possible explanation of this soft excess can be the fact that A3562 is located not far from the galactic center, (3133, 304), where the ROSAT soft band maps of Snowden et al. (1997) show a strong contribution from the Galactic bulge and the SNR/stellar wind bubble Radio Loop I. However, if this foreground contamination is homogeneous, diffuse and extended over the field of view of the exposition, the use of a local background should correct for this excess. We have tried to fit the ROSAT spectra with a two temperatures model, but we have not obtained any reduction of the . Furthermore, we do not observe any disagreement between the best-fit MECS results and the extrapolation to the LECS energy band (note that the squares in Fig. 6 are consistent with a constant value).
Finally, we note that the same trend of a lower value of the plasma temperature as measured from ROSAT PSPC than the estimate obtained from spectra collected by instruments with wide X-ray energy band (e.g. MECS, ASCA GIS and SIS) has been also observed in A3558, the most massive cluster in the Shapley region: from the PSPC data, Bardelli et al. (1996) measure 3.3 keV that has to be compared with temperatures larger than 5 keV obtained from ASCA [ keV in Markevitch et al. (1998); keV in Hanami et al. (1999); keV in White (2000)].
Thus, given also the reasonable agreement between ASCA and BeppoSAX measurements, it seems that a calibration problem affects the soft ROSAT band, i.e. at energies between 0.2 and 0.5 keV where large positive residuals are still observed also for calibration sources due to temporal variation of the PSPC gain (see section B.2 of the ROSAT User’s Handbook, Prieto et al. 1994, Markevitch & Vikhlinin 1997). Here, we note that there are other pieces of evidence that support this conclusion from an observational point of view: Allen & Fabian (1997) note that ROSAT PSPC spectra provide generally lower excess absorption when compared with ASCA results; Iwasawa, Fabian & Nandra (1999) measure a significant disagreement between PSPC and ASCA in the soft spectrum of a simultaneous observation of NGC 5548 (cfr. their Fig. 7 with our Fig. 6); Mineo et al. (2000) find same evidence of PSPC soft excess when compared to LECS data in a sample of PG quasars.
3.2 Spatially Resolved Spectral Analysis
The distribution of the gas temperature within the clusters provides a powerful tool to investigate the dynamical status of the intracluster plasma and to constrain the gravitational mass in hydrostatic equilibrium with the gas itself.
A combined good spatial and spectral sensibility is necessary to resolve the gas temperature distribution. The ROSAT PSPC has a good spatial resolution but is spectrally limited to energy below 2.4 keV. On the other hand, ASCA is sensitive to photons with energies up to 10 keV typical for a hot cluster, but its Point-Spread-Function (PSF) has a large (3 arcmin) half-power diameter that depends strongly upon the energy (Serlemitsos et al. 1995). A better combination of the properties required is provided from the MECS instrument onboard BeppoSAX . The PSF of the MECS has a half-power diameter of 2.5 arcmin and is found to vary only weakly with energy (D’Acri, De Grandi & Molendi 1998). Nonetheless, we have taken into account the small spectral distortions introduced by the PSF using appropriated effective area files produced with the Effarea program for each annulus and sector in which a source spectrum has been accumulated.

3.2.1 Radial Profiles
We have accumulated spectra from seven annular regions centered on the X-ray emission peak (see Fig. 7 and Table 3). The background subtraction has been performed using spectra extracted from blank sky event files in the same region of the detector as the source. A correction for the absorption caused by the strongback supporting the detector window has been applied for the 8′-12′ annulus, where the annular part of the strongback is contained. For the 4′-6′, 12′-16′ and the 16′-20′ annuli, where the strongback covers only a small fraction of the available area, we have chosen to exclude the regions shadowed by the strongback. For the 4 innermost annuli the energy range considered for spectral fitting is 2–10 keV. The 8′-12′ annulus is the more sensitive to the strongback correction. This correction is less reliable at low energies: if we use 2 and 3 keV as lower energy cutoff, the best-fit results provide a temperature of about 5 and 3.4 keV, respectively. In the present analysis, we have chosen to accumulate photons with energies between 2.7 and 10 keV and to flag this bin for a systematic uncertainties that can be up to twice the statistical error. Finally, for the 2 outermost annuli, the fit is restricted to the 2–8 keV energy range. The softer energy range considered for the outer annuli limits the spectral distortions, which could be caused by an incorrect background subtraction.
We have fitted each spectrum with an absorbed MEKAL model. For the spectrum from the 0′-2′ region we have also performed a fit with a one temperature thermal emission component plus a cooling flow component (MKCFLOW code in the Xspec package). The parameters of this component have all been fixed, as the energy range we use for spectral fitting (2–10 keV) is not particularly sensitive to the cooling flow. More specifically, the minimum temperature is fixed at 0.1 keV, the maximum temperature, and the metal abundance is set to be equal to the temperature and the metal abundance of the MEKAL component, the mass deposition rate, is fixed to 37 M⊙ yr-1, (from the deprojection analysis of the 0.4–2.0 keV ROSAT PSPC image in Peres et al. 1998). The derived values for the ambient temperature and the metal abundance are indistinguishable from those derived for the single temperature analysis.
In Fig. 7, we show the temperature and abundance profiles (filled circles) obtained from the spectral fits.
By fitting the temperature and abundance profiles with a constant we derive the following average values: 0.22 keV and 0.330.05 solar units. A constant provides an acceptable fit to the abundance profile, 9.4 for 6 d.o.f. (probability = 0.15). On the other hand, a constant does not provide an acceptable fit to the temperature profile (Table 4). Using the statistics we find 21.7 for 6 d.o.f., corresponding to a probability of 0.001 for the observed distribution to be drawn from a constant parent distribution. We have tried to fit a more physical functional form, obtained from the assumption of a polytropic relation between the gas density, described by a model, and temperature:
| (3) |
Using the best-fit values for the core radius, , and (see Section 2.1), we measure keV and (8.6 with 5 d.o.f.), i.e. a significant 4.8 deviation from an isothermal profile. (The error bars come from the distribution of the parameter values after 500 repetitions of the polytropic fit, each time performed with a new set of []; random values of the temperature and surface brightness profiles are considered for the fit with a polytropic and model, respectively, according to the error estimates at each radial bin of the two profiles). We note that, from the deconvolution of the ASCA data, White (2000) measures a flat profile up to 17 arcmin. However, the last bin covers the radial range between 6.4 and 16.7 arcmin and, thus, is not able to resolve any gradient.
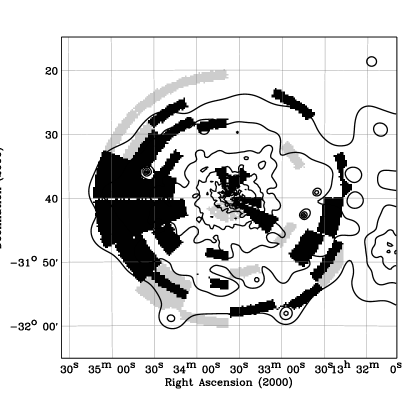
The ROSAT PSPC and MECS image (see Fig. 8) of A3562 contains an unrelated strong point source (EXO1331.7-3120, serendipitously detected with EXOSAT, Giommi et al. 1991), located at arcmin from the center of the cluster. We have accumulated the spectra excluding a region of 5′ around this point source and rederived the temperature and metal abundance for the 3 outer annuli. Our results are over-plotted in Fig. 7 both for the temperature (open squares in the top panel) and abundance (open triangles in the bottom panel) measurements. Clearly, the excision of the point source from the spectra, does not modify in any substantial way the measured temperatures and abundances.
Finally, if we fit the spectra of the last two bins over a harder energy range (2–10 keV instead of the adopted 2–8 keV), we obtain that the spectral distorsion due to an incorrect background subtraction decreases the best-fit central values in the two bins by 25 and 50 per cent, respectively, with a relative uncertainties of about 50 per cent.

3.2.2 Analysis by sectors
We have divided A3562 into 4 sectors: north, west, south and east. Each sector has been divided into 2 annuli with bounding radii 2′-8′ and 8′-16′. In Fig. 8, we show the MECS image with the sectors overlaid. The background subtraction has been performed using spectra extracted from blank sky event files in the same region of the detector as the source. A correction for the absorption caused by the strongback supporting the detector window has been applied for the sectors belonging to the 8′-16′ annulus. We have adopted the 2–10 keV energy range for spectra from all annuli. In the case of the spectra from the outermost annulus, 8′-16′, we have verified that reducing the energy range to the 2–8 keV band does not alter in any significant way the best fitting values for the temperature and metal abundance. We have fitted each spectrum with a MEKAL model absorbed by the galactic line of sight equivalent hydrogen column density.

| Sector | (keV) | d.o.f. | ||||||
|---|---|---|---|---|---|---|---|---|
| North | 5.00.5 | 2.3 | 0.370.11 | 0.5 | 2 | |||
| West | 5.10.5 | 0.7 | 0.370.11 | 0.8 | 2 | |||
| South | 4.80.4 | 1.4 | 0.110.05 | 5.2 | 2 | |||
| East | 4.70.4 | 0.9 | 0.360.09 | 3.5 | 2 | |||
| All | 4.70.2 | 3.6 | 0.330.05 | 1.6 | 6 |
In Fig. 9, we show the temperature profiles obtained from the spectral fits for each of the 4 sectors. Note that in all the profiles we have included the temperature measure obtained for the central circular region with radius 2′. All four sectors show a decrease of the temperature at large radii, consistent with the trend shown in Fig. 7 for the entire cluster. Moreover, when fitted with a constant temperature, the resulting best fit temperature for each sector is consistent at the 90 per cent confidence level with the average temperature for A3562 derived in the previous section.
In Fig. 10, we show the abundance profiles for each of the 4 sectors. In all profiles we have included the abundance measure obtained for the central circular region with bounding radius 2′. We have fitted a constant abundance to these profiles (see Table 4). While in the south and east sectors we have clear evidence of an abundance decline with increasing radius, the modest statistics of the 8-16 arcmin annulus in the north and west prevent us from drawing any conclusion in these sectors.
4 Constraints on the masses

We have directly deprojected the surface brightness from the azimuthally averaged profile and four azimuthal sectors to look for variations in the gas temperature and pressure (see Fig. 11) and to constrain the distribution of the gas and total mass.
The deprojection technique (Fabian et al. 1981, White et al. 1997) has been applied to the surface brightness profiles extracted from exposure–corrected image in the 0.5–2.0 keV band. Given the assumption that the observed projected cluster emission is due to the X-ray emitting gas in spherically symmetric shells, the count emissivity in each radial volume shell can be calculated and compared with the predicted counts from a thermal emission of an optically thin gas [described by a MEKAL model, based on the model calculations of Mewe and Kaastra (Kaastra 1992) with Fe L calculations by Liedahl et al. (1995)], absorbed by intervening matter ( cm-2) and convolved with the response of the detector. For such an emission model, the calculated flux is proportional to the electron density, , and the intracluster medium temperature, , according to the relation: (where , for K). Applying the perfect gas law and the equation of hydrostatic equilibrium to the ICM and assuming a form for the gravitational potential, the temperature and density profiles are obtained once, e.g., the pressure in the outermost bin is fixed.
The gravitational potential functional form is defined by the Navarro, Frenk & White dark matter profile [, where ; Navarro et al. 1995] parametrized with the velocity dispersion and the scale radius, .
The criterion in obtaining a reasonable deprojection is to match an assumed or observed gas temperature profile. We have looked for a good representation of the temperature profile obtained from our analysis of the BeppoSAX data. The gas temperature profile is well reproduced from the deprojection of the azimuthally averaged profile by choosing a km s-1 (in good agreement with the optical determination of km s-1, Bardelli et al. 1998a), Mpc and a pressure value at the outer radius Mpc of Kelvin cm-3.
The results of the deprojection provide a mass deposition rate of about 33 year-1, with a 90th percentile upper limit of 70 year-1, which is consistent with the result in Peres et al. (1998).
To make a qualitative comparison among the deprojected profiles of the four azimuthal sectors, we have fixed the input parameters to the values above. In Fig. 11, the eastern (squares) and southern (triangles) temperature profiles show a steep behaviour in the core that imply the use of a larger scale dark matter radius, i.e. a broader distribution of the gas, to reproduce the observed profiles in Fig. 9. (Note that the 8′-12′ annulus is the more sensitive to the strongback correction; cf. second paragraph in Section 3.2.1).
At the penultimate radial bin, Mpc, we measure a gas mass, , of , a total mass, , of , and a gas fraction, of .
Using the results from the analysis of the surface brightness profile up to 1.51 Mpc done with the model, we can investigate the properties of A3562 at the representative radius , where the mean overdensity in the cluster is 200 times the critical density and the virial equilibrium within the cluster is reached. In detail, the gas mass is given by the integration over the cluster spherical volume of the gas density represented from the model, the total mass is obtained from the hydrostatic equilibrium between the cluster potential and the plasma (see, e.g., Henriksen & Mushotzky 1986):
| (4) | |||||
where , , is the central temperature in keV, the core radius in Mpc, is the mean molecular weight in a.m.u. and the numerical values include the gravitational constant , the mass of the proton and all the unit conversions. Finally, given this mass profile, is given by a simple analytic formula (Ettori 2000).
Under the isothermal assumption (i.e., and keV; see Section 3.1), Mpc, , and the gas fraction, , is . Once a polytropic temperature profile is considered (see best-fit results in Section 3.2.1) and a proper correction is applied to the projected central temperature ( changes from the best-fit value of 6.19 keV to the deprojected value of 6.63 keV; see Markevitch et al. 1999), decreases to 1.79 (0.05) Mpc, the total mass at that radius is , the gas mass is , and the gas mass fraction is .
It is worth to note that these values of the gas and total mass, and the relative gas mass fraction, are extrapolations of the observed masses profiles and are consistent at the 90 per cent confidence level with the results of the deprojection analysis over the radial range covered from the cluster emission.
These estimates of the total mass are generally lower than the values quoted in Quintana et al. (1995), where different estimators of the virial mass applied to the galaxy counts within 2 Mpc provide values in the range . Using the galaxy density distribution and the isothermal assumption, Bardelli et al. (1998a) measure a total mass of at Mpc. This disagreement can be due to the difficulty in disentangling the cluster properties only through optical analysis for the presence of mergers and contaminations that affect the estimate of the optical velocity dispersion and the definitions of the galaxy members.
5 DISCUSSION AND CONCLUSIONS
From the present analysis of the ROSAT PSPC and BeppoSAX data, we conclude that A3562 is a moderate rich cluster with a X-ray bolometric luminosity of erg s-1 in a not-relaxed status, with evidence of merging and/or interaction along the West-East axis. The broader gas emission along that axis is consistent with the picture described by N-body and hydrodynamical simulations, in which the clumps, originally spherical, merge in a cigar-like shape structure that propagates the shock front in the outskirts and relaxes (see, e.g., Fig. 3 in Takizawa 1999). This scenario is complementary and in support of the spectral analysis of the ASCA spectra presented by Hanami et al. (1999).
The complex morphology of the cluster is also underlined from the comparison between the two values, one obtained from the spatial analysis, , and the other from the spectral and optical data, . Representing the estimate of the same quantity, i.e. the ratio of the energies per unit mass stored in the galaxies and in the gas (Cavaliere & Fusco-Femiano 1976), these values should be equal at least in relaxed systems. However, deviations in the average values of and have been observed, rising the so-called problem (Mushotzky 1984, Edge & Stewart 1991, Bahcall & Lubin 1994). This disagreement is observed more significantly in systems that present mergers and complex morphology. The case of A3562 confirms this tendency: given an optical velocity dispersion from Bardelli et al. (1998a) and the X-ray spectral temperature keV obtained from the BeppoSAX spectra, we measure that is not consistent at the 2.5 level with obtained from the modeling of the surface brightness profile with a spherically-symmetric and isothermal X-ray emission.
From the analysis of the BeppoSAX data, we observe a gas temperature that is consistent with ASCA measurements and significantly higher than the estimate obtained from ROSAT and EXOSAT. We suspect that a calibration problem affects the measure done with ROSAT PSPC and a misdirect pointing that done with EXOSAT. Here we note that also the main cluster in the Shapley core, i.e. A3558, presents a temperature of the intracluster plasma lower than the ASCA estimate (Markevitch & Vikhlinin 1997, Hanami et al. 1999, White 2000) when it is measured with ROSAT PSPC (Bardelli et al. 1996).
We observe evidence of a gradient in the temperature and abundance profiles. The presence of the small cooling flow in the core of A3562 and the steep decrease of the metallicity in the southern and eastern sectors may suggest that the cluster is undergoing a successive merger with a group with a luminosity of about erg s-1 and poor metallicity in the East, after a time in which the relaxation allowed the enhancement of the gas density in the core. It is worth to note that Bardelli et al. (1998b) show the evidence of two merging groups in the same directions of the observed X-ray excess: the clump ’T598’ has a peak density at 17.7 arcmin to East of the X-ray center, while ’T599’ is separated by 28.9 arcmin from the X-ray center to the South-East. From the isodensity of the bi-dimensional distribution (Fig. 9 of Bardelli et al 1998b) and the redshift distribution (Fig. 2 of Bardelli et al 1998a) of galaxies belonging to these groups, they appear quite dispersed, probably due to strong tidal interaction with the more massive A3562.
From a recent survey performed at 20 cm in the region of the A3558 chain (Venturi et al. 2000), it results that A3562 hosts in its neighborhood nine of the 28 radio sources of the cluster complex. Seven of these objects are located in the eastern edge, where the dynamical analysis found the existence of the two groups, T598 and T599, cited above. These two groups seem to connect each other near the position of the X-ray excess we detected at a distance of arcmin from the A3562 center. Two (J1333-3141 and J1335-3153) of the A3562 radio sources present extended morphology and it was possible to estimate their physical properties. In particular, the equipartition pressure of J1333-3141 is dyne cm-2 (or K cm-3): if the source is at the projected distance of kpc, the pressure of the hot gas as estimated from the deprojection will be a factor 100 higher than . This is not a strange result, since it is known that the radio emission could be overpressured by the diffuse hot gas up to a factor 10-100 (Feretti, Perola & Fanti 1992). However, if we impose , we derive a physical distance of Mpc of the radio source from the cluster center, with an inclination of the tail of 83°with respect to the plane of the sky. More interesting is the source J1335-3153, whose pressure is dyne cm-2; its projected distance from the cluster center is Mpc. At this distance, the gas of A3562 is not able to confine the extended radio emission, which on the contrary could be in interaction with the more diffuse component seen in the X-ray map, if it extends to the radio source. A more detailed analysis, comprising also the age of the relativistic electrons derived from the spectra, is underway.
A BeppoSAX observation of each of the two groups of galaxies present in the Shapley core, SC1327-312 and SC1329-313, is planned by the end of the present AO (March 2000). These observations will allow us to describe in detail the ongoing merging thanks to the capability of BeppoSAX to map the temperature distribution as shown in the present work.
ACKNOWLEDGEMENTS
This research has made use of linearized event files produced at the BeppoSAX Science Data Center and data obtained through the High Energy Astrophysics Science Archive Research Center Online Service, provided by the NASA-Goddard Space Flight Centre. SE acknowledges the support of the Royal Society. The anonymous referee is thanked for comments that improved the presentation of this work.
References
- [1] Abell G., Corwin H.G., Olowin R., 1989, ApJS, 70, 1 (ACO)
- [2] Allen S.W., Fabian A.C., 1997, MNRAS, 286, 583
- [3] Anders E., Grevesse N., 1989, Geochimica et Cosmochimica Acta 53, 197
- [4] Arnaud K.A., 1996, ”Astronomical Data Analysis Software and Systems V”, eds. Jacoby G. and Barnes J., ASP Conf. Series vol. 101, 17
- [] Bahcall N.A., Lubin L.M., 1994, ApJ, 426, 513
- [] Bardelli S., Zucca E., Vettolani G., Zamorani G., Scaramella R., Collins C.A., MacGillivray H.T., 1994, MNRAS, 267, 665
- [] Bardelli S., Zucca E., Malizia A., Zamorani G., Scaramella R., Vettolani G., 1996, A&A, 305, 435
- [] Bardelli S., Zucca E., Zamorani G., Vettolani G., Scaramella R., 1998a, MNRAS, 296, 599
- [] Bardelli S., Pisani A., Ramella M., Zucca E., Zamorani G., 1998b, MNRAS, 300, 589
- [] Bardelli S., Zucca E., Zamorani G., Moscardini L., Scaramella R., 2000, MNRAS, 312, 540
- [5] Boella G., Butler R.C., Perola G.C., Piro L., Scarsi L., Bleeker J.A.M., 1997a, A&AS, 122, 299
- [6] Boella G. et al., 1997b, A&AS, 122, 327
- [] Breen J., Raychaudhury S., Forman W., Jones C., 1994, ApJ, 424, 59
- [7] Cavaliere A., Fusco-Femiano R., 1976, A&A, 49, 137
- [8] Cen R., Ostriker J.P., 1994, ApJ, 429, 4
- [9] D’Acri F., De Grandi S., Molendi S., 1998, Nuclear Physics, 69/1-3, 581 (astro-ph/9802070)
- [] Day C.S.R., Fabian A.C., Edge A.C., Raychaudhury S., 1991, MNRAS, 252, 394
- [10] Dickey J.M., Lockman, F.J., 1990, ARA&A, 28, 215
- [11] Drinkwater M.J., Proust D., Parker Q.A., Quintana H., Slezak E., 1999, PASA, 16, 113
- [12] Ebeling H., Mendes de Oliveira C., White D.A., 1995, MNRAS, 277, 1006
- [13] Ebeling H., White D.A., Rangarajan F.V.N., 1999, MNRAS, submitted
- [] Edge A.C., Stewart G.C., 1991, MNRAS, 252, 428
- [14] Ettori S., Fabian A.C., White D.A., 1997, MNRAS, 289, 787
- [15] Ettori S., 2000, MNRAS, 311, 313
- [] Fabian A.C., Hu E.M., Cowie L.L., Grindlay J., 1981, ApJ, 248, 47
- [] Feretti L., Perola G.C., Fanti R., 1992, A&A 265, 9
- [] Fiore F., Guainazzi M., Grandi P., 1999, Cookbook for BeppoSAX NFI Spectral Analysis, version 1.2, available at http: //www.sdc.asi.it /software /cookbook/
- [16] Giommi P. et al., 1991, ApJ, 378, 77
- [17] Hanami H., Tsuru T., Shimasaku K., Yamauchi S., Ikebe Y., Koyama K., 1999, ApJ, 521, 90
- [18] Hasinger G., 1992, The X-ray background, ed. Barcons X., Fabian A.C., Cambridge University Press, p.229
- [] Henriksen M.J., Mushotzky R.F., 1986, ApJ, 302, 287
- [19] Iwasawa K., Fabian A.C., Nandra K., 1999, MNRAS, 307, 611
- [] Kaastra J.S., 1992, An X-Ray Spectral Code for Optically Thin Plasmas (Internal SRON-Leiden Report, updated version 2.0)
- [] Kull A., Böhringer H., 1999, A&A, 341, 23
- [] Liedahl D.A., Osterheld A.L., Goldstein W.H., 1995, ApJ, 438, L115
- [] Markevitch M., Vikhlinin A., 1997, ApJ, 474, 84
- [] Markevitch M. et al., 1998, ApJ, 503, 77
- [] Markevitch M., Vikhlinin A., Forman W.R., Sarazin C.L., 1999, ApJ, 527, 545
- [] Metcalfe N., Godwin J.G., Peach J.V., 1994, MNRAS, 267, 431
- [] Mineo T. et al., 2000, in preparation
- [] Mohr J.J., Mathiesen B., Evrard A.E., 1999, ApJ, 517, 627
- [20] Molendi S., De Grandi S., Fusco-Femiano R. et al., 1999, ApJ Letters, in press
- [21] Mushotzky R.F., 1984, Physica Scripta, vol. T7, 157
- [] Navarro J.F., Frenk C.S., White S.D.M., 1995, MNRAS, 275, 720
- [] Neumann D.M., Arnaud M., 1999, A&A, 348, 711
- [] Parmar A.N. et al., 1997, AAS, 122, 309
- [] Peres C.B., Fabian A.C., Edge A.C., Allen S.W., Johnstone R.M., White D.A., 1998, MNRAS, 298, 416
- [] Press W.H., Teukolsky S.A., Vetterling W.T., Flannery B.P., 1992, Numerical Recipes in Fortran, Cambridge University Press
- [] Prieto M.A., Hasinger G., Snowden S., 1994, http://ftp.rosat.mpe-garching.mpg.de/ rosat_svc/ calibration/ PSPC_gain_memo.ps
- [] Quintana H., Ramirez A., Melnick J., Raychaudhury S., Slezak E., 1995, AJ, 110, 463
- [] Quintana H., Melnick J., Proust D., Infante L., 1997, A&AS, 125, 247
- [] Raychaudhury S., 1989, Nature, 342, 251
- [] Raychaudhury S., Fabian A.C., Edge A.C., Jones C., Forman W., 1991, MNRAS, 248, 101
- [] ROSAT User’s Handbook, 1997, available at http://wave.xray.mpe.mpg.de/rosat/doc/ruh/
- [] Scaramella R., Baiesi-Pillastrini G., Chincarini G., Vettolani G., Zamorani G., 1989, Nature, 338, 562
- [] Serlemitsos P.J. et al., 1995, PASJ, 47, 105
- [] Shapley H., 1930, Harvard Obs. Bull., 874, 9
- [] Snowden S.L., Plucinsky P.P., Briel U., Hasinger G., Pfeffermann E., 1992, ApJ, 393, 819
- [] Snowden S.L., Freyberg M.J., 1993, ApJ, 404, 403
- [] Snowden S.L., McCammon D., Burrows D.N., Mendenhall J.A., 1994, ApJ, 424, 714
- [] Snowden S.L., Turner T.J., George I.M., Yusaf R., Predehl P., Prieto A., 1995, OGIP Calibration Memo CAL/ROS/95-003
- [] Snowden S.L. et al., 1997, ApJ, 485, 125
- [] Takizawa M., 1999, ApJ, 520, 514
- [] Trümper J., 1983, Adv. Space Res., 2, 241
- [] Turner T.J., George I.M., Snowden S.L., Yusaf R., Hasinger G., 1995, OGIP Calibration Memo CAL/ROS/95-010
- [] Venturi T., Bardelli S., Morganti R., Hunstead R.W., 1997, MNRAS, 285, 898
- [] Venturi T., Bardelli S., Morganti R., Hunstead R.W., 1998, MNRAS, 298, 1113
- [] Venturi T., Bardelli S., Morganti R., Hunstead R.W., 2000, MNRAS, in press
- [] White D.A., Jones C., Forman W., 1997, MNRAS, 292, 419
- [] White D.A., 2000, MNRAS, 312, 663
- [] Zucca E., Zamorani G., Scaramella R., Vettolani G., 1993, ApJ, 407, 470