The afterglow of the short/intermediate-duration gamma-ray burst GRB~000301C: A jet at z=2.04††thanks: Based on observations made with the Nordic Optical Telescope, operated on the island of La Palma jointly by Denmark, Finland, Iceland, Norway, and Sweden, in the Spanish Observatorio del Roque de los Muchachos of the Instituto de Astrofisica de Canarias.,††thanks: Based on observations collected at the European Southern Observatory, La Silla and Paranal, Chile (ESO project No. 64.H-0573) ,††thanks: Based on observations at the German-Spanish Astronomical Centre, Calar Alto, operated by the Max-Planck-Institute for Astronomy, Heidelberg, jointly with the Spanish National Commission for Astronomy.
We present Ulysses and NEAR data from the detection of the short or intermediate duration (2 s) gamma-ray burst GRB~000301C (2000 March 1.41 UT). The gamma-ray burst (GRB) was localised by the Inter Planetary Network (IPN) and RXTE to an area of 50 arcmin2. A fading optical counterpart was subsequently discovered with the Nordic Optical Telescope (NOT) about 42 h after the burst. The GRB lies at the border between the long-soft and the short-hard classes of GRBs. If GRB~000301C belongs to the latter class, this would be the first detection of an afterglow to a short-hard burst. We present UBRI photometry from the time of the discovery until 11 days after the burst. We also present JHK photometry obtained with UKIRT on 2000 March 4.5 UT (3.1 days after the burst). Finally, we present spectroscopic observations of the optical afterglow obtained with the ESO VLT Antu telescope 4 and 5 days after the burst. The optical light curve is consistent with being achromatic from 2 to 11 days after the burst and exhibits a break. A broken power-law fit yields a shallow pre-break decay power-law slope of 0.06, a break time of 0.26 days after the burst, and a post-break slope of 0.17. These properties of the light curve are best explained by a sideways expanding jet in an ambient medium of constant mean density. In the optical spectrum we find absorption features that are consistent with Fe ii, C iv, C ii, Si ii and Ly at a redshift of 2.04040.0008. We find evidence for a curved shape of the spectral energy distribution of the observed afterglow. It is best fitted with a power-law spectral distribution with index reddened by an SMC-like extinction law with A mag. Based on the Ly absorption line we estimate the H i column density to be (N(H i)). This is the first direct indication of a connection between GRB host galaxies and Damped Ly Absorbers.
Key Words.:
gamma rays: bursts – cosmology: observations – galaxies: distances and redshifts – ISM: dust, extinction – quasars: absorption lines1 Introduction
The discovery of the first -ray afterglow (Costa et al. C1997 (1997)) and optical counterpart (van Paradijs et al. PGG1997 (1997)) to a long-duration gamma-ray burst (GRB) have led to a revolution in GRB research. The determination of a redshift of 0.835 for GRB~970508 (Metzger et al. MDK1997 (1997)), and the subsequent determination of redshifts of 13 bursts with a median redshift of 1.0, have firmly established their cosmological origin (Kulkarni et al. 2000a ; This work; Bloom et al. BDD2000 (2000)).
The intriguing case of an association of the peculiar supernova SN1998bw with GRB~980425 (Galama et al. GVP1998 (1998)) was the first indication of a possible connection with supernovae. Evidence for supernova signatures in the late light curves of GRB~970228 (Reichart Rei1999 (1999); Galama et al. GTV1999 (1999)) and GRB~980326 (Castro-Tirado & Gorosabel CTG1999 (1999); Bloom et al. BKD1999 (1999)) suggests that at least some long-duration GRBs may be related to the collapse of massive ( M⊙) stars. Breaks in the power-law declines of GRB~990123 (Kulkarni et al. KDO1999 (1999)) and GRB~990510 (Harrison et al. HBF1999 (1999)) are interpreted as evidence for collimated outflows (‘jets’) (see also Holland et al. HBH2000 (2000)). Further evidence for this collapsar + jet model (e.g., MacFadyen & Woosley MW1999 (1999)) comes from the light curve of GRB~980519 which is best interpreted as a jet expanding into a preexisting circumburst stellar wind (Jaunsen et al. J2001 (2001)).
The high-energy properties of GRBs show a bi-modal distribution of burst durations (Kouveliotou et al. K1995 (1995)) which, in the simplest scenario, may indicate the existence of binary compact mergers as the progenitors of the short-duration bursts (T s). From an analysis of the Third BATSE Catalog, Mukherjee et al. (MFB1998 (1998)) have shown that, in addition to the short (T s) and long (T s) classes, there may exist a third, intermediate soft-spectrum class of GRBs with duration 2 s.
In this paper we report the discovery and subsequent observations and analysis of the afterglow of the short-to-intermediate duration GRB~000301C (Fynbo et al. 2000a ).
Sect. 2 reports the detection, IPN localisation and the high-energy data of the GRB obtained from Ulysses and NEAR. Sect. 3 describes the discovery of the optical counterpart and our subsequent optical and infrared observations. Sect. 4 details the optical and infrared photometry and Sect. 5 describes the VLT spectroscopy. Sect. 6 describes the results obtained on the spectroscopy and spectral energy distribution and Sect. 7 is devoted to the discussion and interpretation, with Sect. 8 presenting our conclusions.
Throughout this paper, we adopt a Hubble constant of H0 = 65 km s-1 Mpc-1 and assume and .
2 Detection and localisation of the gamma-ray burst
GRB~000301C was recorded by the Ulysses GRB experiment and by the NEAR -Ray/Gamma-Ray Spectrometer. Because this burst was relatively weak, it did not trigger the Ulysses Burst Mode, and the only data available from Ulysses is the Observation Mode 1 0.25 s resolution 25–150 keV light curve (Hurley et al. 1992b ). NEAR records the light curves of bursts in the 150–1000 keV energy range with 1 second resolution, but takes high-energy spectra only with 40 min resolution.
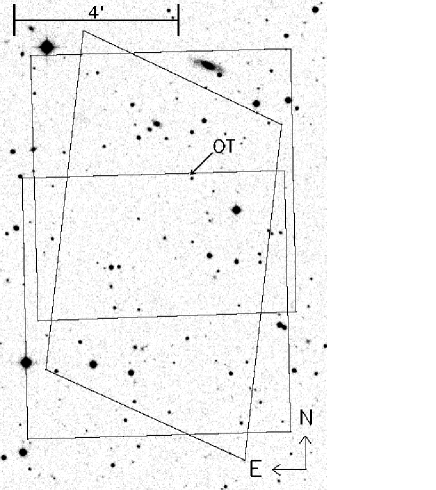
Analysis of the Ulysses and NEAR relative timing data yields an annulus centred at , with a radius of 57.520 degrees (at 3 full-width). This annulus intersected the error-box of the All-Sky Monitor (ASM) on the RXTE spacecraft, at near-right angles to create a composite localisation of a parallelogram of area arcmin2 (see Fig. 2).
Since no high-energy spectra are available, we have estimated the peak fluxes and fluences for trial power-law spectra with indices between 1 and 4 using the Ulysses data. For a typical power-law index of 2, we find a 25–100 keV fluence of , and a peak flux over the same energy range, and over 0.25 s, of . The uncertainties in these numbers are partly due to the lack of a high-energy spectrum. For example, the fluence estimates range from to as the spectral index is varied from 4 to 1. The statistical uncertainty is approximately 30%. From the NEAR data we estimate the 150–1000 keV fluence to be approximately .
To date, the only GRBs with identified long-wavelength counterparts have been long-duration bursts. As measured by both Ulysses and NEAR, in the 25 keV energy range, the duration of this burst was approximately 2 s. (Note that the earlier estimate of a 10 s duration of GRB~000301C by Smith et al. (SHC2000 (2000)) was based on the 10 keV energy range). Thus it falls in the short class of bursts, though it is consistent with belonging to the proposed intermediate class or the extreme short end of the distribution of long-duration GRBs (Hurley et al. 1992a ; Mukherjee et al. MFB1998 (1998)). Although we do not have any measurements of the high-energy spectra above 25 keV, it is possible to derive a crude estimate of the spectral index, and therefore the hardness ratio (the 100–300 keV fluence divided by the 50–100 keV fluence), from the Ulysses and NEAR count rates. We obtain a hardness ratio of 2.70.6(cutoff)30%(statistical error) from fitting a power-law, with the index as a free parameter, to the count rates from NEAR and Ulysses, assuming a range of cut-off energies.
Fig. 1 shows the location of GRB~000301C in a hardness vs. duration plot. The contour plot contains 1959 GRBs for which data on fluence and duration were available in the Fourth BATSE GRB Catalog (revised) (Paciesas et al. PMP1999 (1999)) and the BATSE Current GRB Catalog111Data on current GRBs are available through the BATSE homepage http://www.batse.msfc.nasa.gov/batse/. The symbols represent the 10 GRBs included in the BATSE catalogs for which an afterglow has been identified, with GRB~000301C located near the center of the plot. Triangles are bursts where a break has been found in the optical light curve. From this sparse set of data there does not appear to be any marked difference in the distributions of bursts with, or without, an identified break.

Of the 1959 BATSE bursts in Fig. 1, the ratio between bursts with a duration of T s and with T s is 3:1. To date, at least 23 GRB optical afterglows have been discovered (Kulkarni et al. 2000a ; Andersen et al. AH2000 (2000); this work; Klose et al. KSF2000 (2000); Fynbo et al. 2001a ; Fynbo et al. 2001b ; Henden H2001 (2001); grb-webpage of J. Greiner222http://www.aip.de/~jcg/grbgen.html). If the distribution of the 23 GRBs with identified counterparts follows the general BATSE distribution, one would expect that bursts were in the long class, and bursts were in the short class. However, GRB~000301C is the only GRB with a duration consistent with the short-duration class. The expected number of identified short burst counterparts is moderated by the strong selection bias caused by the technical difficulties of obtaining precise localisations for the short GRBs.
3 Discovery and observations of the afterglow
The IPN/RXTE error-box of GRB~000301C (Smith et al. SHC2000 (2000)) was observed with the 2.56-m Nordic Optical Telescope (NOT) on 2000 March 3.14–3.28 UT (1.8 days after the burst) using the Andalucía Faint Object Spectrograph (ALFOSC). Comparing with red and blue Palomar Optical Sky Survey II exposures, a candidate Optical Transient (OT) was found at the position (Fynbo et al. 2000a ). A finding-chart of the IPN-errorbox and the two ALFOSC pointings used to cover the field can be seen in Fig. 2.
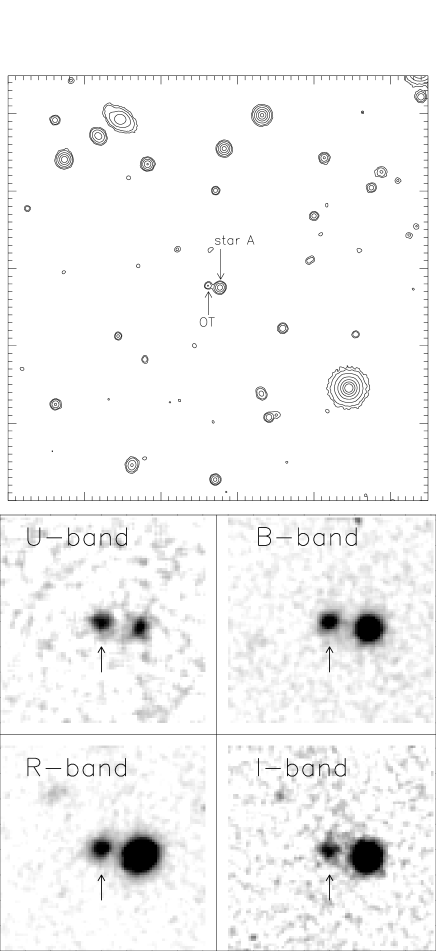
The transient nature of the candidate was subsequently confirmed at optical and infrared wavelengths (Bernabei et al. BMB2000 (2000); Stecklum et al. SKF2000 (2000); Garnavich et al. GBJ2000 (2000); Veillet et al. V2000 (2000); Fynbo et al. 2000b ; Kobayashi et al. KGT2000 (2000)). At the time of discovery the magnitude of the OT was R=20.090.04 (see Sect. 4 for a detailed discussion of the photometry and Fig. 3 for a finding chart and UBRI-images of the OT on 2000 March 3 UT).
We obtained subsequent optical observations using the NOT, the Antu telescope (UT1) of ESO’s Very Large Telescope (VLT), the USNOFS 1.0-m telescope, the 2.2-m telescope at Calar Alto (CAHA) and the Wide Field Imager (WFI) on the ESO 2.2-m telescope. In addition we obtained near-infrared (NIR) data from the United Kingdom Infra-Red Telescope (UKIRT).
The journal of our optical and NIR observations, including the derived magnitudes, is given in Table LABEL:TABLE:photometry.
The OT was also observed from several other optical and infrared telescopes, and the counterpart was subsequently detected in the mm-band at 250 GHz (Bertoldi B2000 (2000)), and at radio (8.46 GHz) wavelengths (Berger & Frail BF2000 (2000))333See the GCN Circulars Archive for further details (http://gcn.gsfc.nasa.gov/gcn/gcn3_archive.html). Papers detailing the properties of the counterpart of GRB~000301C have been presented at radio and mm wavelengths (Berger et al. BSF2000 (2000)) and in the infrared (Rhoads & Fruchter RF2001 (2001)), and optical bands (Masetti et al. MBB2000 (2000); Sagar et al. SMP2000 (2000)).
| Telescope | date | seeing | filter | exp. time | mag |
| (2000, UT) | arcsec | (sec) | |||
| NOT | Mar 3.14 | 2.3 | R | 900 | 20.090.04 |
| NOT | Mar 3.17 | 2.2 | R | 900 | 20.150.04 |
| NOT | Mar 3.19 | 2.1 | R | 900 | 20.110.04 |
| NOT | Mar 3.20 | 2.2 | B | 900 | 21.050.04 |
| NOT | Mar 3.21 | 2.3 | R | 900 | 20.140.04 |
| NOT | Mar 3.22 | 2.3 | B | 900 | 21.020.04 |
| NOT | Mar 3.24 | 2.3 | U | 900 | 20.520.08 |
| NOT | Mar 3.25 | 2.2 | R | 900 | 20.160.04 |
| NOT | Mar 3.26 | 2.0 | I | 900 | 19.600.07 |
| NOT | Mar 3.27 | 2.3 | I | 300 | 19.590.06 |
| CAHA 2.2m | Mar 4.14 | 1.4 | I | 1440 | 20.100.10 |
| USNO | Mar 4.39 | 2.0 | I | 480 | 20.040.11 |
| USNO | Mar 4.40 | 2.1 | V | 720 | 21.050.07 |
| USNO | Mar 4.41 | 2.0 | B | 1200 | 21.350.05 |
| USNO | Mar 4.42 | 1.8 | R | 600 | 20.610.06 |
| USNO | Mar 4.48 | 1.6 | R | 1200 | 20.580.03 |
| USNO | Mar 4.49 | 1.6 | R | 1200 | 20.540.04 |
| USNO | Mar 4.50 | 1.6 | R | 1200 | 20.600.04 |
| USNO | Mar 4.52 | 1.6 | B | 1200 | 21.420.04 |
| USNO | Mar 4.53 | 1.6 | V | 1200 | 20.980.04 |
| USNO | Mar 4.43 | 2.0 | U | 1200 | 20.820.11 |
| UKIRT | Mar 4.51 | 0.7 | J | 810 | 19.190.04 |
| UKIRT | Mar 4.53 | 0.6 | H | 810 | 18.440.04 |
| UKIRT | Mar 4.55 | 0.5 | K | 810 | 17.620.05 |
| CAHA 2.2m | Mar 5.23 | 1.5 | I | 960 | 20.240.12 |
| ESO VLT | Mar 5.39 | 0.9 | R | 10 | 20.610.05 |
| ESO VLT | Mar 6.39 | 1.1 | R | … | 21.430.26 |
| NOT | Mar 7.22 | 1.4 | R | 300 | 21.590.07 |
| NOT | Mar 7.24 | 1.4 | U | 3600 | 21.920.07 |
| CAHA 2.2m | Mar 7.23 | 1.1 | I | 960 | 21.130.15 |
| NOT | Mar 8.18 | 1.4 | R | 1200 | 21.800.05 |
| NOT | Mar 8.20 | 1.5 | I | 900 | 21.390.09 |
| NOT | Mar 8.21 | 1.6 | B | 1100 | 22.890.08 |
| NOT | Mar 8.25 | 1.9 | U | 3700 | 22.490.12 |
| NOT | Mar 9.15 | 1.4 | R | 2000 | 22.110.15 |
| NOT | Mar 9.20 | 1.6 | U | 5400 | 22.690.20 |
| NOT | Mar 9.24 | 1.4 | B | 1200 | 23.010.11 |
| NOT | Mar 9.26 | 1.2 | I | 900 | 21.720.15 |
| CAHA 2.2m | Mar 10.05 | 1.3 | I | 960 | 21.850.20 |
| USNO | Mar 10.40 | 3.0 | B | 1800 | 23.400.30 |
| CAHA 2.2m | Mar 11.21 | 1.2 | I | 1440 | 22.630.27 |
| ESO 2.2m | Mar 11.39 | 2.4 | R | 3200 | 23.120.18 |
| USNO | Mar 12.44 | 1.9 | R | 4800 | 23.100.22 |
4 Photometry
4.1 Optical data
To avoid contamination from the nearby star A (located at a separation of west and south of the OT in Fig. 3), we measured the magnitude of the OT relative to stars in the field by performing Point Spread Function (PSF) photometry, using DAOPHOT II (Stetson S1987 (1987), S1997 (1997)). There are several bright and unsaturated stars in the field from which a good PSF could be determined.
For the data presented here, there is no indication of a contribution from a host galaxy to the emission at the position of the OT (see Sect. 7.2 for a discussion of the host galaxy). Hence, extended emission from a faint galaxy at the position of the OT will not affect the PSF photometry appreciably (much less than observational errors). The quality of the PSF photometry was checked by subtracting the PSFs from the images of star A and the OT. In all frames the residuals are consistent with being shot-noise.
To avoid errors due to colour terms or colour differences in our photometry (the conditions during most of the observations at the NOT were possibly non-photometric due to increasing amounts of Saharan dust in the atmosphere over the telescope at the time of observations), the magnitudes of the OT for all our optical photometry were calibrated relative to stars of similar colours in the field.
The photometric standard UBVRCIC calibration of the field was performed at the USNOFS 1.0-m telescope and is available in Henden (H2000 (2000)). This calibration has an estimated zero-point uncertainty of 2 percent, which is well below the errors in the relative magnitudes. The results of the PSF photometry are presented in Table LABEL:TABLE:photometry. The 2000 March 6.39 VLT R-data point has been derived from the March 6 combined VLT-spectrum (Table 2).
Based on this photometric calibration we conclude that star A showed no sign of variability within observational errors throughout our observations, and that it had the following magnitudes: U = 20.4270.133, B = 19.8370.030, V = 18.7670.018, R = 18.0840.043, and I = 17.5260.044.
4.2 Near-infrared data
The UKIRT images were processed using the ORAC imaging data reduction routines developed for UKIRT (Bridger et al. BWE2000 (2000)). The J, H and K magnitudes of the OT were then measured from the UKIRT data as follows. First we measured the magnitude of the OT relative to star A using DAOPHOT II PSF photometry as described above. Then, in order to transform this magnitude to the standard UKIRT system, we performed aperture photometry in an aperture with a diameter of on calibration images obtained of the standard stars S868-G and p389-d from the list of UKIRT faint standards444http://www.jach.hawaii.edu/JACpublic/UKIRT/ astronomy/calib/faint_stds.html and on star A. The estimated error in the zero-point is about 0.05 in each of J, H and K. We have assumed negligible extinction difference between standard and program field. The results of these measurements are presented in Table LABEL:TABLE:photometry.
5 Spectroscopy
Spectroscopic observations were carried out on 2000 March 5 and 6 UT with VLT-Antu equipped with FORS1 (for details see the observing log in Table 2). We used the GRIS_300V+10 grism and the GG375 order separation filter, which provide a spectral coverage from 3600 Å to 8220 Å and a dispersion of 2.64 Å/pixel. The effective exposure time was 800 s on March 5.39 UT and 1200 s on March 6.38 UT. Standard procedures were used for bias and flat field correction, and the optimal extraction procedure for faint spectra (described in Møller (M2000 (2000))) was used to extract one dimensional spectra.
| Date | Exposure time | Airmass | Slit width | |
|---|---|---|---|---|
| (2000 UT) | (s) | () | ||
| Mar 5.39 | 400 | 1.732–1.745 | 1.3 | |
| Mar 5.40 | 400 | 1.719–1.729 | 1.3 | |
| Mar 6.38 | 600 | 1.772–1.801 | 1.0 | |
| Mar 6.39 | 600 | 1.745–1.767 | 1.0 |
The position angle of the long slit was chosen such that both the OT and star A were centred onto the slit. From the magnitude of star A we calibrated the flux of the trace of the optical counterpart. The spectral flux calibration derived for the OT on March 5 is consistent with the optical photometry displayed in Table LABEL:TABLE:photometry. We derive a value for the spectral index of on March 5 and on March 6, corrected for interstellar extinction of , using the dust maps of Schlegel et al. (SFD1998 (1998)).
6 Results
6.1 GRB absorption lines and redshift determination
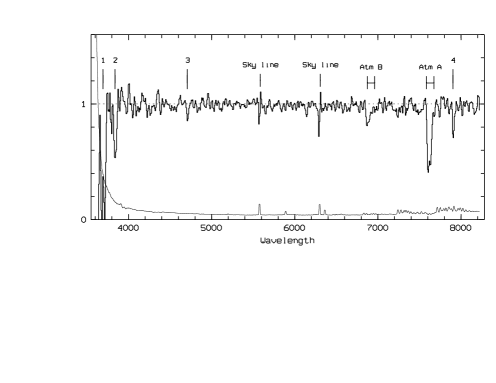
The combined spectrum, reproduced in Fig 3, has a resolution of 14 Å FWHM, and signal–to–noise (S/N) in the range 15–30 per resolution element redwards of 4000 Å. From 4000 Å to 3600 Å the S/N drops rapidly.
Due to the poor resolution, only very strong absorption lines can be detected individually. In Table 3 we list the only four absorption features which were detected at a S/N in excess of 4.5. Two of the features were found bluewards of 4000 Å, and were initially ignored. The line at 4712 Å is broader than the resolution profile, and we tentatively identified it as a possible C iv absorption complex with redshifts in the range 2.038 to 2.042. With this identification, the other three features would fit the proposed identifications given in Table 3. Note, however, that the Si ii 1260 line is far too strong and wide to be a single line, and we hence assume that it is a blended feature. The Fe ii 2600 line is strong and narrow, but also this line seems excessively strong given the lack of other strong Fe ii lines.
| Line | Identification | Wobs | (W) | |
|---|---|---|---|---|
| (Å) | (Å) | |||
| 1 | Ly | 3693.56 | 67.07 | 12.09 |
| 2 | Si ii 1260 | 3843.09 | 18.99 | 2.03 |
| 3 | C iv 1549 | 4712.23 | 3.76 | 0.82 |
| 4 | Fe ii 2600 | 7909.03 | 6.29 | 1.21 |
In order to provide a more strict test of our proposed identification, and to obtain an accurate value for the redshift, we proceeded as follows. First we shifted and stacked pieces of the spectra where we would expect common low ionization lines. We selected the singly ionized species of Si, C and Fe, all of which are known as strong absorbers in quasar absorption line systems. In total our spectrum covers positions of the lines Fe ii 1608, Fe ii 2344, Fe ii 2374, Fe ii 2382, Fe ii 2586, Fe ii 2600, Si ii 1260, Si ii 1304, Si ii 1526, and C ii 1334. Si ii 1260 (at 3832 Å) was in the very low S/N part of spectrum, and almost certainly blended, so it was not included. Treating each ion separately, a weighted mean absorption feature was calculated using the oscillator strength of each line as statistical weight.
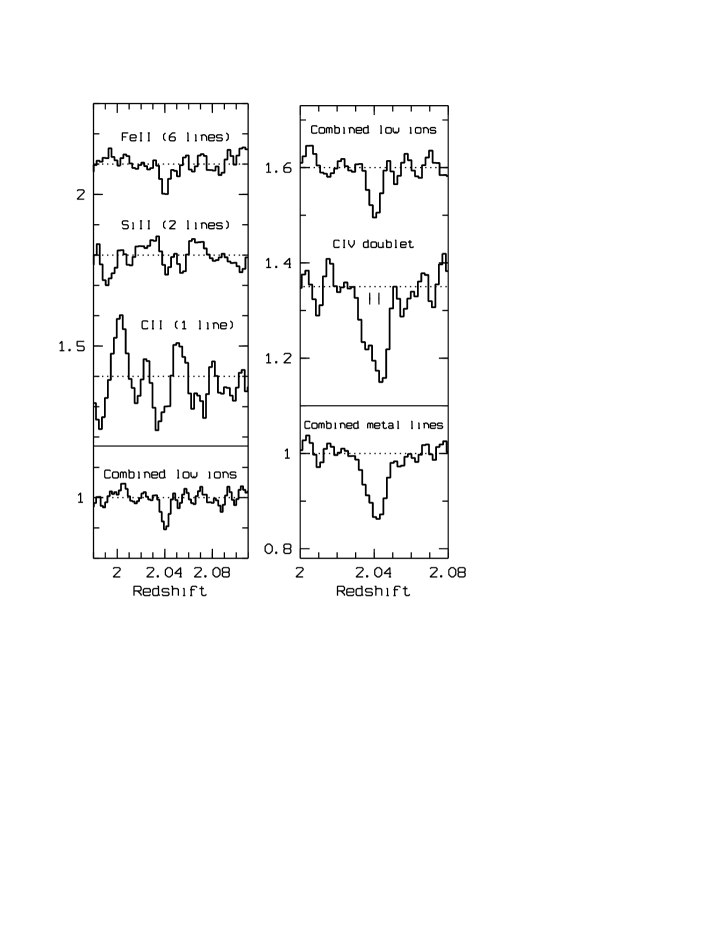
The regions of the co–added spectra for each of the ions Fe ii, Si ii and C ii, transformed into redshift space, is shown in the left panel of Fig. 5. A combined “Low Ionization” absorption feature (bottom of left panel of Fig. 5) was obtained by co–addition of the three sets of features, but using the number of lines as statistical weights. The redshift range searched for low ionization absorption systems by this method was 1.95–2.14 and no other candidate systems were found in this range. For comparison of the redshifts, we plot in the right panel of Fig. 5 again the combined “Low Ionization” absorption feature together with the C iv absorption trough. The bottom panel here shows the combination of all the lines. Given the significance of this combined “Metal Absorption Feature”, we conclude that the tentative identification of this system is confirmed.
It is commonly seen in quasar absorption line systems that the low ionization species, tracing the cold dense gas, have a more well-defined redshift than the high ionization species. Hence, we shall adopt the redshift , measured from the combined Low Ionization feature, as the systemic redshift. It is seen from the bottom right panel of Fig. 5 that inclusion of C iv would result in a slightly higher redshift. Note that is consistent with the redshift z=1.95 based on the Lyman break (Smette et al. SFG2000 (2000); Feng et al. FWW2000 (2000)), but is significantly higher than the value z=2.03350.0003 reported by Castro et al. (CDD2000 (2000)).
The oscillator strength weighted mean observed equivalent width of the Fe ii lines is 2.56 Å, which is strong enough that by comparison to known quasar absorbers one would expect this to likely have a column density of neutral Hydrogen in excess of . Such absorbers are known as Damped Ly Absorbers (DLAs), and hold a special interest because of the large amounts of cold gas locked up in those objects (Wolfe et al. WLF1995 (1995); Storrie-Lombardi et al. SLI1997 (1997)). It is commonly assumed that the DLAs are the progenitors of present day disk galaxies, but they have proven extremely difficult to identify (see e.g. Møller & Warren 1993; Kulkarni et al. 2000b ). Observational evidence has been accumulating (Møller & Warren 1998; Fynbo et al. FMW1999 (1999)) which suggests that a likely reason why DLA galaxies are so hard to identify is their small gas cross–sections and faint magnitudes, causing them to stay hidden under the point spread functions of the bright quasars. A GRB selected DLA galaxy sample would not be hampered by this problem once the OT has faded sufficiently, and could as such help greatly in understanding the nature of DLA galaxies. We shall therefore now briefly consider the low S/N part of the GRB spectrum below 4000 Å, to investigate if any information concerning the H i column density can be extracted.
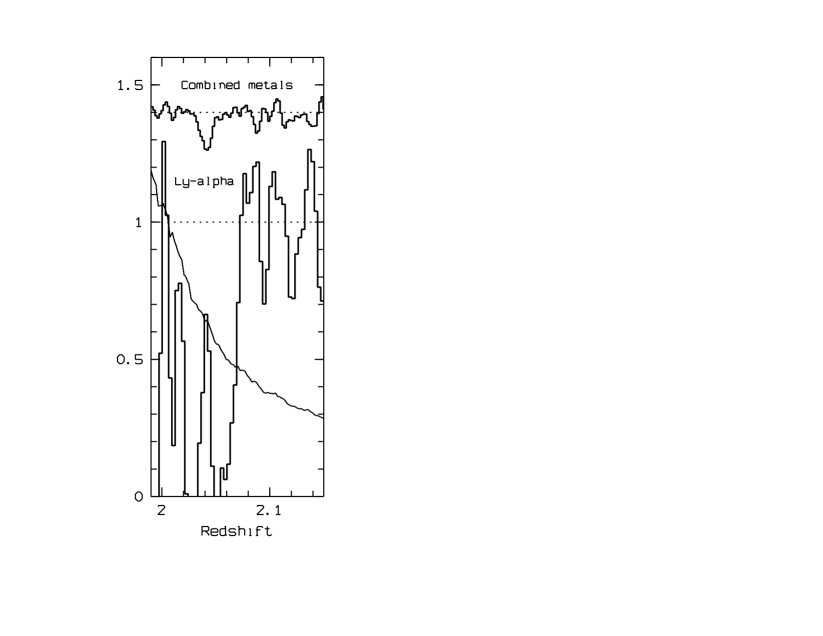
In Fig. 6 (lower panel) we have plotted the spectral region around Ly, and for comparison of redshifts, the “Combined Metals” feature (upper panel). Also plotted on the lower panel is the noise per bin (for redshift binsize = 0.003). It is clearly seen that the spectrum drops steeply before the expected central position of the Ly line, and well before the S/N drops below detection. One likely explanation for this is the presence of a very broad Ly absorption line. To quantify this we have modelled several Ly absorption lines, all at redshift 2.0404, and calculated the of their fit to the data in the range 3700 Å to 3750 Å. For N the per degree-of-freedom DOF is 6.46 which confirms that an absorption feature is indeed present. The formal minimum is found at N ( per DOF = 0.86), but any value within a factor 3 of this is acceptable.
It should be recalled that the above estimate, in a strict sense, only applies in the case the OT lies “behind” the absorbing cloud. In case the OT is in fact embedded “inside” a DLA cloud, resonant scattering of Ly photons may alter the profile of the absorption line somewhat. In the present case this is a detail which the quality of our data will not allow us to discern.
6.2 The multi-wavelength spectrum around March 4.5 UT
The wide wavelength coverage obtained around 2000 March 4.5 UT allows us to construct the multi-wavelength spectrum of the afterglow, by using our USNO and UKIRT data. Most fireball models (e.g. Sari et al. SPN1998 (1998); Piran P1999 (1999); Mészáros M1999 (1999) and references therein) and observations of previous afterglows suggest a power-law Spectral Energy Distribution (SED). However, a global fit to the broadband SED of GRB~000301C by Berger et al. (BSF2000 (2000)) demonstrates that the mm–optical range cannot be described by a single power-law. Thus, we have only considered wavelengths shorter than IR when fitting the SEDs presented in this section. This gives eight measurements in the period March 4.39–4.55 UT, namely UBVRIJHK. The eight measurements, plotted against together with the VLT spectrum in Fig. 7, allow us to constrain the SED of the OT at this epoch.


As extinction is highly wavelength dependent, a progressive deviation from a pure power-law fit can be explained as being due to dust extinction in the GRB host galaxy. In order to test this possibility, we first fit a power-law to the data in the NIR–optical range with the addition of an intrinsic extinction law, i.e., using the expression , where Aν is the rest frame extinction in magnitudes at the rest frame frequency . Four extinction laws have been applied in order to establish a relationship between Aν and . Following Rhoads & Fruchter (RF2001 (2001)), we have fitted the extinction curves for the Galaxy and Magellanic Clouds published by Pei (P1992 (1992)). Pei (P1992 (1992)) provides extinction laws for the Milky Way (MW), the Large Magellanic Cloud (LMC), and the Small Magellanic Cloud (SMC) based on their different proportions in the dust-to-gas ratio (1:1/5:1/10) and in the abundance of heavy elements (1:1/3:1/8). The most significant difference is the sequential change in the strength of the 2175 Å extinction feature, prominent for the MW, moderate in the LMC, and nonexistent for the SMC extinction curve. It is important to note that for the redshift of GRB~000301C this extinction feature falls in the observed R-band. So, the presence of this feature would result in a clear decrease in the R-band flux compared to the I and V-bands. The MW extinction curve requires an equal amount of graphite and silicate grains, while the SMC extinction curve can be explained by silicate grains only, with the LMC extinction law as an intermediate stage.
We have applied these four extinction laws to our data in order to infer qualitative information about the dust-to-gas ratio, the abundance of heavy elements and the composition of the dust in the host galaxy of GRB~000301C. We leave Aν as a free parameter, so fitting a function like allows us to determine and Aν simultaneously. The values of are displayed in Table 4 for each case.
A pure power-law fit () to the eight data points (after correction for Galactic extinction) leads to a reduced of 1.69 (see Table 4), making an acceptable description of the NIR–optical range of the SED. However, the fit can be improved if a modest amount of extinction is introduced. This is because the SED is slightly bending down towards higher frequencies (see Fig. 7). The eight data points show that there is not any presence of a redshifted 2175 Å absorption bump in the R-band at all. In short, the near-IR SED of GRB~000301C can be described as a curved power-law but with no broad absorption features.
As expected by the lack of the absorption bump in the R-band, the MW and the LMC extinction laws are completely inconsistent with our data. In fact, both fits imply an unphysical negative extinction (see Table 4). This is because the R-band flux is slightly over the linear interpolation between the I-band and V-band fluxes (in a Log-Log space), and both of these two extinction laws fit the 2175 Å bump as an emission feature instead of an absorption bump. To illustrate the problem with the MW and LMC extinction curves, we have, in the lower panel of Fig. 7, plotted the effect of having the MW and LMC extinction laws with the parameters derived for the SMC extinction law (=-0.7, AV=0.09). As seen, the shapes of both SEDs are incompatible with our UBVRIJHK measurements.
The quality of the MW, LMC and SMC and unextincted SEDs can also be compared checking the flux predicted at 250 (1+z) GHz (rest-frame), where Berger et al. (BSF2000 (2000)) reports a flux of 2.1 0.3 mJy at 250 GHz on March 4.29 UT. Extrapolating the four extinction curves, we obtain the following fluxes in increasing order; 5.0 mJy (SMC), 18.1 mJy (No extinction), 33.9 mJy (MW) and 51.6 mJy (LMC). As with the NIR–optical range, the SMC extinction provides the most reasonable results. The actual measured flux in mm is below the value predicted by the mm–optical extrapolation, because the pure power-law assumption is not correct in the mm-NIR spectral range and an additional curvature effect is present in the SED, as demonstrated by Berger et al. (BSF2000 (2000)) (see their Fig. 1). Thus, the value of A for the SMC-fit given in Table 4 should be taken as a good indication of the real extinction, although strictly speaking it is just an upper limit.
In conclusion, the featureless SMC extinction law provides the best fit to our data, improving the quality of the fit obtained for an unextincted afterglow (see Table 4). It is interesting to note the dramatic dependence of the quality of fit on the existence of the 2175 Å absorption bump. Extinction laws with high moderate dust-to-gas ratios that produce such an absorption feature do not provide good fits to our data points. Therefore, the spectral energy distribution of GRB~000301C supports a scenario where the host is in the early stages of chemical enrichment.
| /DOF | AV | ||
|---|---|---|---|
| mag | |||
| No extinction | 1.69 | 0.02 | 0 |
| MW, Pei (1992) | |||
| LMC, Pei (1992) | |||
| SMC, Pei (1992) | 0.91 | 0.09 | 0.09 0.04 |
The power-law + extinction fits to the SED in the NIR–optical range allow us to predict the UV flux at the spectral range of MAMA-HST when the UV spectrum was obtained at 2000 March 6.375 UT (Smette et al. SFG2000 (2000)) assuming that the shape of the SED has not changed between the two epochs. This assumption is supported by the imaging data (Sect. 6.3). First, we consider the best fit to the SED at 2000 March 4.39–4.55 UT and calculate the flux at March 4.39-4.55 UT at 3000 Å. Then, making use of the light curve models (presented in Table 6), we estimate the value of the flux at 3000 Å for March 6.375 UT. The predicted flux ranges from 5.9 erg cms-1 Å-1 to 7.9 erg cms-1 Å-1, depending on the light curve model. A final analysis (Smette et al. SFG2001 (2001)) of the MAMA-HST data revealed a flux of erg cm-1 consistent with our extrapolation.
6.3 Evolution of the spectral energy distribution
From our UBRI photometric data (presented in Table LABEL:TABLE:photometry) we have multi-band optical coverage from 2 to 10 days after the burst-trigger (on March 1.41 UT). When analysing the colours, we find that the simplest reliable fit is for constant colours. Thus we find no evidence for optical chromatic evolution for the afterglow during the period of observations (see Fig. 8). For these constant fits, we obtain the values presented in Table 5. These values are not corrected for Galactic or intrinsic extinction.
| Colour | Value | /DOF | P() | |
|---|---|---|---|---|
| UB | 0.06 | 0.41 | 0.26 | |
| BR | 0.91 | 0.03 | 1.67 | 0.83 |
| RI | 0.49 | 0.04 | 0.51 | 0.20 |
| BI | 1.43 | 0.05 | 0.33 | 0.14 |
| UI | 0.92 | 0.07 | 0.64 | 0.36 |
| UR | 0.40 | 0.05 | 1.35 | 0.75 |
| VR | 0.44 | 0.05 | - | - |

6.4 The light curve
According to the simple fireball model the optical afterglow should follow a power-law decay, (Sari et al. SPN1998 (1998)). However, a single power-law is excluded at more than the % confidence level. The parameters for this power-law are given in Table 6. The photometry suggests that the optical afterglow follows a shallow power-law decay for the first few days and then steepens. This behaviour has been seen previously in GRB~980519 (Jaunsen et al. J2001 (2001)), GRB~990123 (Kulkarni et al. KDO1999 (1999)), GRB~990510 (Harrison et al. HBF1999 (1999)), GRB~991208 (Castro-Tirado et al. CT2001 (2001)) and GRB~000926 (Fynbo et al. 2001b and is predicted by many models for gamma-ray bursts (see below). Sagar et al. (SMP2000 (2000)) report that there are seven components to the R-band light curve. Here we are primarily interested in the overall structure of the light curve, not the structure at small time scales. Therefore, we fit a broken power-law of the form,
| (1) |
to the UBRI data presented in Table LABEL:TABLE:photometry. The flux, in Jy, at time days after the burst is denoted by . The time of the break in the decay is denoted . The slope before the break is , and the slope after the break is . The flux at the time of the break is . We used CERN’s Minuit function minimization package, and a chi-square minimization scheme, to simultaneously solve for the four free parameters (, , , and ) and their formal 1- errors in the fit for each parameter.
The data was corrected for Galactic reddening and extinction before the fits were made. No corrections were made for reddening or extinction in the host galaxy. The photometry was transformed to the R band using the colours given in Table 5 and then converted to units of flux using a photometric zero point of erg cm-1 s-1 Hz-1 (Fukugita et al. FSI1995 (1995)).
The best fit to the combined UBRI photometry is listed in Table 6, and shown in Fig. 9. To test the sensitivity of the results to the fitting function, we also fit our data with the smooth function used by Stanek et al. (SGK1999 (1999), their Eq. 1) on GRB~990510. The results are given in Table 6. The broken power-law gives the smallest chi-square value, and the errors in the individual parameters are smaller for the broken power-law fit than they are for the smooth function. The correlation coefficient between and is and the coefficient between and is . The broken power-law fit is consistent with the data at the 43% confidence level. Even though we, from the theory of fireballs, would expect that the light-curve evolution is a smooth function, we find in the case of GRB~000301C, in agreement with Berger et al. (BSF2000 (2000)), that the broken power-law provides the most reliable fit. Additionally, a broken power-law provides the most reliable metod of determining the time when the decay of the light has steepened, and thus is a useful way of parameterising the data.
We combined all our UBRI-data (Table LABEL:TABLE:photometry) with those from the literature. Fig. 10 shows the best-fitting broken power-law for all of the UBRI data in the literature (Sagar et al. SMP2000 (2000) and references therein) and Table LABEL:TABLE:photometry. This data was shifted to the R band in the manner described above. The parameters of the fit are shown in Fig. 10 and are not significantly different from the parameters of the broken power-law that was fit to our data (see Table 6). The conspicuous short-term behaviour of the light-curve has been detailed by Masetti et al. (MBB2000 (2000)), Sagar et al. (SMP2000 (2000)) and Berger et al. (BSF2000 (2000)). Garnavich, Loeb & Stanek (GLS2000 (2000)) find that the variation of the lightcurve can be interpreted as a microlensing event, peaking about 3.5 days after the burst, superposed on a power-law broken at days. This superposed event peaks at a more sparsely sampled period in our data, coinciding partly with where we identify the break. Thus it is not possible, from our data, to further constrain the existence of such an event. We choose here to work only with the data presented in Table LABEL:TABLE:photometry as it represents a consistently derived set.
| Single Power Law | Broken Power Law | Smooth Function | |
| 0 | |||
| DOF | 4.499 | 1.023 | 1.090 |
| DOF | 33 | 31 | 31 |


7 Discussion
7.1 Interpretation of the light curve
The fit to the multi-colour light curves shows a break at days, with the light curve steepening from to , i.e., by . A broken light curve can arise in a number of circumstances: i) If the frequency separating fast cooling electrons from slow cooling ones moves through the optical at , the resulting light curve would steepen by (Sari et al. SPN1998 (1998)). ii) The light curve may also steepen if a spherical fireball slows down to a non-relativistic expansion (Dai & Lu DL1999 (1999)), resulting in for our value of . iii) If the outflow is collimated with a fixed opening angle, the break in the light curve occurs when the relativistic beaming of the synchrotron radiation becomes wider than the jet opening angle (Mészáros & Rees MR1999 (1999)). In this case the break is a geometrical effect and the steepening is . iv) If the afterglow arises in a sideways expanding jet, the steepening will be (Rhoads R1999 (1999)) for our value of . The above estimates all assume a constant mean density distribution of the ambient medium. We note that collimated outflows in general result in faster decaying light curves than the spherically symmetric ones. If the mean density distribution is not constant, e.g. it has a stellar wind density profile, the light curves also decay faster, but the break will be less pronounced (Panaitescu et al. PMR1998 (1998)).
Based on the light-curve properties alone, the model that best fits the observations is that of a sideways expanding jet in an ambient medium with a constant mean density distribution. In that interpretation, the observed light curve indices imply an electron energy distribution index of that results in a theoretical spectral index of 0.05. This is in agreement with the spectral index of 0.09 inferred from our spectroscopic observations when correcting for extinction in the host galaxy (Sect. 6.2), independently strengthening the described model for the afterglow.
With a combined fluence in the 25 – 1000 KeV range of erg cm-2, and a redshift of , the isotropic energy release of GRB 000301C is erg. Following Rhoads (R1999 (1999)), the energy estimate and the light curve break time, days, implies a jet opening angle, at that time, of , where is the number density of the ambient medium (in units of cm-3), and the break is assumed to occur when the opening angle equals the bulk Lorentz factor, .
This interpretation is similar to that of GRB 990510 which was almost 5 times more energetic, but had a jet opening angle of approximately , leading to an earlier break in the light curve. The best fit to GRB 990510 was a smooth function (e.g. Stanek et al. SGK1999 (1999); Harrison et al. HBF1999 (1999); Holland et al. HBH2000 (2000)), as compared to a broken power-law in the case of GRB 000301C.
7.2 The host galaxy
The host galaxy appears to be very faint. There is no evidence for any extended emission from a host galaxy in any of the data presented in this paper. Deep images obtained with HST+STIS about 1 month after the GRB indicate that any host galaxy must be R27.80.25 (Fruchter et al. FSG2000 (2000)). Hence, we can safely conclude that the host galaxy of GRB~000301C is very faint compared to other known populations of galaxies at high redshifts. From fitting extinction curves to our photometry, we have found evidence for some extinction ( 0.1) in the host galaxy. The AV derived from the best fit corresponds to an absorption at rest-frame 1500 Å of about 0.4 magnitudes.
For comparison, Lyman Break Galaxies (LBGs) at slightly higher redshifts (z 2.5–3.5) on average have values of extinction at rest frame wavelength 1500 Å of approximately 1.7 magnitudes, and, in rare cases up to 5 magnitudes (Steidel et al. SADP1999 (1999)). Hence, the faint optical appearance of the host galaxy relative to the star-forming LBGs at high redshift is most likely not imposed by massive extinction, but is rather due to a lower overall star formation rate of the host galaxy.
As the host galaxy furthermore has a very high H i column density, log(NH i)=21.20.5 as derived from the Ly absorption feature and supported by the strong Lyman break (Smette et al. SFG2000 (2000)), it is interesting to compare with the population of galaxies identified as Damped Ly Absorbers (Wolfe et al. WTS1986 (1986)) in the spectra of background QSOs. These galaxies have H i column densities higher than log(NH i)=20.3. Based on the luminosity function of LBGs and the typical impact parameters of DLAs, Fynbo et al. (FMW1999 (1999)) show that the majority of DLAs at must be fainter than the current flux limit for LBGs of R=25.5 and that there hence is a very abundant population of galaxies fainter than the LBG flux limit. A similar conclusion has been reached by Haehnelt et al. (HSR2000 (2000)). The dust-to-gas ratio towards the line-of-sight of GRB 000301C gives a value of AV/N( cm cm-2. This upper limit is, within errors, consistent with the expected AV/N( for DLAs. The corresponding value for the Milky Way is cm-2 (Allen ALL2000 (2000)).
It is still uncertain what fraction of the integrated star formation rate at high redshift is accounted for by the LBGs and what fraction has to be accounted for by galaxies further down the luminosity function. The relative occurrence of GRBs in a given population of galaxies is expected to be proportional to its relative contribution to the total star formation rate (Totani et al. T1997 (1997); Wijers et al. WBB1998 (1998); Mao & Mo MM1999 (1999); Blain & Natarajan BN2000 (2000)). However, so far only one GRB (GRB~971214 at ) is confirmed to have occurred in a galaxy similar to the faint members of the LBGs selected in ground based surveys (Odewahn et al. ODK1998 (1998)). The fact that GRB~000301C occurred in an intrinsically very faint galaxy and that most GRBs with identified OTs have occurred in L∗ or sub-L∗ galaxies, suggest that a large fraction of total star formation at high redshift occurs in a population of galaxies that is further down the luminosity function than the bright LBGs found in ground based surveys and that is likely to have a large overlap with the DLAs.
8 Conclusion
GRB~000301C is so far the GRB of shortest duration, for which a counterpart has been detected. The high-energy properties of the burst are consistent with membership of the short-duration class of GRBs, though GRB~000301C could belong to the proposed intermediate class of GRBs or the extreme short end of the distribution of long-duration GRBs. Our VLT-spectra show that GRB~000301C occurred at a redshift of 2.04040.0008. The light curve of the optical transient is well-fitted by a broken power-law and it is consistent with being achromatic. From the light-curve properties we find that the best model for GRB~000301C is that of a sideways expanding jet in an ambient medium of constant density. This interpretation is further supported by the achromatic light-curve evolution, and by the agreement between the theoretically predicted and observationally derived spectral indices. The spectral energy distribution at March 4.5 reveals SMC-like extinction in the host galaxy at a level of , which is significantly lower than for the strongly star-forming LBGs. Hence, the extreme faintness of the host galaxy indicates a low overall star-formation rate in the host galaxy, raising the possibility that the host may be a chemically less evolved, relatively low-luminosity galaxy containing SMC-type dust. We argue that there may be a connection between the host galaxy of GRB~000301C and DLAs, suggesting that substantial star-forming activity at high redshift takes place in relatively faint galaxies. Future studies of high redshift GRBs will further help explore this connection.
Acknowledgments
We wish to thank our anonymous referee for providing many helpful comments and suggestions. Support for this programme by the director of the Nordic Optical Telescope, professor Piirola, is much appreciated. We also acknowledge the assistance given by the ESO service observing team. J. Gorosabel acknowledges the receipt of a Marie Curie Research Grant from the European Commission. J. Hjorth acknowledges support from the Danish Natural Science Research Council (SNF). B. Thomsen acknowledges support from the Danish Natural Science Research Council for funding the Danish Centre for Astrophysics with the HST. G. Björnsson acknowledges support from the Icelandic Research Council and the University of Iceland Research Fund. I. Burud is supported by Pôle d’Attraction Interuniversitaire, P4/05 (SSTC, Belgium). K. Hurley acknowledges support for Ulysses operations under JPL Contract 958056, for IPN operations under NASA LTSA grant NAG5-3500, and for NEAR operations under the NEAR Participating Scientist program. We are grateful to R. Gold and R. McNutt for their assistance with the NEAR spacecraft. R. Starr is supported by NASA grant NCC5-380. We are indebted to T. Sheets for her excellent work on NEAR data reduction. Special thanks also go to the NEAR project office for its support of post-launch changes to XGRS software that made these measurements possible. In particular, we are grateful to John R. Hayes and Susan E. Schneider for writing the GRB software for the XGRS instrument and to Stanley B. Cooper and David S. Tillman for making it possible to get accurate universal time for the NEAR GRB detections. The data presented here have been taken using ALFOSC, which is owned by the Instituto de Astrofisica de Andalucia (IAA) and operated at the Nordic Optical Telescope under agreement between IAA and the NBIfAFG of the Astronomical Observatory of Copenhagen. Additionally, the availability of the GRB Coordinates Network (GCN) and BACODINE services, maintained by Scott Barthelmy, is greatly acknowledged. We acknowledge the availability of POSS-II exposures, used in this work; The Second Palomar Observatory Sky Survey (POSS-II) was made by the California Institute of Technology with funds from the National Science Foundation, the National Aeronautics and Space Administration, the National Geographic Society, the Sloan Foundation, the Samuel Oschin Foundation, and the Eastman Kodak Corporation.
References
- (1) Allen C. W., “Allen’s Astrophysical Quantities”, 4th edition 2000, Eds. A. N. Cox
- (2) Andersen M.I., Hjorth J., Pedersen H. et al., 2000, A&A 364L, 54A
- (3) Berger E. & Frail D.A, 2000, GCN 590
- (4) Berger E., Sari R., Frail D.A., et al., 2000, ApJ 545, 56B
- (5) Bernabei S., Marinoni S., Bartolini C., et al., 2000, GCN 571
- (6) Bertoldi F., 2000, GCN 580
- (7) Blain A.W. & Natarajan P., 2000, MNRAS 312, L39
- (8) Bloom J.S., Diercks A., Djorgovski S.G., et al., 2000, GCN 661
- (9) Bloom J.S., Kulkarni S.R., Djorgovski S.G., et al., 1999, Nature 401, 453
- (10) Bridger A., Wright G.S., Economou F., et al., 2000, in Ed. H. Lewis, Advanced Telescope and Instrumentation Control Software, Proc SPIE Vol 4009, in press
- (11) Castro S.M., Diercks A., Djorgovski S.G., et al., 2000, GCN 605
- (12) Castro-Tirado A. & Gorosabel J., 1999, A&AS 138, 449
- (13) Castro-Tirado A., Sokolov V. V., Gorosabel J., et al., 2001, A&A, in Press.
- (14) Costa E., et al., 1997, Nature 387, 783
- (15) Dai C.G., Lu T., 1999, ApJ 519, L155
- (16) Feng M., Wang L., Wheeler J. C., 2000, GCN 607
- (17) Fruchter A., Smette A., Gull T., et al., 2000, GCN 627
- (18) Fukugita M., Shimasaku K., Ichikawa T., 1995, PASP 107, 945
- (19) Fynbo J.U., Møller P., Warren S.J., 1999, MNRAS 305, 849
- (20) Fynbo J.P.U., Jensen B.L., Hjorth J., Pedersen H., Gorosabel J., 2000a, GCN 570
- (21) Fynbo J.P.U., Jensen B.L., Hjorth J., Pedersen H., Gorosabel J., 2000b, GCN 576
- (22) Fynbo J.P.U., Jensen B.L., Gorosabel J., et al., 2001a, A&A, In press (astro-ph/0101425)
- (23) Fynbo J.P.U., Gorosabel J., Dall T.H., et al., 2001b, A&A, submitted (astro-ph/0102158)
- (24) Galama T.J., Vreeswijk P.M., Paradijs J. van, et al., 1998, Nature 395, 670
- (25) Galama T.J., Tanvir N., Vreeswijk P.M., et al., 1999, ApJ 536, 185
- (26) Garnavich P., Barmby P., Jha S., Stanek K., 2000, GCN 573
- (27) Garnavich P., Loeb A., Stanek K.Z., 2000, ApJ, in press (astro-ph/0008049)
- (28) Granot J., Piran T., Sari R., 1999a, ApJ, 513, 679
- (29) Granot J., Piran T., Sari R., 1999b, ApJ, 527, 236
- (30) Haehnelt M.G., Steinmetz M., Rauch M., 2000, ApJ 534, 594
- (31) Harrison F.A., Bloom J.S., Frail D.A., et al., 1999, ApJ 523, L121
- (32) Henden A., 2000, GCN 583
- (33) Henden A., 2001, GCN 961
- (34) Holland S., Björnsson G., Hjorth J., Thomsen B., 2000, A&A, In press (astro-ph/0010196)
- (35) Hurley K., et al. in Gamma-Ray Bursts, Huntsville 1991, AIP Conf. Proc. (AIP New York) 265, p. 3, 1992a
- (36) Hurley K., Sommer M., Atteia J.-L., et al., 1992b, A&AS 92, 401
- (37) Jaunsen A. O., Hjorth J., Björnsson G., et al., 2001, ApJ 546, 127J
- (38) Klose S., Stecklum B., Fischer O., et al., 2000, GCN 645
- (39) Kobayashi N., Goto M., Hiroshi T., et al., 2000, GCN 577
- (40) Kouveliotou C., et al., 1995, in Proc. 3rd Huntsville Symp. on Gamma-Ray Bursts, Ed. C. Kouveliotou, M. F. Briggs & G. Fishman, AIP Conf. Proc., New York, p. 42
- (41) Kulkarni S.R., Berger E., Bloom J.S., et al., 2000a, To appear in Proc. of the 5th Huntsville GRB Symposium (astro-ph/0002168)
- (42) Kulkarni S.R., Djorgovski S.G., Odewahn S.C., et al., 1999, Nature 398, 389
- (43) Kulkarni V.P., Hill J.M., Schneider G., et al., 2000b, ApJ 536, 36
- (44) MacFadyen A.I., Woosley S.E, 1999, ApJ 524, 262
- (45) Mao S., Mo H.J., 1999, A&A 339, L1
- (46) Masetti N., Bartolini C., Bernabei S., et al., 2000, A&A 359, L23
- (47) Mészáros P., 1999, to appear in “Black Holes and Gravitational Waves – New Eyes in the 21st Century” (eds. T. Nakamura et al.) (astro-ph/9912546)
- (48) Mészáros P., Rees M.J., 1999, MNRAS 306, 3, L39
- (49) Metzger M.R., Djorgovski S.G., Kulkarni S.R., et al., 1997, Nature 387, 878
- (50) Møller P., 2000, The Messenger 99, 31
- (51) Møller P., Warren S.J., 1993, A&A 270, 43
- (52) Møller P., Warren S.J., 1998, MNRAS 299, 661
- (53) Mukherjee S., Feigelson E.D., Babu G.J., et al., 1998, ApJ 508, 314
- (54) Odewahn S.C., Djorgovski S.G., Kulkarni S.R., et al., 1998, ApJ 509, L5
- (55) Paciesas W.S., Meegan C.A., Pendleton G.N., et al., 1999, ApJS 122, 465
- (56) Panaitescu A., Mészáros P., Rees M.J., 1998, ApJ 503, 314
- (57) van Paradijs J., Groot P.J., Galama T., et al., 1997, Nature 386, 686
- (58) Pei Y.C., 1992, ApJ 395, 130
- (59) Piran T., 2000, “Gamma Ray Bursts: The First Three Minutes” (Ed. Juri Poutanen) (astro-ph/9907392)
- (60) Reichart D.E., 1999, ApJ 521, L111
- (61) Rhoads J.E. 1999, ApJ 525, 737
- (62) Rhoads J.E. & Fruchter A.S., 2001, ApJ 546, 117R
- (63) Sagar R., Mohan V., Pandey A.K., et al., 2000, Bull. Astron. Society of India 28, 499
- (64) Sari R., Piran T., Narayan R., 1998, ApJ 497, L17
- (65) Schlegel D.J., Finkbeiner D.P., Davis M., 1998, ApJ 500, 525
- (66) Smette A., Fruchter A., Gull T.R., et al., 2000, GCN 603
- (67) Smette A., Fruchter A., Gull T.R., et al., 2001, ApJ, submitted (astro-ph/0007202)
- (68) Smith D.A., Hurley K., Cline T., 2000, GCN 568
- (69) Stanek K.Z., Garnavich P.M., Kaluzny J., Pych W., Thomson I., 1999, ApJ 522, L39
- (70) Stecklum B., Klose S., Fischer O., et al., 2000, GCN 572
- (71) Steidel C.C., Adelberger K.L., Dickinson M., Pettini M., 1999, In the proceedings of the Xth Rencontres de Blois, “The Birth of Galaxies”, in press
- (72) Stetson P., 1987, PASP 99, 191S
- (73) Stetson P., 1997, “User’s Manual for DAOPHOT II”
- (74) Storrie-Lombardi L.J., Irwin M.J., and McMahon R.G., 1997, MNRAS 283, L79
- (75) Totani T., 1997, ApJ 486, L71
- (76) Veillet C., 2000, GCN 575
- (77) Wijers R.A.M.J., Bloom J.S., Bagla J.S., Natarajan P., 1998, MNRAS 294, L13
- (78) Wolfe A.M., Lanzetta K.M., Foltz C.B., Chaffee F.H., 1995, ApJ 454, 698
- (79) Wolfe A.M., Turnshek D.A., Smith H.E., Cohen R.D., 1986, ApJS 61, 249