Accretion disk models and their X-ray reflection signatures. I. Local spectra.
Abstract
X-ray illumination of accretion disks is an invaluable diagnostic of the structure of these disks because of the associated iron K emission. Here we point out that the resulting reflected spectra depend very sensitively on the geometry of the X-ray source, and that this fact can be efficiently used to test these models observationally. In particular, we discuss three different accretion disk geometries: the “lamppost model”, accretion disks with magnetic flares, and the model with a full corona overlying a cold thin disk. We show that in the case of the lamppost model, unless the X-ray luminosity of the central source is larger than that of the cold disk by a factor of 10 or more, a significant fraction of iron in the ionized skin of the disk is in the hydrogen and helium-like ions. Because these ions have large fluorescence yields, the resulting reflected spectra look strongly ionized, with Equivalent Width (EW) of the line increasing with X-ray luminosity up to the maximum of eV. This situation contrasts to the magnetic flare model, where the large X-ray flux near flares completely ionizes the skin of the disk and thus the resulting spectra appear to be that from a neutral material. The line EW in this model anti-correlates with X-ray luminosity, and becomes arbitrarily small when is a good fraction of the Eddington luminosity. Finally, in the full corona case, due to the additional pressure and weight of the corona, the gas pressure (and its density) below the corona is always large enough to make the gas very cool and effectively neutral. No highly ionized skin forms in such a model. If the corona is Thomson thin, then EW of the line does not depend on the accretion disk or corona luminosities for the full corona model.
Subject headings:
accretion, accretion disks —radiative transfer — line: formation — X-rays: general — radiation mechanisms: non-thermal1. Introduction
X-ray illumination of accretion disks in Active Galactic Nuclei (AGN) and Galactic Black Hole Candidates (GBHC) is a phenomenon of a great observational importance with implications for theories of accretion disks (AD). Since X-rays often produce a non-trivial part of the overall bolometric luminosity of AGN and GBHCs, it is clear that X-ray heating of the accretion disk surface may change the energy and ionization balance there, causing corresponding changes across the entire electromagnetic spectrum emitted by these objects. In addition, detailed calculations predict that spectra should contain many potentially observable atomic lines, edges, recombination continua, etc. Therefore, comparison of theoretical models (which are parameterized by few parameters only) and observations presents an invaluable opportunity to solve the inverse problem of Astrophysics of ADs – that is to learn about the accretion disk structure from observed spectra.
This is why so much theoretical effort has gone into studies of the X-ray illumination problem in the last few decades. A first detailed account of the problem can be found in Basko, Sunyaev & Titarchuck (1974)111These authors considered X-ray illumination of the surface of a normal star in an X-ray binary, but this problem is almost identical to the one of X-ray illuminated ADs.. A further important development was done by Lightman & White (1988) and White, Lightman & Zdziarski (1988) who provided fitting formulae to the results of their Monte-Carlo simulations of reflection off neutral matter, which allowed X-ray observers to use these formulae to make direct fits to data. In addition, Fabian et al. (1989) have shown that the relativistically smeared fluorescent K line emission of ADs yields characteritic line profiles that can be used to constrain geometry of accretion disks. A number of authors expanded on these studies since then (e.g., George & Fabian 1991; Done et al. 1992; Ross & Fabian 1993; Matt, Brandt & Fabian 1996; ycki et al. 1994; Czerny & ycki 1994; Krolik, Madau & ycki 1994; Magdziarz & Zdziarski 1995; Ross, Fabian & Brandt 1996; Matt, Fabian & Ross 1993, 1996; Poutanen, Nagendra & Svensson 1996; Blackman 1999)
However, except for Basko et al. (1974), the authors of the publications referenced above either studied a non-ionized reflection, or assumed that the density of the illuminated gas is constant with height for the more complicated ionized reflection calculations. Raymond (1993) and Ko & Kallman (1994) considered the problem of X-ray illumination of an accretion disk in Low Mass X-ray Binaries (LMXB) relaxing the assumption of the constant gas density and instead solving for the density via hydrostatic balance. Róańska & Czerny (1996) also included hydrostatic balance in their semi-analytical study of X-ray illumination in AGN. Nayakshin, Kazanas & Kallman (2000; hereafter NKK) extended results of Róańska & Czerny (1996) for the inner parts of ADs in AGN and GBHCs by providing an accurate radiation transfer in the optically thick illuminated slab. All these authors found that the thermal ionization instability, previously well known in the context of the AGN emission line regions (e.g., Krolik, McKee & Tarter 1981), plays a crucial role in the establishing of the equilibrium temperature and density profiles of the X-ray illuminated gas. Through these profiles, the instability is directly involved in the formation of the reflected continuum spectrum as well as fluorescent line emission, such as that of iron K lines.
While the fixed density models are out of hydrostatic balance (e.g., the gas pressure at the top of the illuminated layer may be up to few hundred times larger than that on the bottom of the layer), one could still hope that the main results of such calculations will apply to the more realistic hydrostatic balance models. However, NKK compared spectra obtained from these two classes of models, and found that the predictions of these two models for the behavior of the iron K lines, edges, and all the other features of the reflected spectrum are very different.
In this paper, we use the code of NKK to make a detailed analysis of local reflected spectra in two physically distinct limits222We specifically limit our attention to single radius unsmeared spectra to expose the physics of the problem clearer. Full disk spectra with relativistic energy shifts will be presented in a separate publication. We will show that these two classes of models lead to completely different reflection spectra unless accretion rate is very small (, see below).
In one limit, the X-ray flux illuminating the disk, , is smaller than , the flux of the soft thermal emission intrinsically generated in the disk. Physically, the situation occurs in the so-called “lamppost model”, where the X-rays are produced high above the black hole, so that they illuminate a large portion of the innermost disk region. Roughly speaking, the X-ray illuminating flux is , where , where is Schwartzchild radius.
In the other case, the X-ray flux exceeds the disk flux by a large factor. This situation occurs when the X-ray luminosity is produced within magnetic flares, such that most of the X-ray reflection happens near the flare locations. The physical distinction from the lamppost model is that the same X-ray luminosity originates much closer to the disk surface because magnetic loops are expected to be of the order of few disk height scales, which is much smaller than radius for thin disks. Hence, the X-ray illumination will be spread over the disk surface very unevenly. The covering fraction of magnetic flares, , may be quite small (see estimates in Nayakshin 1998b, §2.5.5). Most of the disk will receive little X-ray illumination, whereas near the flares and thus is very likely to exceed . It is also well known that is in fact a necessary condition for the magnetic flare model to reproduce the continuum X-ray and UV spectra of AGN and GBHCs (see Haardt, Maraschi & Ghisellini 1994; Svensson 1996; Nayakshin 1998a).
In addition, we discuss the ionization equilibria in the geometry of a full corona overlying a cold accretion disk. We consider coronae heated from below and also coronae heated by internal viscous dissipation (as those thought to exist in the transition region of the Advection Dominated Accretion Flows – e.g., Esin, McClintok & Narayan 1997). In both of these cases we show that the ionization equilibria permit only cold solutions for the material below the corona. Therefore, reflected spectra from such a material should look “neutral”. We believe that the predictions of these three models are sufficiently different to allow these models to be be meaningfully tested against observations with existing and future data.
The structure of the paper is as follows. In §2 we describe the way in which several parameters important for the X-ray illumination caluclations can be deduced for any accretion disk theory once broad band spectrum of an accreting source is known. In §3 and §4 we present our calculations for the lamppost and magnetic flare models, respectively. In §5 we consider the X-ray illumination for the full corona case. We give an extended discussion of our results in §6 and in §7 we present our conclusions.
2. On predictive power of X-ray illumination calculations
Calculations of the X-ray reflected spectra is a very powerful tool with which to infer the structure of ADs around compact objects. The value of such calculations is currently under-estimated, we believe, and this is why we will now explain how these calculations should be used in order to constrain accretion disk theories and why the results of such calculations are quite robust. Let us assume that we have a well resolved broad band spectrum of an AGN with the total luminosity , and that the integrated optical-UV luminosity is , whereas that of the entire X-ray range is (so that ).
One can now assume a value for the black hole mass, , and then investigate a particular accretion disk theory. For example, if the disk structure is given by the Shakura-Sunyaev theory, then we can (1) find the dimensionless accretion rate , where is the Eddington luminosity for the mass ; (2) determine the disk flux, , and the disk height scale, , for every radius. The next step is to use the geometry of the X-ray source appropriate for the given model to infer how the X-ray illuminating flux is distributed over the disk surface. With this, there are no uncertainties in the resulting reflected spectra beyond geometry and value of . This is because the gravity parameter , defined by NKK, is none other than the ratio of the vertical component of the gravitational force, , at the height of one disk height scale to the radiation pressure force, , that the X-ray flux would provide if the cross section were given by the Thomson value ( is the electron density assuming that H and He are completely ionized):
| (1) |
Hence, once the accretion disk structure is prescribed, and is known, the reflection calculations will provide a definite outcome that can be compared with observations.
We emphasis that this has not been possible in the context of the conventional constant density models. In the context of those models, the gas density in the midplane of the disk, , is the primary parameter, since it enters the definition of the ionization parameter (see, e.g., ycki et al. 1994). Because for radiation-dominated ADs, where is the Shakura-Sunyaev viscosity parameter (see Shakura & Sunyaev 1973), ionization parameter scales as . For gas-dominated disks, recent MHD simulations give (e.g., Miller & Stone 2000). Observations of disks in Cataclismic Variables seem to imply (Smak 1984; 1999), but it is also not unusual to invoke values of (e.g., Esin et al. 1997) or even closer to unity. For radiation dominated disks, the value of is even less certain, because it is not clear whether the viscosity in such disks will scale with total or only the gas pressure (see, e.g., Stella & Rosner 1984; Nayakshin, Rappaport & Melia 2000), so in principle the value of the “efective” can be as small as . Therefore, the results of the constant density models may be uncertain by a factor of (!).
Our calculations avoid this problem because the value of the gas density (or total pressure) in the midplane has very little influence on the final result. The important parameter is the height, , at which the bottom of the ionized skin is located because that defines the value of the gravitational force . The pressure at is very small compared with the disk mid-plane pressure. Since at the pressure declines very quickly with height (exponentially – see, e.g., Shakura & Sunyaev 1973), a large change in will lead only to a logariphmic change in (see also Nayakshin 2000 on that). In other words, the most important parameter of our calculations – the gravity parameter – depends on only logariphmically333This is similar to stellar atmospheres – clearly, it is the gravity and the star’s radius that are important, not the gas density in the center of the star..
Finally, one does not have to assume that the structure of the illuminated AD is given by the Shakura-Sunyaev theory. Any other AD theory may be used to prescribe the vertical disk structure and then calculations proceed in exactly the same way as they would for a SS disk.
3. Lamp Post model: the “warm skin” limit.
3.1. Physical setup and method of calculation
In this section we will assume that all the X-rays are produced within a point-like source located above the black hole on the symmetry axis. Although there is no solid physical justification for the location of the X-ray source directly above the black hole, this geometry can be used as a testing ground for studying complex phenomena, such as iron line reverberation (e.g., Reynolds & Begelman 1997; Reynolds et al. 1999; Young & Reynolds 2000). We will neglect special and general relativistic effects as we concentrate on the physics of the local (i.e., at a given disk radius ) ionization balance. We restrict our attention here to .
We use the code of NKK to solve the X-ray illumination problem. Several input parameters are (1) the disk accretion rate, , measured in the Eddington units such that corresponds to the disk luminosity equal to the Eddington luminosity; (2) the luminosity of the X-ray source, parameterized in terms of the ratio of the latter to the disk integrated luminosity, (see Nayakshin 2000); (3) the cosine of the X-ray incidence angle that is fixed by values of and (). For the most tests in this paper, we fixed at a value of .
3.2. Temperature profiles
Figure 1 shows the resulting temperature profiles for the X-ray illuminated upper layer of the disk for and the accretion rate scanning a range of values from the low value of to high of . The case with is the least ionized one, and it corresponds to the left most curve in Fig. 1 (only the first zone is highly ionized, and all the rest are at the temperature eV). The next curve to the right was computed for , and all the subsequent curves are computed with increasing by a factor of 2 from a previous value. We will refer to these runs by their number, such that the least ionized case is referred to as and the most ionized as ( stands for “warm”).

The temperature of the ionized skin will later be shown to be decisive in establishing the nature of the reflected spectra. It is important to note that the maximum gas temperature is almost the same in all of these cases, and that it is far below , the Compton temperature corresponding to the X-ray flux only. This is why we refer to the given limit as the “warm skin” limit to distinguish it from the “hot skin” limit studied in §4 below. In the Eddington approximation, one can easily show that the value of the Compton temperature at the top of the skin is approximately given by
| (2) |
From this equation it is apparent that the skin is much cooler than the X-ray Compton temperature because of the presence of the large intrinsic disk flux, . Therefore, physically, the warm skin limit corresponds to the case , whereas the hot skin results when (and the X-ray spectrum is hard such that is high).
3.3. Reflected spectra
Figure 2 shows angle-averaged reflected spectra in the range from 10 eV to about 100 keV. The ionizing X-ray spectrum is drawn with the dashed-dotted curve. All the spectra are normalized in such a way that for convinience. The least ionized reflected spectrum corresponds to the run , and the subsequently more ionized spectra are for the tests , , , and . The coldest case () is basically the usual neutral reflection component that has almost no reflected flux below few keV all the way down to few , where the emission is dominated by a quasi-black body reprocessed flux.
Figure 3 shows the same spectra in a narrower energy range. The spectra are also shifted with respect to each other to allow for a greater visibility of the individual curves. It is immediately clear that except for the least ionized case on the bottom of the Figure, all the other spectra are strikingly different from the neutral reflection spectrum. Note that the energy of the dominant line component is around 6.7 keV and it comes from He-like iron mainly (see §3.4 below). The line Equivalen Width (EW) is about 180 eV in the coldest case and it increases to about 500 eV in the run , which is consistent with earlier findings of Matt, Fabian & Ross (1996). Note also a very prominent ionized absorption edge and the recombination continuum at keV. Other significant spectral features are labeled directly in Figure 3.
3.4. Ionization Structure of the gas
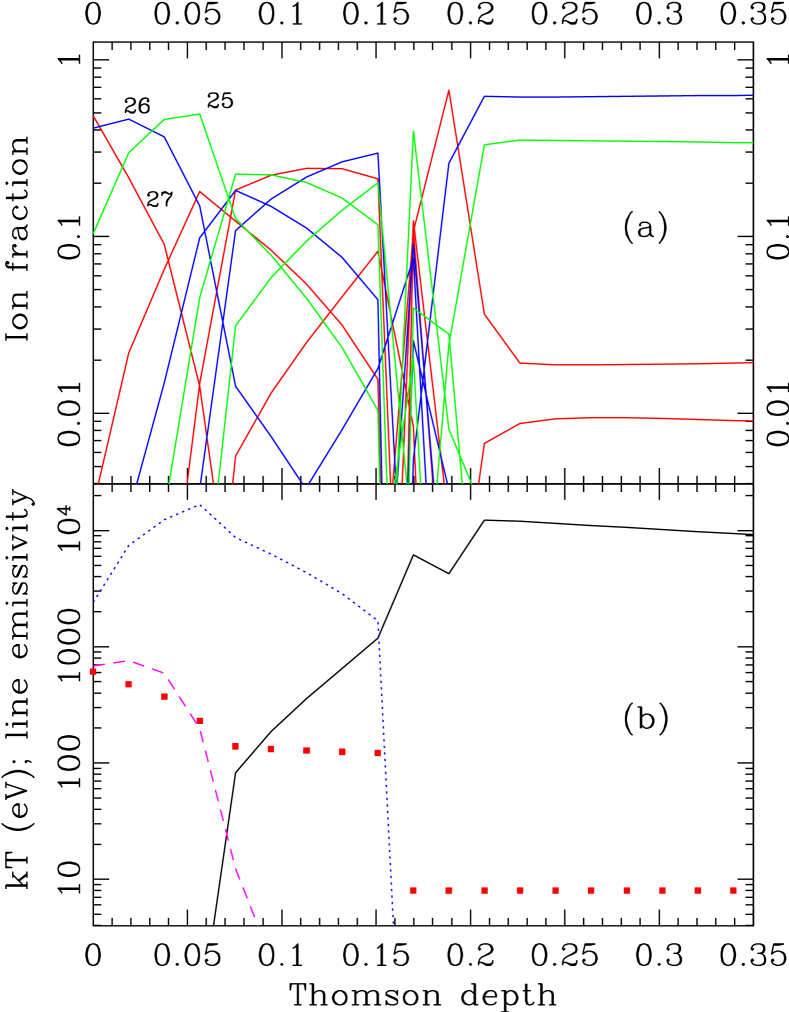
The key to understanding the reflection spectra is the ionization structure of the gas, shown in Figure (4) for iron for run . Panel (a) of the Figure shows ionic fractions of different ionization stages of iron (Fe27 completely ionized iron) as a function of the Thomson depth. These fractions are defined as the ratio , where is the density of the ionization stage and is the total local density of iron. The most important fact from the Figure is that the skin is highly ionized, but it is far from being completely ionized. Even in the uppermost zone, more than 50% of iron is in the form of Fe26 and Fe25, and this fraction quickly increases to almost 100% at deeper layers (and then goes to zero as less ionized ions start to dominate). Panel (b) of Figure 4 shows the K line emissivity as a function of Thomson depth. The line emissivity is split onto several components. In particular, the dashed line shows the line emission in the energy bin that contains the H-like iron line at keV; the dotted curve shows the line emission in the bin that contains the He-like line at keV plus some lines from intermediate ionization stages of ions Fe17-Fe23; and finally, the solid curve shows the line emission in the bin that includes the “neutral”-like line from ions Fe1-Fe16 with keV.
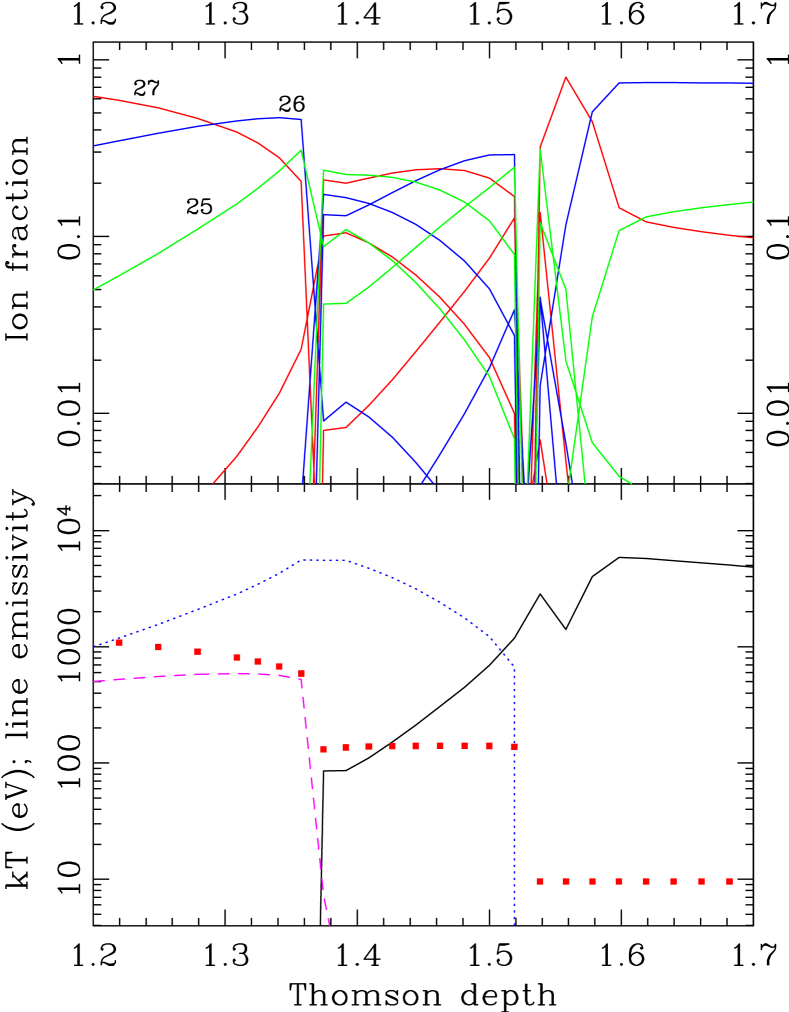
Note that the skin emits a strong He-like line. Moreover, in the test , whose ionization structure is shown in Figure 5, the “6.7 keV line” bin dominates the line emissivity by far. In addition, other strong features from the soft X-ray band to the iron recombination continuum allow us to state the following general point: because the warm skin is not completely ionized, it produces strong atomic emission and absorption features that should be observable in spectra of many bright AGN (if this model is the physically correct one).
4. X-rays from magnetic flares: hot skin limit
4.1. Setup
We now will study the case in which the ionizing flux is much larger than the disk soft flux, , which is thought to be appropriate for the two-phase patchy corona model of Seyfert Galaxies (e.g., Haardt, Maraschi & Ghisellini 1994 and Svensson 1996). In that model, the X-rays are produced within magnetic flares (Galeev, Rosner & Vaiana 1979). The condition is a necessary condition for the model to work, since it comes from the requirement that Compton cooling of the X-ray producing active regions by the soft disk photons not be too strong, because otherwise the continuum spectra are too steep to explain typical Seyfert 1 spectra and much less that of GBHCs in their hard state (e.g., Gierlinski et al. 1997; Dove et al. 1997; Nayakshin 1998a). As we discussed in NKK, the X-rays induce evaporative winds close to the flare location, so that hydrostatic balance does not apply in a direct sense. However, based on earlier work on X-ray induced winds in stars (e.g., McCray & Hatchett 1975; Basko et al. 1977; London, McCray, & Auer 1981, and references therein) one expects to see the same two-layer structure for the illuminated gas. In the geometry of thin accretion disks, the winds will decrease the value of the Thomson depth of the skin by pushing the ionized material along the disk away from the flare location. A careful multi-dimensional calculation including gas dynamics, ionization and radition transfer is needed. Such calculation is beyond the scope of this paper, but we attempt to model the effects of the wind in a simple manner.
From the point of view of ionization calculations, the gas density structure is of paramaunt importance for a self-consistent solution. The gas density where the temperature discontinuity sets in is expected to be the same or roughly the same in both static and wind situations because this density is set by the energy balance that is largely given by radiation heating/cooling and thus is independent of whether the gas is static or moving non-relativistically. The density gradient is then the quantity of the primary interest. In the hydrostatic case, this gradient is given by the gravity in the approximately isothermal skin (the gas temperature in the skin varies by a factor of order of few only, see Nayakshin 2000). In the case of the wind, the gas density gradient is controlled by the radiation pressure, gravity and gas pressure forces. A simple estimate shows that the ratio of the gravitational force to the radiation pressure force is of the order of , which is much less than unity for magnetic flares. Hence, the gas density gradient is controlled by the radiation pressure mainly and is (very roughly!) times the one which is given by the gravity.
In the absense of a multi-dimensional radiation hydrodynamics and radiation transfer approach, we resort to treating the complications due to the wind by artificially increasing the value of the local gravity in the atmosphere of the disk, which, in some sense, leads to the same end result – a lower value of for a given (as compared with the one that would have been obtained if there were no winds). Mathematically this is done by multiplying the local gravity gradient () by a dimensionless number . Note that this approach is similar to the one we adopted in most of the calculations presented in NKK, although the gravity parameter defined there is different from the parameter defined here.
In terms of the final results for the magnetic flare model, the poorly constrained value of means that the Thomson depth of the ionized skin is not calculated exactly and represents a current uncertainty of the model. However, we believe that, for a given value of , the ionization structure of the illuminated gas is calculated with a reasonble precision and thus this aspect of calculations is reliable. Moreover, it is encouraging that the uncertainties of the model due to the wind do not present an unsurmountable obstacle because X-ray induced winds from accretion disks and stars have been treated by many different authors (e.g., Buff & McCray 1974; McCray & Hatchett 1975; Begelman, McKee & Shields 1983; Proga, Stone & Drew 1999). We plan to incorporate evaporative winds in our calculations in the future.
4.2. Temperature profiles
Figure 6 shows temperature profiles for the illuminated gas. From these profiles, one can immediately see why we refer to the limit as the hot skin limit. The Compton temperature of the gas is much higher than that in the case which can be understood from equation 2. Although the X-ray Compton temperature is the same in both cases, the local Compton temperature is determined by the X-rays and the disk soft flux, so that in the case , is a small fraction of . Also note that the middle branch of the S-curve (the region with eV) does not appear in Figure 6 until the skin becomes moderately thick. This is due to the fact that the middle branch of the S-curve is available only when the average photon energy in the overall illuminating specrum is low enough (see §6.1). The latter condition can be satisfied in the given case only by Compton downscattering of the incident hard X-rays, which becomes significant when .
4.3. Reflected spectra
Figures 7 and 8 show the reflected spectra for the hot skin limit. This is the limit previously discussed by NKK. The strongest line component is at 6.4 keV, the iron absorption edge is neutral-like and is weak, and only few of the spectra exhibit some soft X-ray emission. The latter is due to the fact that the skin is more strongly ionized than it is in the warm skin limit, and thus reflection in the soft X-ray range is dominated by the Compton reflection in the skin. Below keV, the highest ionization spectra can hardly be distinguished from the illuminating power-law, especially if one adds the additional smearing due to relativistic effects in vicinity of the black hole. This might be the reason why GBHCs do not show broad iron lines and a somewhat small reflection covering fraction (see Gierlinski et al. 1997 and references therein, and also see Nayakshin 1998a; Ross, Fabian & Young 1999; Done & Nayakshin 2000).
4.4. Ionization Structure of the gas
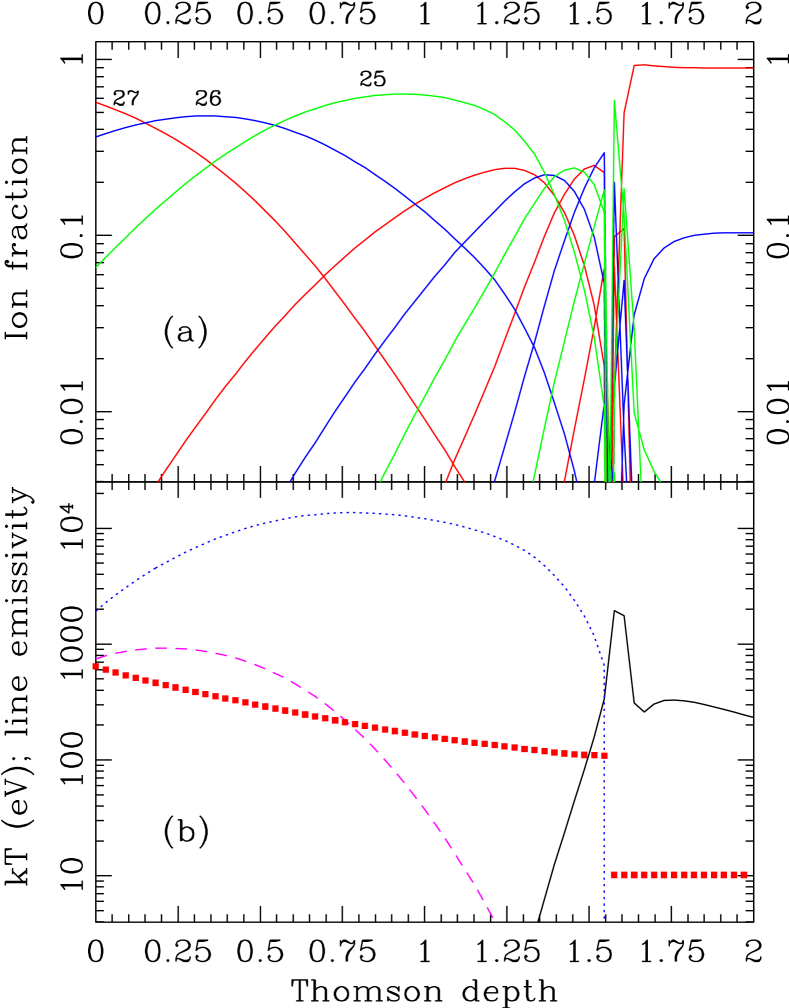
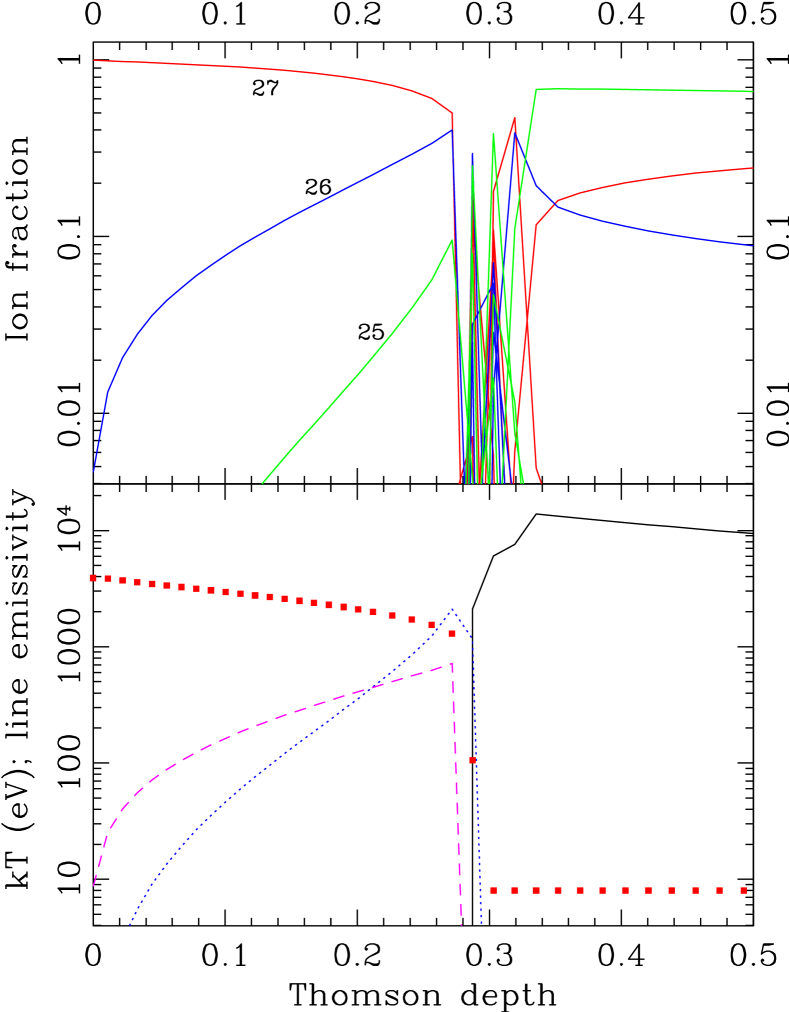
Figures 9 and 10 show the ionic fractions and line emissivity of the illuminated gas for tests and , respectively. These figures are to be compared with the figures 4 and 5 for the warm skin tests and . The biggest difference is in the fact that the hot skin is almost 100% ionized except for regions near the temperature discontinuity, whereas the warm skin is dominated by H- and He-like iron. This is the reason why the line emissivity is dominated by the “cold” line coming from the cool material below the skin. The skin thus only masks the presence of the cold gas. In addition, because the skin is hot, Oxygen, Sulfur, Silicon and Neon are completely stripped of their electrons, and thus there are no broad recombination edges or line emission from these elements at least from the skin itself.
5. Full corona above a standard disk
We will now consider X-ray reflection in the geometry of a full corona covering the whole inner accretion disk. This geometrical arrangement is physically rather different from the two other geometries that we studied so far, because for the latter two, the X-ray producing region does not directly border the illuminated surface of the disk. In other words, there is no material above the top of the skin, and hence the gas pressure at the top of the skin, , is zero. This fact is used as an explicit boundary condition and affects all aspects of the X-ray illumination problem. In the case of the full corona, the pressure at the top of the skin is not zero, and by continuity arguments, , where is the gas pressure at the bottom of the corona. Assuming that the X-ray flux produced in the corona is radiated isotropically, there is an equal amount of the X-rays emitted down to the disk and up away from the disk.
Let us first assume that the corona is heated from below. In equilibrium, there must be heating flux from the cold disk to the corona. Some agent, most likely a magnetic field with magnetic pressure will have to carry the energy into the corona. The physical distinction between the skin and the hot corona is then such that the magnetic fields heat the corona but not the skin. Further, , where is the speed with which the energy flux is being carried. The maximum value of is roughly the greater of and , where is the sound speed and is the Alfvén velocity.
Let the gas pressure at the top of the skin be related to the magnetic pressure as , where is a dimensionless number. Hence, . The gas pressure at the top of the skin is
| (3) |
where is the Compton temperature in units of 1 keV. It is interesting to compare this pressure with the “critical” pressure . This quantity is defined to be the gas pressure at point (c) on the S-curve (see Fig. 11), i.e., at the location where the temperature discontinuity occurs. Nayakshin (2000) found this quantity to be
| (4) |
where is the total intensity of radiation integrated over all angles at (see also Krolik et al. 1981). Thus,
| (5) |
That is, unless in the skin, the gas pressure exceeds the one at which the hottest branch of the solution (i.e., the completely ionized skin) exists. Note that , in fact, is likely to be less than unity. We defined the skin as a region where no magnetic heating occurs. However, magnetic reconnection often occurs when the magnetic pressure starts to exceed the gas pressure, i.e., when .
This estimate was done for a corona heated from below. A different scenario arizes when the corona is heated internally – via viscous dissipation of the accretion energy of the gas flowing through the corona itself. In the latter case, the radiation flux from the corona can be written as
| (6) |
where , and for the complete transfer of the accretion energy into radiation (as in Shakura-Sunyaev disks), while is less than unity for an advection dominated corona (e.g., Esin et al. 1997). Further, the accretion rate through the corona, where , and are the corona mass column density and radial inflow velocity, respectively. The gas pressure in the corona may be estimated via hydrostatic balance:
| (7) |
where is the height scale of the corona. Using these two equations, we can now conclude that
| (8) |
If the coronal accretion energy is radiated locally, then we can use the standard equation for the radial inflow velocity: , where is the sound speed in the corona. Thus, one obtains
| (9) |
If coronal cooling is dominated by advection, then , and so even though and , where is Keplerian velocity (see, e.g., Narayan & Yi 1994), is still large compared with .
Summarizing, in all of the three cases for the full corona above the disk, we concluded that the gas pressure in the skin is very much larger than the pressure at which the thermal instability operates. Thus, the gas pressure and density below the corona are too high for the Compton-bremsstrahlung stable branch of the solution to exist, and hence no ionized skin forms below the hot corona. The gas temperature below the corona is therefore close to the effective one and the reflection and the lines will be those that are produced in a “neutral” material. This conclusion holds for arbitrarily large accretion rates. Note, however, that a thin transition layer may still form due to conductive heating of the disk (e.g., Maciolek-Niedzwiecki, Krolik & Zdziarski 1997).
6. Discussion
In this paper, we considered three physically distinct geometries: the lamppost geometry; the magnetic flares above the disk and the full corona above the disk. Each of these geometries was shown to produce different reflected spectra. The large differences in the spectra were caused by (i) absense or presence of a large soft disk flux that influences the Compton temperature; and (ii) the additional pressure, or weight, of the corona for the full corona geometry. While it is perhaps possible to find conditions in which these three models may yield similar spectra (one example is a very low accretion rate when the ionized skin is very Thomson thin and thus negligible), the behavior of the spectra with the X-ray luminosity as well as other parameters is clearly different which should allow one to distinguish between these models observationally.
We do not discuss observational status of the lamppost and the magnetic flare models because we will present an extended discussion of this topic in a future publication where we will also present complete disk spectra that include relativistic broadening. However, it appears to us that the full corona model is the most unpromising of all and we will not study this model in our future work. In particular, since no skin forms below the hot corona, it is not possible to explain the hard continuum spectra of GBHCs (e.g., see Gierlinski et al. 1997; Dove et al. 1997, Nayakshin 1998a). Moreover, there are AGN that have more optical/UV power than the X-ray power which argues against the full corona geometry (see Haardt et al 1994) in which the reprocessed power should be rather less than the X-rays. In addition, as we have shown in §5, the reflector below the skin is cold, which means that the small reflection covering fraction seen in many GBHCs (e.g., Gierlinski et al. 1997) is problematic. The lack of the iron line reverberation discovered in the recent observations of two Seyfet 1 Galaxies (Chiang et al. 2000; Reynolds 2000; Lee et al. 2000) presents yet another uneasy challenge to this model.
Now we will concentrate our discussion on the differences between the lamppost and the magnetic flare models.
6.1. Changes in the S-curve due to soft disk flux
In this paper we emphasised the large difference in the resulting temperature profiles, ionization structure and the reflected spectra between the hot and the warm skin limits. For a clearer understanding of our results, it is useful to discuss this difference in the simplest case – optically thin heating/cooling balance. Figure 11 shows the energy equilibrium curves for the spectral index and a constant angle-integrated intensity of radiation erg cm-2 s-1. The overall intensity in these tests is a sum of the X-ray intensity, and the black-body intensity (with ). The only difference between the curves is the fraction of the black-body intensity compared with that of the hard power-law. In particular, the curves are computed for 0, 1, 2, 4, and 8.
The temperature profiles shown in Figures 1 and 6 can now be discussed with the help of figure 11. The maximum temperature reached in the two opposite limits is different due to the fact that the Compton-bremsstrahlung stable branch of the S-curve shifts significantly as the ionizing spectrum evolves from “all X-ray” to “all black-body”. The X-ray Compton temperature for the given spectrum is about 7.1 keV. Stars in figure 11 indicate the value of the Compton temperature calculated from equation 2, which is clearly smaller for larger values of . The fact that the corresponding curves pass right through the stars shows that the gas temperature is indeed very close to the corresponding Compton temperature when .
Another important difference between the temperature profiles for the hot and warm skin limits is the extent of the middle stable shelf in the S-curve. In the case of , the middle stable shelf is always prominent in the temperature profiles, whereas in the opposite limit when , the middle stable branch only appears for skin that is at least moderately Thomson thick. In order to understand that, we recall that the thermal conduction picks solutions with the smallest temperature gradients (see NKK), and thus the transition from the Compton-bremsstrahlung branch to the middle one happens after the gas pressure exceeds the pressure at point . Thus, in order for the middle shelf to be present in the temperature profiles, the point should lie to the right of the turning point at eV in Figure 11.
When there is little blackbody flux, the gas pressure at point is large enough that the transition happens directly from the Compton-heated to the cold branch. As the blackbody intensity increases, decreases, and then the transition happens first to the middle branch and only later to the cold solution. However, with increase in the blackbody intensity, point moves to the right as much as to make the whole range of temperatures from to the Compton one to be thermally stable.
In addition, even if , the incident X-rays are downscattered in the skin and thus for a moderately Thomson thick skin point again moves to the right (the more the thicker the skin is). This is best understood from the fact that the location of the point sensitively depends on the Compton temperature, which is affected by scatterings. Analytical theory of the Compton-bremsstrahlung cooled branch (see Krolik et al 1981; Nayakshin 2000) yields that the gas temperature at point is a third of the Compton temperature, and pressure is given by equation 4.
The square boxes in Figure 11 indicate the location of the critical point found via equation 4. Note that when there is no black-body contribution to the ionizing intensity, the analytical theory of the Compton-bremstrahlung cooled upper branch works perfectly. Physically, this occurs because the gas is completely ionized and atomic heating/cooling is negligible. However, when , the gas becomes cool enough and heating due to photo-absorption cannot be neglected; this is the reason why the analytical solutions under-estimate the value of the gas temperature at point .
6.2. Iron ionic fractions and lines
Figure 12 summarizes the differences in the ionization structure of the skin in the hot and warm limits by presenting the integrated Thomoson depth of the ions Fe13 – Fe27 for both of the limiting cases. This depth is defined as the integral , where is the ion density for ion . The curves shown in the Figure correspond to tests presented in Figures 3 & 8, respectively. The largest difference between the ionization structure of the two sets of calculations is seen for He- and H-like iron and for completely ionized iron. For the warm skin cases, the first two ions by far outweight the presence of Fe27, as well as any of the less ionized stages. For the hot skin, the situation is reverse, and this is why the skin is “invisible” to the observer in this case and can only be uncovered in the hard X-ray energy range where relativistic rollover in the Klein-Nishina cross section produce a corresponding rollover in the reflected spectrum.
There is also a substantial difference in the equivalent width and energy of the iron K lines between the warm and hot skin limits. In the former case, the most abundunt ion in the skin is the He-like iron, and therefore the strongest line is also He-like with energy around 6.7 keV. H-like line and lines from Fe17-23 also contribute to the complex of the emitted lines. Because He-like iron has a large fluorescence yield compared with neutral iron, the warm skin actually yields the strongest iron line emission. In a sense, it amplifies the line.
The opposite limit of the strong X-ray flux, , is characterized by the predominance of completely ionized iron in the skin. The X-rays incident on the skin are Compton scattered but not photo-absorbed with consecutive iron line fluorescence. Only those photons that are able to reach the cold layers, whether scattered or unscattered in the skin, will produce the “neutral”-like K line, which still needs to make it through the skin to the observer (some of the line photons may be scattered in the skin, return to the cold material and be photo-absorbed without re-emission as a 6.4 keV line photon). Note also that scattering in the skin is very effective in removing the photons from the line bin, because single scattering disperses photons by , or about 700 eV at the line energy. Therefore, the hot skin only degrades the cold-like line by reflecting the incident X-rays and by scattering the line photons emitted from the cool layers.
6.3. On generality of our results
6.3.1 Ratio of X-ray and disk fluxes
In terms of the ratio of the illuminating flux to the disk flux , we limited our attention so far to two rather extreme values – one quite small () and the other very large, . Thus, one wonders how our results will change when is inbetween these two values. To address this question, we conducted several additional series of tests. In the first series, we fixed the accretion rate through the disk at , and varied the ratio from to in steps of factor of 2. These tests are shown in Figure 13. The reflected spectra show a strong He-like line, edge and the recombination continuum for all below 8. In fact, even for the largest values of (8 and 16), there still exist a substantial column density of H- and He-like iron, but it occurs rather deep in the skin, i.e., at , so that it is smeared out by Compton scatterings. The skin is very Thomson thick in these two latter tests because is supper-Eddington.
The fact that there is a large column density in the last two not completely ionized stages of iron means that their presence may probably be seen for lower values of when the completely ionized part of the skin is not Thomson thick. To test that, we calculated reflected spectra for same values of , but for the accretion rate through the disk varying as . Results of these tests are shown in Figure 14. Finally, we also simulated reflected spectra for , which we show in Figure 15. Both of these series of calculations indeed show that the Hydrogen and Helium-like iron still survives deep inside the ionized skin even for . This is somewhat unexpected since in the latter case, and hence one could expect the skin to be in the hot limit.
Let us try to explain this result. The gas temperature in the skin is a fraction of the local Compton temperature, which is determined by equation 2. At large optical depth, one can use Eddington approximation for the radiation transfer, and obtain that the black-body radiation field is
| (10) |
where is the integrated X-ray albedo of the skin. When , the albedo becomes large, i.e., , and thus in this situation one really compares with a small quantity rather than with unity. Finally, when the Thomson depth of the skin is greater than unity, Compton down-scattering of the incident X-rays makes in equation 2 to be dependent on the location in the skin – it is lower on the bottom of the skin than on its top. This is an additional mechanism to lower . For these reasons, it turns out to be enough for the disk flux to be a small fraction of to present a large cooling source for the gas at the bottom of the skin, and this is why one needs to go to rather large values of to make the lamppost spectra look similar to that from magnetic flares.
6.3.2 The high energy rollover of the spectrum and spectral index
Another degree of freedom which we have not explored in this paper is the rollover energy, or equivalently, the gas temperature of the X-ray producing region or regions. Our illuminating spectrum is chosen to be reminiscent of what is typically seen in Seyfert 1 Galaxies and GBHCs (e.g., Svensson 1996; Gierlinski et al. 1997), and this is why we set the rollover energy at keV. However, “odd” objects such as low-luminosity AGN do not have to have the same values of , and it appears to us to be potentially important for the reflected spectra. In particular, figures prominently in the determination of the X-ray Compton temperature if the X-ray spectrum is hard (i.e., ). If is significantly lower than 200 keV assumed in this paper, then the Compton temperature of the skin may be low enough even if the spectrum is hard and . We will present concrete calculations showing these effects elsewhere.
Finally, the spectral index also spans a range of values for real sources, and it is well known that the reflected spectra strongly depend on the actual value of (e.g., NKK). Notwithstanding the complications connected with the two additional parameters, an encouraging fact is that both of these parameters can in principle be extracted from observations if a broad band spectrum is available.
7. Summary
In this paper, we have sketched the way in which X-ray reflection spectra may be computed for different accretion disk theories, and then showed example calculations for two models (lamppost and flares) and also discussed spectra from the full corona disk model. The main three parameters that determine the outcome of the X-ray illumination problem are (1) the ratio of the X-ray illuminating flux to the disk thermal flux, , because it defines the Compton temperature of the corona and thus the degree to which it will be ionized; (2) the accretion rate through the disk since it defines the height at which the skin is located ( to few ); (3) Compton temperature that is a function of the spectral index of the ionizing radiation, , and the spectral cutoff energy, . These parameters can be readily deduced from observations once UV and X-ray spectra, luminosities and at least an estimate of the black hole mass for the given source are available. Therefore, for any accretion disk model which clearly specifies a connection between the overall observed X-ray luminosity and the radius-dependent ionizing flux , accurate disk-integrated spectra can be calculated. These spectra are weakly dependent on the unknown value of the viscosity parameter (see §2).
Our main results, valid for relatively hard X-ray spectra () and the rollover energy keV, are as following:
-
•
If the incident X-ray flux is smaller than or comparable with the soft thermal flux generated intrinsically in the disk, then the Compton-heated skin is “warm”, i.e., keV. In that case iron in the skin is not completely ionized and the majority of it is in the form of hydrogen and helium-like ions. In this limit, the iron line is dominated by the He-like line at 6.7 keV and the line equivalent width increases with the ionizing X-ray luminosity.
-
•
In addition, in the warm skin limit, the ionization physics permits the existence of a large shelf of material occupying the middle stable branch of the S-curve (see Figure 11). Medium Z-elements such as oxygen are not completely ionized there and thus they produce strong soft X-ray features which should be visible with modern X-ray telescopes such as Chandra and XMM.
-
•
If the illuminating X-ray flux is much higher than the soft disk flux, then the skin temperature is substantially higher. Iron is then mostly completely ionized in the skin and thus the skin does not emit or absorbs photons due to atomic processes. Therefore, the hot skin only masks the presence of the cold material. The larger the ionizing X-ray luminosity, the less atomic marks one sees in the reflected spectra. In particular, the iron line is emitted almost exclusively by the cold material below the skin and its energy is close to 6.4 keV. Further, EW of the line decreases with increasing and eventually goes to zero.
-
•
Because ionization equilibria depend on the ratio , the middle temperature solutions are not present in the hot skin, and thus there are less soft X-ray emission features from medium Z-elements. For high in the magnetic flare model, the reflected spectra are featurless power-laws up to the Compton rollover at keV.
-
•
Full coronae above accretion disks do not have the highly ionized skin between the corona and the disk, because the gas density and pressure are too high to allow for that. This means that X-ray reflection from full corona models, if not broadened to invisibility by scattering in the corona, is always “cold” and does not change with increase in the accretion rate through the disk or the corona. We believe this model is rulled out observationally (see §6).
We hope that the significant differences in the spectra of these three models make it possible to distinguish among them observationally based on current and future data.
The authors acknowledge many stimulating discussions with Manuel Bautista, Demos Kazanas, and Julian Krolik. SN acknowledges National Research Council Associateship which fully supported this research.


References
- (1)
- (2) Basko, M.M., Sunyaev, R.A., & Titarchuk, L.G. 1974, A&A, 31, 249
- (3) Basko, M.M., Sunyaev, R.A., Hatchett, S., & McCray R. 1977, ApJ, 215, 276
- Begelman, McKee and Shields (1983) Begelman, M.C., McKee, C.F., & Shields, G.A. 1983, ApJ, 271, 70
- (5) Blackman, E.G. 1999, MNRAS, 306, L25
- (6) Buff, J. & McCray, R. 1974, ApJ, 189, 147
- (7) Chiang, J, Reynolds, C. S., Blaes, O. M., Nowak, M. A., Murray, N., Madejski, G., Marshall, H. L., & Magdziarz, P. 2000, ApJ, 528, 292
- (8) Czerny, B., & ycki , P.T. 1994, ApJ, 431, L5
- (9) Done, C., Mulchaey, J.C., Mushotzky, R.F., & Arnaud, K.A. 1992, ApJ, 395, 275
- (10) Done, C., & Nayakshin, S. 2000, submitted to ApJ
- (11) Dove J., Wilms J., Maisack M., Begelman M.C., 1997, ApJ., 487, 759
- (12) Esin A. A., McClintock J.E., Narayan R., 1997, ApJ., 489, 865
- (13) Fabian, A.C., Rees, M.J., Stella, L., & White, N.E. 1989, MNRAS, 238, 729
- (14) Galeev, A. A., Rosner, R., & Vaiana, G. S., 1979, ApJ, 229, 318
- (15) George, I.M., & Fabian, A.C. 1991, MNRAS, 249, 352
- (16) Gierliński M., Zdziarski A. A., Done C., Johnson W. N., Ebisawa K., Ueda Y., Phlips F. 1997, MNRAS, 288, 958
- Haardt, Maraschi and Ghiselli (1994) Haardt F., Maraschi, L., & Ghisellini, G. 1994, ApJ, 432, L95
- (18) Ko, Y-K, & Kallman, T.R. 1994, ApJ, 431, 273
- (19) Krolik, J.H., McKee, C.F., & Tarter, C.B. 1981, ApJ, 249, 422
- (20) Krolik, J.H., Madau, P., & ycki , P.T. 1994, ApJ, 420, L57
- (21) Lee, J.C., et al. 2000, MNRAS, in press
- (22) Lightman, A.P., & White, T.R. 1988, ApJ, 335, 57
- (23) London, R., McCray, R., & Auer, L.H. 1981, ApJ, 243, 970
- (24) Maciolek-Niedzwiecki, A., Krolik, J. H., & Zdziarski, A. A. 1997, ApJ, 483, 111
- (25) Magdziarz, P., & Zdziarski, A.A. 1995, MNRAS, 273, 837
- (26) Matt, G., Fabian, A.C., Ross, R.R. 1993, MNRAS, 262, 179
- (27) Matt, G., Fabian, A.C., Ross, R.R. 1996, MNRAS, 278, 1111
- (28) Matt, G., Brandt, W. N., Fabian, A. C. 1996, MNRAS, 280, 823
- (29) McCray, R., & Hatchett, S. 1975, ApJ, 199, 196
- (30) Miller K.A., Stone J.M., 2000, ApJ, in press
- (31) Nayakshin, S. 1998a, in “Quasars and Cosmology”, ASP Conference Series, ed. G. Ferland & J. Baldwin, p. 87
- (32) Nayakshin S. 1998b, PhD thesis, University of Arizona
- (33) Nayakshin, S. 2000, to appear in ApJ volume 534
- (34) Nayakshin, S., Kazanas, D., & Kallman, T. 2000, to appear in ApJ volume 537.
- (35) Nayakshin, S., Rappaport, S., & Melia, F. 2000, to appear in ApJ volume 535.
- (36) Narayan, R., & Yi, I. 1994, ApJ, 428, L13
- (37) Poutanen, J., Nagendra, K.N., & Svensson, R. 1996 MNRAS, 283, 892
- (38) Proga, D. Stone, J.M., & Drew, J.E. 1999, MNRAS, 310, 476
- (39) Raymond, J.C. 1993, ApJ, 412, 267
- Reynolds and Begelman (1997) Reynolds, C.S., & Begelman, M.C. 1997, ApJ, 488, 109
- Reynolds et al. (1999) Reynolds, C.S., Young, A.J., Begelman, M.C., & Fabian, A.C. 1999, ApJ, 514, 164
- (42) Reynolds, C.S. 2000, ApJ, in press (astro-ph/9912001)
- (43) Ross, R.R., & Fabian, A.C. 1993, MNRAS, 261, 74
- (44) Ross, R.R., Fabian, A.C., & Brandt, W.N. 1996, MNRAS, 278, 1082
- (45) Ross, R.R., Fabian, A.C., & Young, A.J. 1999, MNRAS, 306, 461
- (46) Róańska , A., & Czerny, P.T. 1996, Acta Astron., 46, 233
- Shakura & Sunyaev (1973) Shakura, N.I., & Sunyaev, R.A. 1973, A&A, 24, 337
- (48) Smak, J. 1984, Acta Astr., 34, 161
- (49) Smak, J. 1999, Acta Astr., 49, 391
- (50) Stella, L., & Rosner, R. 1984, ApJ, 277, 312
- (51) Svensson, R. 1996, åSupl., 120, 475
- (52) White, T.R., Lightman, A.P., & Zdziarski, A.A. 1988, ApJ, 331, 939
- (53) Young, A.J., Reynolds, C.S. 2000, ApJ, 529, 101
- (54) ycki , P.T., Krolik, J.H., Zdziarski, A.A., & Kallman, T.R. 1994, ApJ, 437, 597