Pulsars in the Westerbork Northern Sky Survey
Abstract
I have searched the Westerbork Northern Sky Survey (WENSS) source list for detections of known radio pulsars. A source with a flux density greater than five times the local noise level is found near the positions of 25 pulsars. The probability that one out of these 25 sources is a chance coincidence is about 10%. I have looked at the WENSS maps of the non-detected pulsars. A flux density between three and five times the local noise level is found near the positions of 14 of these non-detected pulsars. There is a 50 percent probability that (at least) one of these marginal detections is just a noise fluctuation. Fourteen radio pulsars, which according to earlier flux measurements have flux densities above three times the WENSS noise level, are not detected. Of the 39 pulsars detected in the WENSS 19 are also detected in the NRAO VLA Sky Survey (NVSS). By combining the WENSS and NVSS flux densities for these 19 pulsars spectral indices are obtained that differ by up to 50% from the long term averaged values reported in the literature. This affects the reliability of pulsar candidates that are selected on the basis of their WENSS-NVSS spectral index.
Key Words.:
Pulsars: general – Surveys – Radio continuum: stars – Scattering1 Introduction
Pulsars can have a steep radio spectrum at frequencies around 1 GHz and can be highly polarised (e.g. Manchester & Taylor 1977) . Synthesis maps can therefore be used to select pulsar candidates on the basis of their steep spectrum and/or high degree of polarisation. These sources are later observed with a high time resolution instrument to search for pulsations. At least two pulsars, PSR B1937+21 Backer et al. (1982) and PSR J0218+4232 Navarro et al. (1995), have been found in this way, while they were missed in regular pulsar surveys because their pulses were smeared out in the detection process due to their small period and their high dispersion measure.
The pulsar population found in this way, may supplement the presently known population, since this method has totally different selection effects. These effects can be investigated by studying the spectral indices and polarisation degrees of known pulsars in these continuum observations. The spectral indices are strongly influenced by scintillation. This may cause the flux density of a pulsar to vary by more than 100 percent on time scales of minutes (diffractive scintillation) to days (refractive scintillation).
In this paper I search for detections of pulsars in the Westerbork Northern Sky Survey (WENSS), a survey performed at 325 MHz. I compare my results with those from Kaplan et al. Kaplan et al. (1998) and Han & Tian Han & Tian (1999), who did similar analyses with data from the 1400 MHz NRAO VLA Sky Survey (NVSS). Sect. 2 describes the WENSS and Sect. 3 describes how the pulsar catalog was correlated with the WENSS source catalog. In Sect. 4 the positions of the non-detected pulsars are searched for flux densities above three times the local noise level. Sect. 5 discusses the remaining non-correlations. Sect. 6 combines the WENSS results with the NVSS correlation studies to determine the spectral indices and compares these with values reported in other literature. Finally, in Sect. 7 the role of scintillation is discussed.
2 WENSS
The Westerbork Synthesis Radio Telescope (WSRT) is an east-west array, consisting of fourteen 25 meter dishes Baars & Hooghoudt (1974). A twelve hour observation is needed to get spatial resolution in all directions. Ten of the dishes have fixed positions and are spaced 144 meters apart. The remaining four are moveable, although their mutual distances are usually kept constant. By observing an object several times with different distances between the fixed and moveable subarray, different baselines are obtained and the -coverage improves, yielding an improved synthesised antenna pattern.
The Westerbork Northern Sky Survey (WENSS) is a 325 MHz continuum survey of the sky above declination +30°(Rengelink et al. 1997, de Bruyn et al. in preparation). This area was surveyed using a mosaicing technique. Each field was observed 18 times for 20 seconds spread over 12 hours. Each mosaic was observed on six days with a different spacing between the fixed and moveable subarray to get a uniform spatial distribution. These observations were spread over periods of weeks to years. The resulting flux densities are averaged over all these observations.
The WENSS beam size is 54″ 54″ (FWHM). The final maps have pixel sizes of 21.09″. When a pixel was found with a flux density above five times the local noise level, a two-dimensional Gaussian was fitted to its surroundings. The coordinates of the centroid of the fit, the maximum (peak) flux density and the flux density integrated over the fit were added to the source list. Extra flags in the catalog mark multiple and extended sources. For a point source the peak flux density equals the flux density integrated over the beam. Only the peak flux densities are used in this analysis, since pulsars are intrinsically point sources. Bright sources have positional errors of 1.5″, weaker sources at lower declinations have errors up to about 10″. On average the uncertainty is 5″.

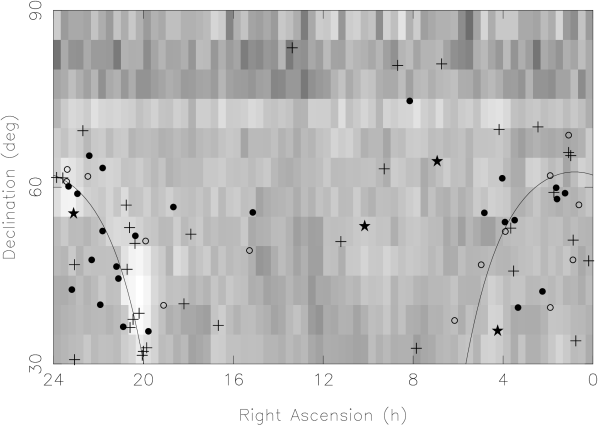
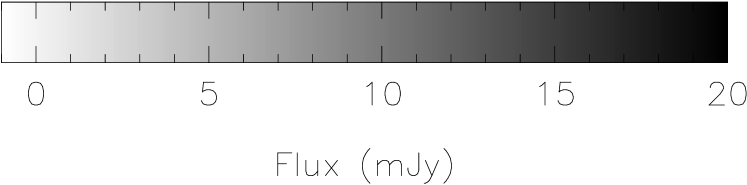
The total bandwidth was 5 MHz. For most regions of the sky the detection limit was between 15 and 25 mJy (five times the local noise level). The polar cap (declination +75°) was surveyed with a larger bandwidth and the detection limit for this area was about 10 – 12 mJy. The WENSS source catalog contains 229420 sources de Bruyn et al. (1998). A total of 18186 of these are located in the polar cap area. Fig. 1 shows the density of sources in the WENSS area.
3 Detected pulsars
3.1 Positional correlation
The radio pulsar catalog (Taylor et al., 1993, Taylor et al., 1995) contains 84 entries in the part of the sky that was covered by the WENSS area. The typical positional uncertainty for a pulsar with a flux density greater than 10 mJy is 0.1″ or less. In most cases the uncertainty in the pulsar position is negligible compared to the positional uncertainty of WENSS sources.
The pulsar proper motions are neglected, since for each pulsar the change in position between the epoch of discovery and the epoch of the WENSS is less than 0.5″ in right ascension and less than 0.8″ in declination for all these pulsars. This is much smaller than the uncertainties in the WENSS positions.
Seven pulsars in the WENSS area have large positional errors of about 4′. The probability that a WENSS source is located by chance within a circle of three times this positional error is more than 90 percent, if it assumed that the WENSS sources are uniformly distributed over the sky. Therefore, I have excluded these 7 pulsars (PSRs J0417+35, B1639+36B, J1758+30, J1900+30, J1931+30, J2002+30 and J2304+60) from further analysis. PSR B2000+40 was also excluded, since it is located in the Cygnus A region, where no WENSS map could be made.
I have taken the J2000 positions of the remaining 76 pulsars and compared them with the positions of the sources in the WENSS catalog. Twenty-five pulsars have a WENSS source located within three times their combined positional uncertainty , with
| (1) |
where and are the positional differences in right ascension and declination, respectively, and
| (2) |
and similarly for . Table 1 lists the J2000 positions of the correlated pulsars and WENSS sources and their offset, both in arcseconds and in .
In Fig. 1 it can be seen that the pulsars are located in areas with different values for the WENSS source density. The probability of a change coincidence can be approximated by a probability calculation that assumes a uniform distribution of the WENSS sources. In that case, the probability that an individual correlation is just by chance is 0.0012. The binomial probability, that one out of 76 trials gives a chance correlation is 0.083. The probability that two correlations occur by chance is 0.004.
| PSR | PSR Position (J2000) | WENSS Position (J2000) | Offset | |||||||||||||||||||||||
| Name | R.A. | Dec. | R.A. | Dec. | abs | rel | ||||||||||||||||||||
| h | m | s | ∘ | ′ | ′′ | h | m | s | ∘ | ′ | ′′ | ′′ | ||||||||||||||
| B0114+58 | 01 | 17 | 38 . | 702 | 0. | 007 | 59 | 14 | 37 . | 85 | 0. | 07 | 01 | 17 | 38 . | 3 | 0. | 9 | 59 | 14 | 39 | 8 | 3. | 18 | 0. | 47 |
| B0136+57 | 01 | 39 | 19 . | 770 | 0. | 003 | 58 | 14 | 31 . | 85 | 0. | 03 | 01 | 39 | 19 . | 7 | 0. | 3 | 58 | 14 | 32 | 3 | 0. | 81 | 0. | 30 |
| B0138+59 | 01 | 41 | 39 . | 947 | 0. | 007 | 60 | 09 | 32 . | 28 | 0. | 05 | 01 | 41 | 39 . | 6 | 0. | 4 | 60 | 09 | 36 | 4 | 4. | 83 | 1. | 38 |
| J0218+4232 | 02 | 18 | 06 . | 350 | 0. | 010 | 42 | 32 | 17 . | 50 | 0. | 10 | 02 | 18 | 06 . | 5 | 0. | 2 | 42 | 32 | 16 | 3 | 1. | 87 | 0. | 78 |
| B0320+39 | 03 | 23 | 26 . | 605 | 0. | 006 | 39 | 44 | 53 . | 06 | 0. | 07 | 03 | 23 | 26 . | 4 | 0. | 4 | 39 | 44 | 58 | 8 | 5. | 20 | 0. | 78 |
| B0329+54 | 03 | 32 | 59 . | 347 | 0. | 010 | 54 | 34 | 43 . | 25 | 0. | 10 | 03 | 32 | 59 . | 4 | 0. | 2 | 54 | 34 | 45 | 2 | 1. | 38 | 0. | 91 |
| B0355+54 | 03 | 58 | 53 . | 705 | 0. | 004 | 54 | 13 | 13 . | 58 | 0. | 03 | 03 | 58 | 54 . | 1 | 0. | 3 | 54 | 13 | 15 | 3 | 4. | 04 | 1. | 73 |
| B0402+61 | 04 | 06 | 30 . | 052 | 0. | 014 | 61 | 38 | 40 . | 76 | 0. | 16 | 04 | 06 | 30 . | 8 | 1. | 1 | 61 | 38 | 39 | 9 | 5. | 75 | 0. | 70 |
| B0450+55 | 04 | 54 | 07 . | 621 | 0. | 003 | 55 | 43 | 41 . | 22 | 0. | 10 | 04 | 54 | 08 . | 3 | 0. | 3 | 55 | 43 | 44 | 3 | 6. | 44 | 2. | 32 |
| B0809+74 | 08 | 14 | 59 . | 443 | 0. | 040 | 74 | 29 | 05 . | 79 | 0. | 14 | 08 | 14 | 59 . | 2 | 0. | 6 | 74 | 29 | 05 | 2 | 1. | 62 | 0. | 72 |
| B1508+55 | 15 | 09 | 25 . | 724 | 0. | 009 | 55 | 31 | 33 . | 01 | 0. | 08 | 15 | 09 | 25 . | 7 | 0. | 2 | 55 | 31 | 33 | 2 | 0. | 53 | 0. | 28 |
| B1839+56 | 18 | 40 | 44 . | 594 | 0. | 050 | 56 | 40 | 55 . | 58 | 0. | 40 | 18 | 40 | 45 . | 5 | 0. | 9 | 56 | 40 | 49 | 8 | 9. | 89 | 1. | 32 |
| B1946+35 | 19 | 48 | 25 . | 037 | 0. | 002 | 35 | 40 | 11 . | 28 | 0. | 02 | 19 | 48 | 25 . | 1 | 0. | 2 | 35 | 40 | 09 | 2 | 2. | 35 | 1. | 01 |
| B2021+51 | 20 | 22 | 49 . | 900 | 0. | 002 | 51 | 54 | 50 . | 06 | 0. | 02 | 20 | 22 | 49 . | 4 | 0. | 4 | 51 | 54 | 48 | 5 | 4. | 61 | 1. | 15 |
| B2053+36 | 20 | 55 | 31 . | 343 | 0. | 040 | 36 | 30 | 21 . | 13 | 0. | 50 | 20 | 55 | 31 . | 3 | 0. | 3 | 36 | 30 | 12 | 6 | 9. | 28 | 1. | 46 |
| B2106+44 | 21 | 08 | 20 . | 478 | 0. | 010 | 44 | 41 | 48 . | 79 | 0. | 10 | 21 | 08 | 21 . | 0 | 0. | 6 | 44 | 41 | 41 | 8 | 9. | 31 | 1. | 29 |
| B2111+46 | 21 | 13 | 24 . | 295 | 0. | 014 | 46 | 44 | 08 . | 68 | 0. | 11 | 21 | 13 | 24 . | 3 | 0. | 2 | 46 | 44 | 08 | 2 | 0. | 55 | 0. | 28 |
| B2148+63 | 21 | 49 | 58 . | 594 | 0. | 030 | 63 | 29 | 43 . | 53 | 0. | 20 | 21 | 49 | 59 . | 9 | 0. | 7 | 63 | 29 | 51 | 5 | 11. | 66 | 2. | 31 |
| B2148+52 | 21 | 50 | 37 . | 742 | 0. | 007 | 52 | 47 | 49 . | 67 | 0. | 05 | 21 | 50 | 38 . | 2 | 0. | 7 | 52 | 47 | 54 | 8 | 6. | 21 | 0. | 89 |
| B2154+40 | 21 | 57 | 01 . | 821 | 0. | 013 | 40 | 17 | 45 . | 88 | 0. | 14 | 21 | 57 | 01 . | 7 | 0. | 2 | 40 | 17 | 46 | 2 | 0. | 95 | 0. | 48 |
| B2217+47 | 22 | 19 | 48 . | 136 | 0. | 004 | 47 | 54 | 53 . | 83 | 0. | 04 | 22 | 19 | 48 . | 3 | 0. | 2 | 47 | 54 | 54 | 2 | 1. | 25 | 0. | 76 |
| B2224+65 | 22 | 25 | 52 . | 360 | 0. | 020 | 65 | 35 | 33 . | 78 | 0. | 12 | 22 | 25 | 51 . | 3 | 1. | 1 | 65 | 35 | 24 | 7 | 12. | 13 | 1. | 68 |
| B2255+58 | 22 | 57 | 57 . | 711 | 0. | 004 | 59 | 09 | 14 . | 95 | 0. | 03 | 22 | 57 | 58 . | 0 | 1. | 0 | 59 | 09 | 12 | 9 | 4. | 12 | 0. | 50 |
| B2310+42 | 23 | 13 | 08 . | 571 | 0. | 006 | 42 | 53 | 12 . | 98 | 0. | 03 | 23 | 13 | 08 . | 6 | 0. | 2 | 42 | 53 | 13 | 3 | 0. | 43 | 0. | 21 |
| B2319+60 | 23 | 21 | 55 . | 187 | 0. | 040 | 60 | 24 | 30 . | 66 | 0. | 30 | 23 | 21 | 54 . | 4 | 0. | 8 | 60 | 24 | 36 | 7 | 7. | 94 | 1. | 19 |

Fig. 2 displays the distribution of positional differences between a pulsar and its nearest WENSS source in units of their combined positional uncertainty . There is a clear gap between the correlated pairs (difference less than 3) and the non-correlated ones. The distribution of the positional difference () for the related pairs is
| (3) |
which follows after a conversion to polar coordinates. This distribution is also plotted in Fig. 2. A Kolmogorov-Smirnov test assigns a 15 procent probability that our sample is drawn from the distribution (3).
There are two objects with positional differences between 3 and 10 . These are in confused regions and will be discussed in Sect. 4.
3.2 Flux densities
| PSR | PSR | ||||||
|---|---|---|---|---|---|---|---|
| name | estimate | WENSS | |||||
| (mJy) | (mJy) | (mJy) | |||||
| B0114+58 | 13. | 8 | 1. | 6 | 25 | 5 | 3.9 |
| B0136+57 | 36. | 7 | 2. | 5 | 70 | 6 | 3.7 |
| B0138+59 | 74 | 9 | 51 | 5 | 3.5 | ||
| J0218+4232 | 150 | 50 | 113 | 7 | 4.4 | ||
| B0320+39 | 57 | 12 | 33 | 5 | 3.9 | ||
| B0329+54 | 2510 | 380 | 1075 | 43 | 5.0 | ||
| B0355+54 | 60 | 10 | 81 | 5 | 3.4 | ||
| B0402+61 | 22. | 5 | 1. | 5 | 27 | 7 | 5.2 |
| B0450+55 | 70 | 11 | 65 | 5 | 3.5 | ||
| B0809+74 | 122 | 29 | 213 | 14 | 8.4 | ||
| B1508+55 | 184 | 11 | 133 | 7 | 3.0 | ||
| B1839+56 | 31 | 5 | 23 | 5 | 3.8 | ||
| B1946+35 | 307 | 15 | 251 | 13 | 6.8 | ||
| B2021+51 | 102 | 22 | 55 | 7 | 4.8 | ||
| B2053+36 | 45. | 5 | 1. | 7 | 45 | 6 | 4.0 |
| B2106+44 | 41. | 5 | 2. | 6 | 32 | 6 | 4.4 |
| B2111+46 | 366 | 21 | 174 | 9 | 4.0 | ||
| B2148+63 | 50. | 6 | 3. | 2 | 37 | 6 | 4.1 |
| B2148+52 | 19. | 4 | 1. | 1 | 26 | 5 | 3.8 |
| B2154+40 | 142 | 10 | 120 | 7 | 3.6 | ||
| B2217+47 | 210 | 41 | 216 | 10 | 3.5 | ||
| B2224+65 | 34. | 5 | 3. | 7 | 25 | 5 | 4.0 |
| B2255+58 | 52. | 7 | 2. | 8 | 45 | 11 | 8.0 |
| B2310+42 | 122 | 16 | 108 | 6 | 3.6 | ||
| B2319+60 | 71 | 8 | 81 | 16 | 11.9 | ||
Table 2 lists the observed flux densities of the correlated WENSS sources and their uncertainties. The flux densities can be compared with known pulsar flux densities, but these are usually measured at frequencies of 400 MHz and higher. By assuming a power law with constant spectral index, these flux density data can be extrapolated. I have used flux density data from Lorimer et al. Lorimer et al. (1995), hereafter LYLG. These flux densities are averaged over many observations spread over years and their uncertainties include variations due to scintillation. LYLG provide data for 24 of the 25 pulsars in Table 1. Flux densities for PSR J0218+4232 are taken from its discovery paper Navarro et al. (1995).


Pulsar flux densities usually obey a power law with a negative exponent ( with ) in the frequency range from 325 to 1400 MHz. I have fitted the logarithms of the flux densities with a straight line. These lines are plotted in Fig. 3. From this fit a flux density at 325 MHz is estimated. This estimate is plotted against the flux density of the WENSS counterpart in Fig. 4. It is known that some pulsars have a low frequency turnover, usually located around 100 MHz Malofeev et al. (1994). However, some pulsars exhibit a turnover at a higher frequency: PSR B0329+54 around 300 MHz Lyne & Rickett (1968) and PSR B2021+51 around 400 MHz. The spectrum of PSR B2319+60 is flat between 200 and 600 MHz Malofeev et al. (1994). PSRs B1946+35 and B2154+40 also have a turnover, but it is not clear whether this located between 325 and 400 MHz Malofeev et al. (1994). In these cases the assumption of a constant power law is not correct and this results in an overestimated flux density at 325 MHz.
Navarro et al. Navarro et al. (1995) discovered that the flux density of PSR J0218+4232 has a non-pulsed component. They find that the continuum flux density at 325 MHz varies between 100 and 200 mJy. I used this flux density estimate for a comparison with the WENSS flux density. An estimate from the pulsed flux density was not derived.
3.3 Source maps
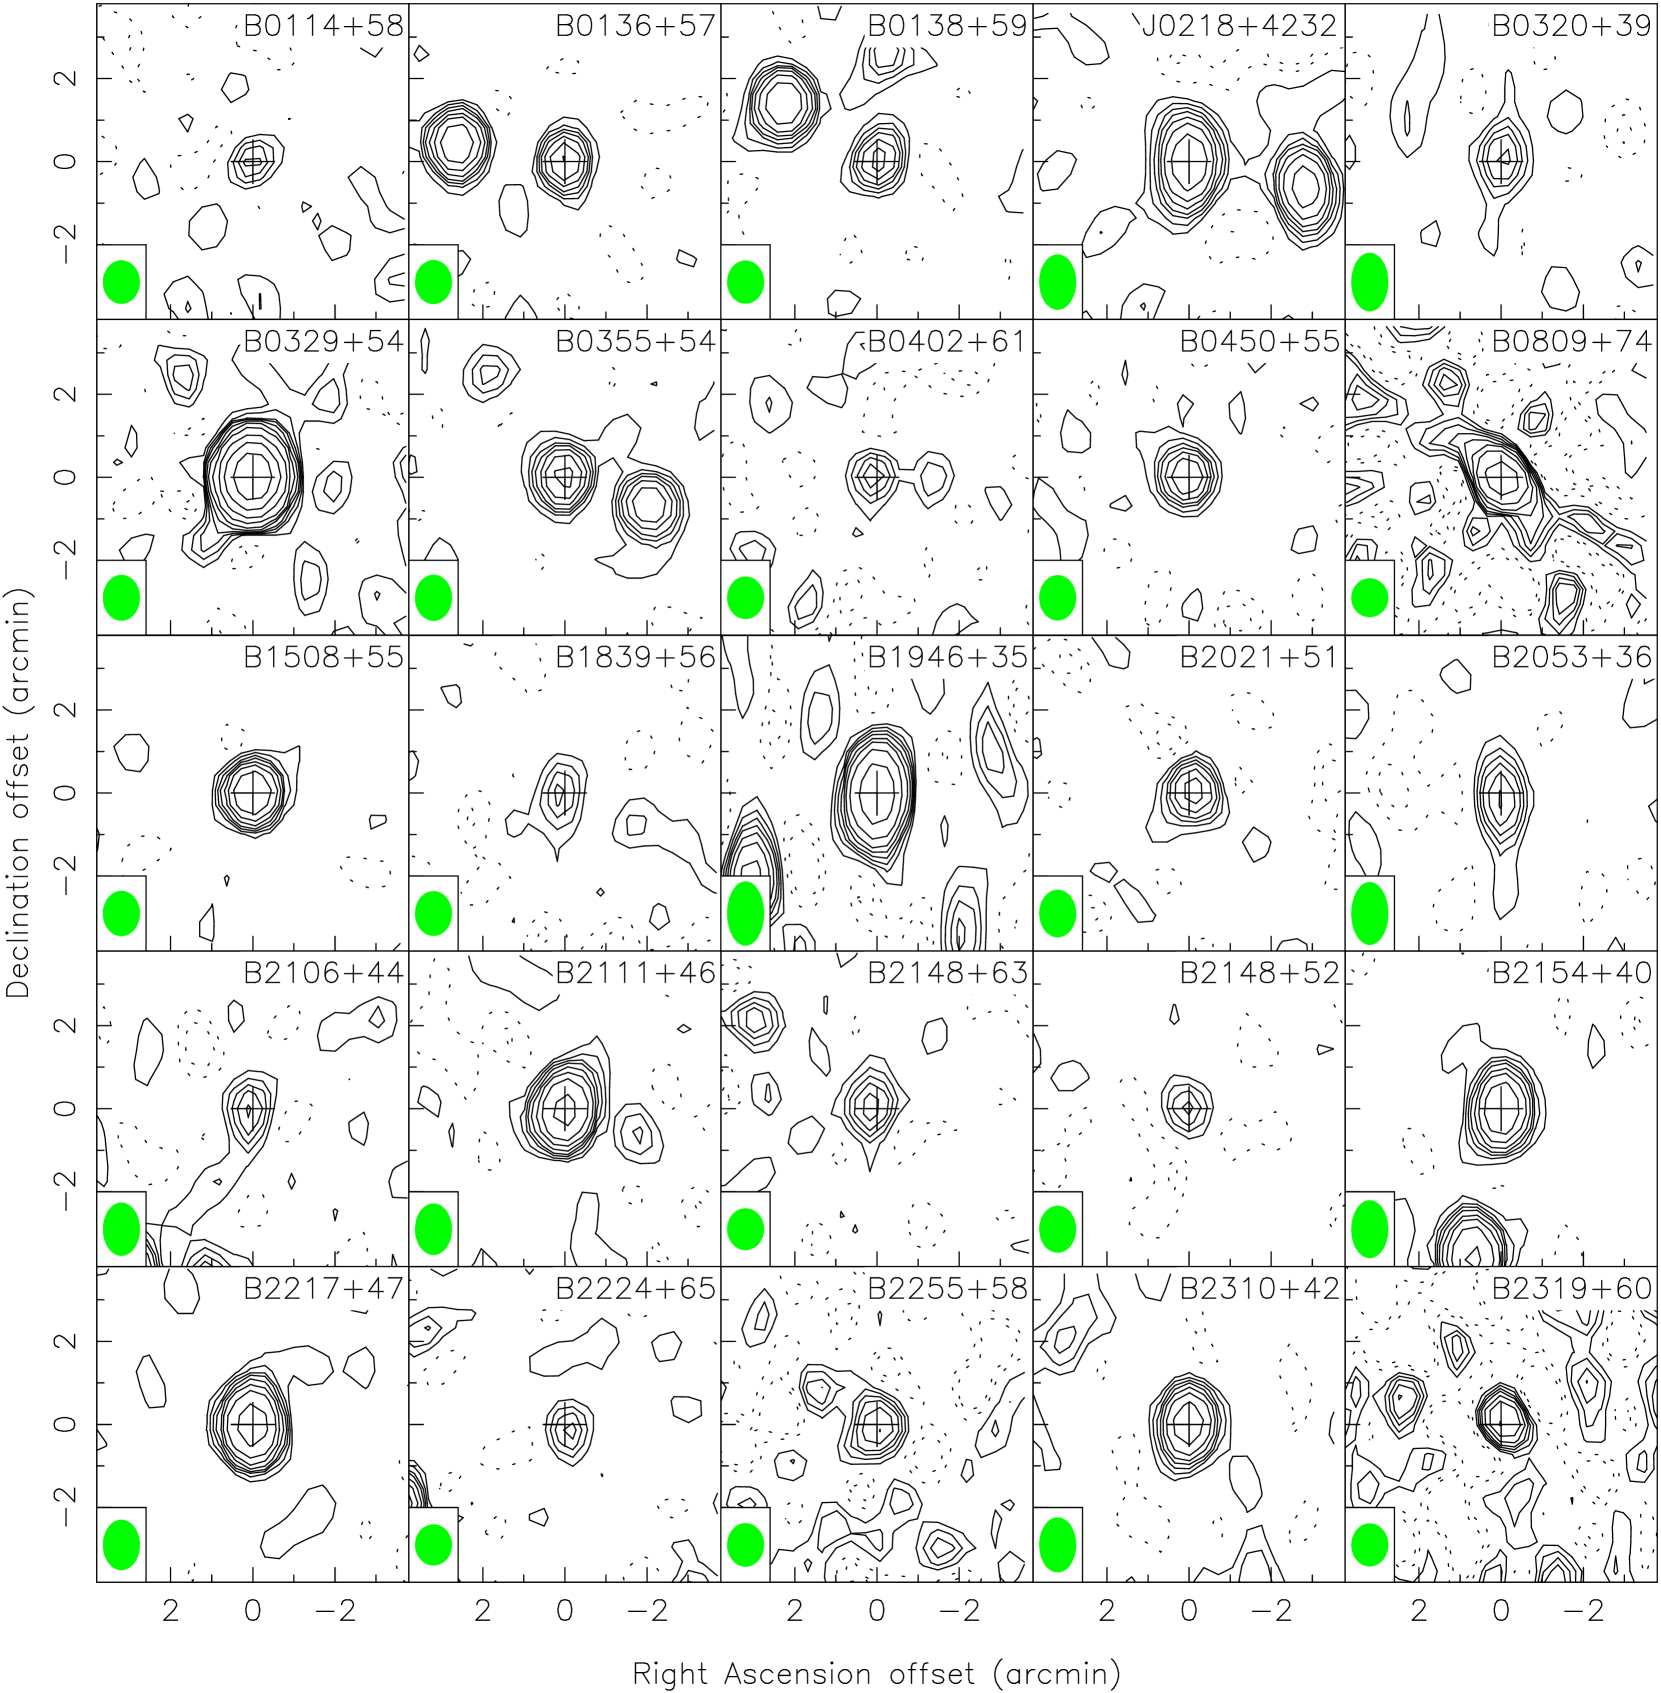
Fig. 5 shows maps of the WENSS sources which are correlated with a pulsar. Most sources are consistent with a point source convolved with the beam shape. The shapes of PSR B0329+54 and PSR B0809+74 are affected by scintillation (see Sect. 7). The integrated and peak flux densities of PSR J0218+4232 differ by 20 percent. This suggests that the source is extended. However, a two-dimensional fit shows that its shape is not significantly different from the beam shape.
4 Marginally detected pulsars
The WENSS source finding routines have a flux density threshold at five times the local noise level (). Since in this paper single trials are done to find a correlation at a very small number of positions, a source can be marked as a marginal detection. However, source fitting is less acurate. Therefore, a 5 by 5 pixel box (1.75′) centered around the pulsar position is searched for the pixel with the maximum flux density. This pixel was marked as a marginal detection, if its flux density was greater than . The positional uncertainty for these marginal sources is estimated using the same equation as for the fitted sources Rengelink et al. (1997). The positional error for these marginal sources is approximately 42″. Since a 1.75′ box is searched, no marginal detection is missed.
| PSR | PSR | WENSS | R | ||||||
|---|---|---|---|---|---|---|---|---|---|
| name | estimate | ||||||||
| (mJy) | (mJy) | (mJy) | |||||||
| B0037+56 | 10. | 3 | 0. | 7 | 11 | 5 | 3.6 | 3.2 | D |
| B0053+47 | 4. | 2 | 0. | 6 | 13 | 5 | 3.5 | 3.7 | D ? |
| B0105+68 | 5. | 6 | 0. | 8 | 16 | 5 | 3.5 | 4.6 | D |
| B0153+39 | 6. | 7 | 1. | 8 | 12 | 5 | 3.5 | 3.4 | D ? |
| B0154+61 | 8. | 4 | 1. | 1 | 14 | 5 | 4.0 | 3.4 | D |
| B0353+52 | 19 | 3 | 14 | 5 | 3.9 | 3.5 | |||
| B0458+46 | 18. | 4 | 1. | 0 | 18 | 6 | 4.6 | 4.0 | |
| B0609+37 | 21 | 3 | 13 | 5 | 3.8 | 3.3 | |||
| J1518+4904 | 8 | 4 | 13 | 4 | 3.0 | 4.2 | D ? | ||
| B1905+39 | 40 | 5 | 16 | 5 | 3.8 | 4.2 | |||
| B1953+50 | 37 | 6 | 29 | 9 | 6.5 | 4.4 | |||
| B2227+61 | 28. | 6 | 1. | 7 | 18 | 6 | 4.7 | 3.8 | |
| B2323+63 | 11 | 3 | 21 | 8 | 6.0 | 3.5 | D | ||
| B2324+60 | 21. | 7 | 1. | 8 | 27 | 12 | 8.9 | 3.0 | D |
The probability of finding a (or higher) pixel in a map with Gaussian noise is . About 5 WENSS FWHM beams fit into a 5 5 pixel box. Fifty-one boxes were searched. Effectively, 255 trials have been performed. The binomial probability that one pixel is found is 0.35, the probability that two are found is 0.12 and that three are found is 0.03. Therefore, there is a 50 percent probability that (at least) one of our 14 marginal detection is just a noise fluctuation.
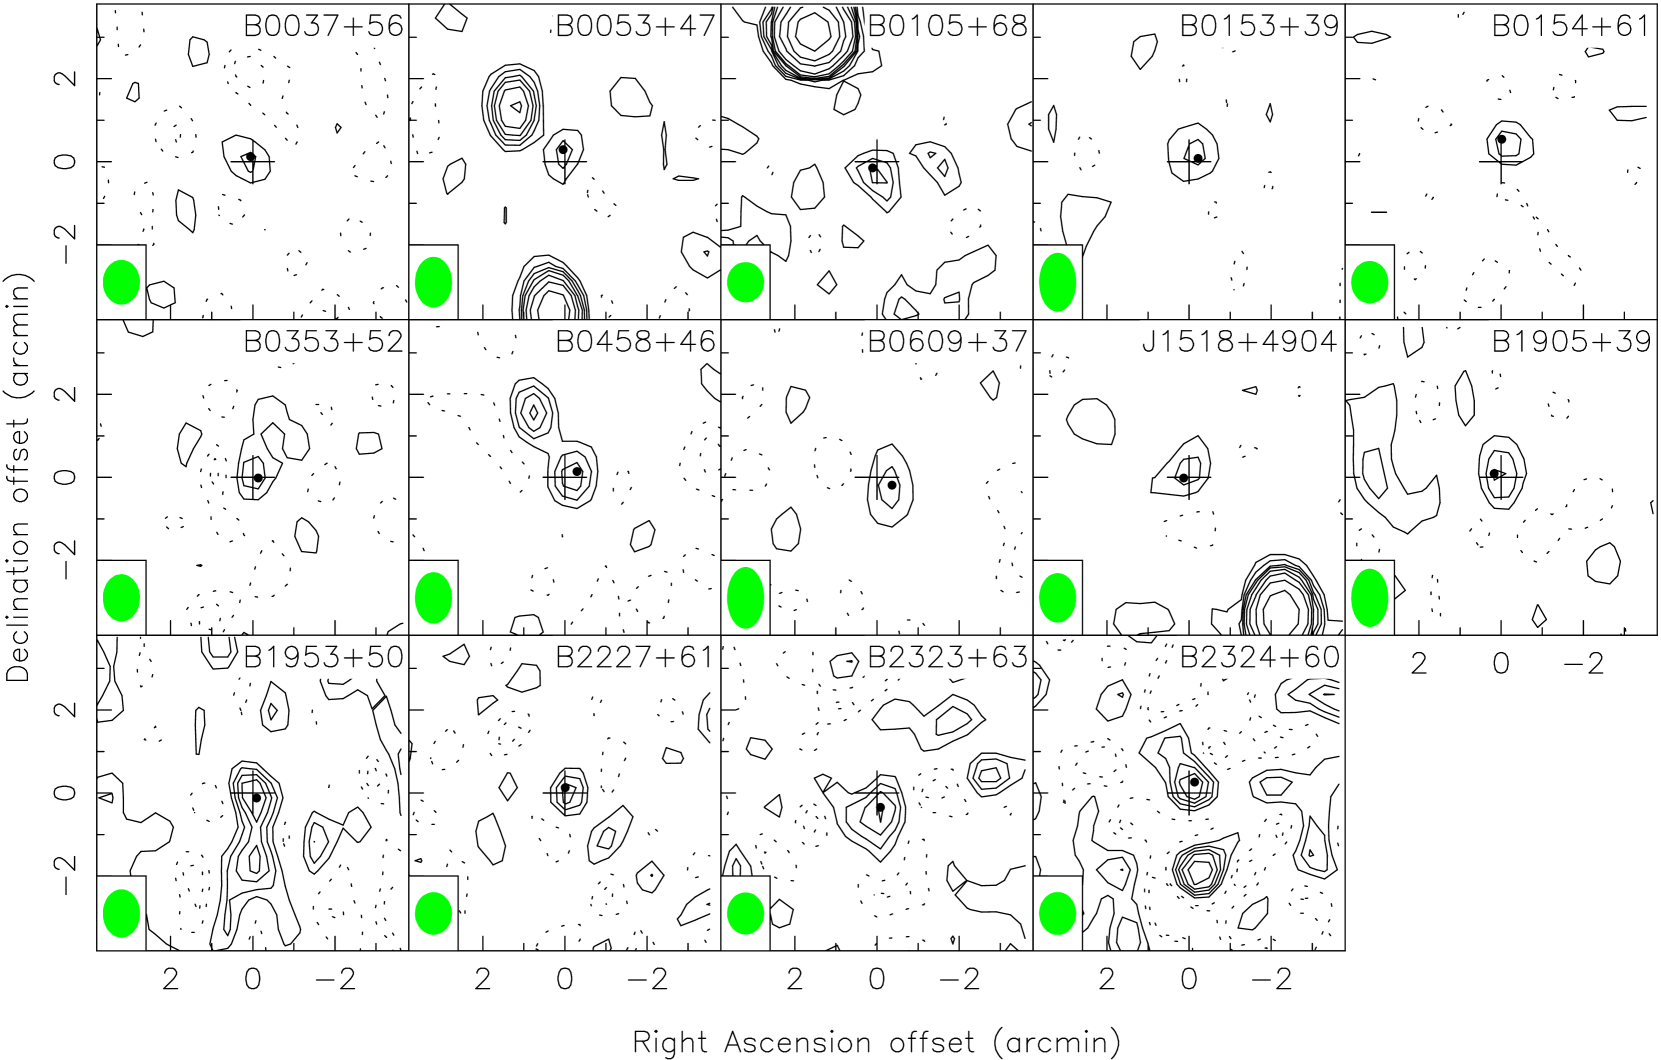
The maps of the marginal detections are shown in Fig. 6. The location of the pixel with maximum flux density is also indicated. The shapes of these sources is not as point-like as the strong detections with . The flux densities of the marginal detections are listed in Table 3, together with an estimate of the pulsar flux density based on a similar extrapolation of the pulsar spectrum as done in Sect. 3.2. The estimate for PSR J1518+4904 is based on its measured flux density at 370 MHz Sayer et al. (1997), since its spectrum as plotted by Kramer et al. Kramer et al. (1999) shows evidence for a low frequency turnover.
The ratios of the extrapolated pulsar flux density and the WENSS source flux density are displayed in Fig. 4. The spread is of the order of a factor 1.5, which is comparable with the spread for the detected sources that were discussed in the previous section. Five sources were detected, although their expected flux density was below three times the local noise level (see Table 3). The flux density at 325 MHz could not be estimated for three other pulsars, since no reliable flux density data at other frequencies were available.
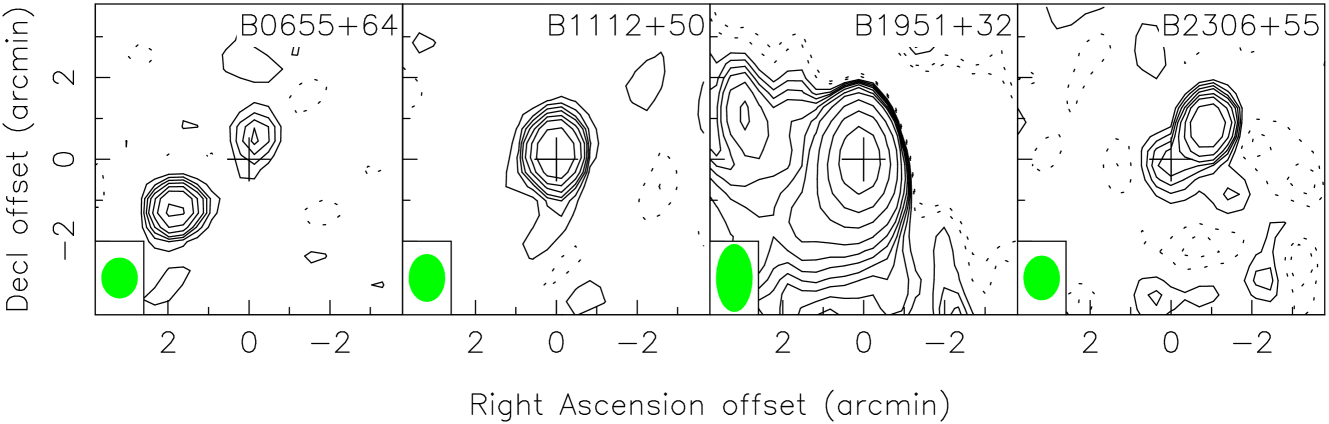
The contours of four pulsars are confused by nearby radio sources. These sources are discussed in the following and are shown in Fig. 7.
PSR B0655+64: the WENSS source and the pulsar position are 4.3 apart. The estimated flux density of the pulsar at 325 MHz is 7 2 mJy, but the WENSS source is 23 5 mJy. Also, the NVSS (see Sect. 7) shows a radio source at the WENSS position and clearly away from the pulsar position. Its flux density at 1400 MHz is about 5.6 mJy, while the pulsar flux density is expected to be 0.3 0.1 mJy. The pulsar has a proper motion, but it is small and directed towards negative declinations.
PSR B1112+50: The WENSS source is bright (135 mJy) and has an accurate position. The separation between the fitted WENSS position and the known pulsar position is 4.6. Extrapolation of the pulsar spectrum results in an estimated flux density at 325 MHz of 16 3 mJy, much less than that of the WENSS source. Kaplan et al. Kaplan et al. (1998) and Han & Tian Han & Tian (1999) searched the NVSS for pulsar counterparts and also noted that the pulsar is confused by a strong NVSS source 12″ away.
PSR B1951+32: The coincident source in the WENSS catalog is marked as extended and the emission is dominated by the supernova remnant CTB80. The pulsar is associated with this remnant (Strom 1987, Kulkarni et al. 1988). The WENSS peak flux density is 983 mJy, which is about a factor 70 stronger than the expected pulsar flux density.
PSR B2306+55: It can be clearly seen in the map that this source has two components, of which the weaker one is probably the counterpart to the pulsar. This component is not listed in the WENSS source list. The estimated pulsar flux density is about 30 3 mJy. The bright component of the WENSS source is 125 9 mJy, separated 28 from the pulsar position. The second component has a flux density of approximately 24 mJy.
In all these four cases I conclude that the source in the WENSS catalog and the pulsar are unrelated. Galama et al. Galama et al. (1997) reached the same conclusion for PSR B0655+64.
5 Non-detected pulsars
| PSR | PSR | |||||
| name | estimate | |||||
| (mJy) | (mJy) | |||||
| B0011+47 | 19 | 5 | 3.3 | ND | ||
| B0045+33 | 3 | .5 | 0 | .5 | 3.5 | ? |
| B0052+51 | 4 | .1 | 0 | .5 | 3.9 | |
| B0059+65 | 11 | .4 | 1 | .3 | 3.2 | ND |
| B0105+65 | 14 | .6 | 1 | .9 | 3.2 | ND |
| B0144+59 | 7 | .0 | 0 | .5 | 3.4 | |
| B0226+70 | 3 | .5 | 0 | .4 | 3.5 | |
| B0331+45 | 14 | 3 | 4.2 | ND | ||
| B0339+53 | 4 | .9 | 1 | .0 | 4.0 | |
| B0410+69 | 10 | .5 | 0 | .7 | 4.2 | |
| B0643+80 | 11 | .2 | 1 | .8 | 1.9 | ND |
| B0751+32 | 12 | .4 | 2 | .5 | 3.5 | ND |
| B0841+80 | 1 | .5 | 2.1 | |||
| B0917+63 | 6 | .9 | 1 | .4 | 3.5 | |
| J1012+5307 | 30 | 30 | 4.2 | ND | ||
| B1322+83 | 15 | 7 | 2.2 | ND | ||
| B1639+36A | 3 | .0 | 4.3 | |||
| B1753+52 | 5 | .1 | 1 | .1 | 3.8 | |
| B1811+40 | 18 | .4 | 1 | .0 | 3.3 | ND |
| B2000+32 | 8 | .3 | 0 | .5 | 7.3 | |
| B2002+31 | 27 | .9 | 1 | .8 | 7.8 | ND |
| B2011+38 | 34 | .3 | 1 | .8 | 8.5 | ND |
| B2022+50 | 7 | .1 | 0 | .8 | 4.8 | |
| B2027+37 | 27 | 3 | 7.4 | ND | ||
| B2035+36 | 8 | .7 | 2 | .2 | 7.0 | |
| B2036+53 | 4 | .6 | 0 | .8 | 5.4 | |
| J2044+46 | 6.4 | ? | ||||
| B2045+56 | 6 | .6 | 1 | .8 | 4.8 | |
| B2241+69 | 3 | .6 | 1 | .4 | 4.2 | |
| B2303+30 | 38 | 4 | 3.7 | ND | ||
| B2303+46 | 1 | .7 | 0 | .7 | 3.8 | |
| B2334+61 | 16 | 4 | 6.9 | |||
| B2351+61 | 23 | 4 | 5.5 | ND | ||
Table 4 lists the pulsars that have no counterpart in the WENSS. In 14 cases the expected pulsar flux density is higher than three times the local noise level. Still, the pulsar was not detected. In two cases no reliable pulsar flux density estimate at 325 MHz is available. In three other cases the estimate is based on 400 MHz observations. In case of PSRs B0841+80 and B1839+36A this was done, because there was no spectral information available. The spectrum of PSR J1012+5307 might also have a low frequency turnover (see its spectrum as plotted by Kramer et al. 1999) . Its flux density is known to vary by up to a factor four from its mean value of 30 mJy Nicastro et al. (1995).
Five (and possibly eight) pulsars are detected, which were expected to be not detectable. The number of non-detected sources that were expected to have a flux density greater than the detection limit, should be roughly the same as the number of unexpected detections. The difference may be due to Poisson fluctuations in the (small) number of pulsars in this study.
6 Sources in the NVSS
| PSR | Spec.ind. | Spec.ind. | ||
|---|---|---|---|---|
| name | Lorimer | WENSS– | ||
| et al. | NVSS | |||
| B0136+57 | 1.3 | 0.1 | 1.96 | 0.10 |
| B0138+59 | 1.8 | 0.2 | 1.54 | 0.09 |
| B0329+54 | 1.6 | 0.2 | 1.35 | 0.04 |
| B0353+52 | 1.5 | 0.1 | 0.99 | 0.25 |
| B0355+54 | 0.9 | 0.2 | 1.41 | 0.06 |
| B0402+61 | 1.4 | 0.1 | 1.36 | 0.19 |
| B0450+55 | 1.3 | 0.2 | 1.45 | 0.07 |
| B0809+74 | 1.7 | 0.2 | 2.27 | 0.07 |
| B1508+55 | 2.3 | 0.1 | 1.95 | 0.05 |
| J1518+4904 | 1.5 | 0.2 | 0.72 | 0.20 |
| B1839+56 | 1.4 | 0.2 | 0.57 | 0.15 |
| B1946+35 | 2.2 | 0.1 | 2.57 | 0.07 |
| B2021+51 | 0.7 | 0.3 | 0.79 | 0.08 |
| B2106+44 | 1.3 | 0.1 | 1.31 | 0.13 |
| B2111+46 | 2.0 | 0.1 | 1.05 | 0.04 |
| B2154+40 | 1.5 | 0.1 | 1.16 | 0.04 |
| B2217+47 | 2.8 | 0.3 | 2.75 | 0.10 |
| B2224+65 | 1.8 | 0.1 | 1.12 | 0.16 |
| B2310+42 | 1.5 | 0.2 | 1.44 | 0.06 |
The NRAO VLA Sky Survey (NVSS, Condon et al. 1998) is a survey of the sky above declination 40° at 1400 MHz. Its final resolution is 45″ and is comparible with the WENSS resolution of 54″ (in right ascension). The bandwidth was effectively 42 MHz. The noise in the final NVSS maps is about 0.45 mJy. These maps are constructed by taking the average of a number of snapshot observations. Each point on the sky is observed in about three snapshots.
Seventeen of the twenty-five pulsars with a WENSS counterpart are also detected in the NVSS (see Kaplan et al. Kaplan et al. (1998), who did not include PSR B0138+59 and Han & Tian Han & Tian (1999)). Two pulsars (PSR B0353+52 and PSR J1518+4904) with a marginal WENSS counterpart coincide with a NVSS source. Kaplan et al. Kaplan et al. (1998) also lists the WENSS sources which coincide with their NVSS sources. Besides the three pulsars already mentioned, PSR B0809+74 is also not in their list, though it matches their coincidence criterion. Eight pulsars with a WENSS counterpart are not detected in the NVSS. This can be caused by scintillation or these pulsars must have a steep spectrum (spectral index between about 1.6 and 2.0). Two pulsars (PSRs J0218+4232 and B2319+60) may have a very steep spectrum (spectral index less than 2.6 and 2.3, respectively).
From the WENSS and NVSS flux density values the spectral index can be calculated. These can be compared with the spectral indices as determined from a large number of dedicated pulsar observations, as by LYLG. The latter indices will suffer less from scintillation effects. The uncertainty due to scintillation is included in the errors given by LYLG.

From Table 5 it is clear that there are some large differences between the spectral index as determined by the WENSS and NVSS flux densities and the long term averaged spectral index. The differences are displayed in Fig. 8. This histogram has a mean of 0.14 and a standard deviation of 0.48. There is a large spread and a WENSS-NVSS source flux density comparison is not a very precise way to determine a spectral index. This will limit the success of a pulsar candidate selection based on their WENSS-NVSS spectral index.
7 Discussion
The deviations between the flux density values of pulsars and the correlated WENSS and NVSS sources are mainly caused by scintillation effects. Small-scale inhomogeneities in the interstellar medium affect the travel path of radio waves and can amplify or weaken them. For reviews, see Rickett Rickett (1990) or Narayan Narayan (1992). Walker Walker (1998) summarizes the involved equations and dependencies.
In the case of strong scintillation, the phase changes due to the scattering in a certain region are larger than the changes in phase due to normal geometry. The scintillation is called weak in the opposite case. The boundary between the two is dependent on the frequency of the radio waves and the distance to the pulsar. At 325 and 1400 MHz almost all pulsars are in the strong scintillation regime.
Two types of strong scintillation exist: diffractive and refractive. They differ in their typical timescale , frequency bandwidth and size of the resulting flux density variation. This strength of the scintillation is usually quantified by the modulation index, i.e. the rms fractional flux density variation.
In the case of strong scintillation waves from multiple locations in the scattering region interfere constructively (or destructively). Both the typical timescale and the frequency bandwidth are small. The modulation index equals one. The timescale is dependent on the relative velocities of the pulsar, the interstellar medium and the Earth. For the WENSS observations of pulsars typical timescales are 1 to 10 minutes and typical bandwidths are 10 Hz to 500 kHz. This means that for almost all pulsars any variations due to diffractive scintillation are averaged out over the 5 MHz WENSS bandwidth and when the 6 18 short observations spread over 6 12 hours are combined.
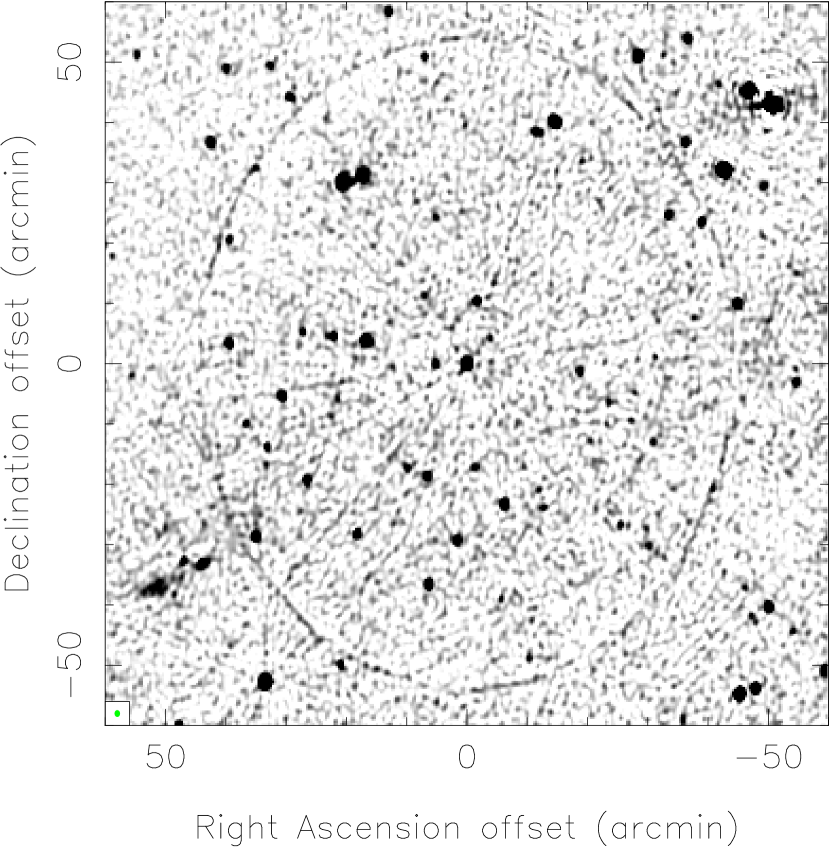
Only for PSR B0809+74 are the diffractive scintillation timescale and bandwidth large enough that some effect remains. From the equations given by Walker Walker (1998) one finds a timescale of 12 minutes and a bandwidth of 500 kHz. The actual value of the typical scintillation timescale and bandwidth are even higher, since several authors have already shown that the Taylor-Cordes distance model Taylor & Cordes (1993) gives too small predictions for this pulsar (e.g. Rickett et al. 2000). Diffractive scintillation can explain the WENSS image of this pulsar (Fig. 5). As 40 minutes is the time between two observations of a field in one mosaic, flux density variations on that time scale cause spokes in the map. Such spokes can also be seen in the complete map of PSR B0329+54 (Fig. 9).
Refractive scintillation is caused by the focussing effect of a large scattering region. The timescales and bandwidths involved are much larger than in the case of diffractive scintillation. The modulation index is also smaller. The scintillation bandwidth is of the order of the observing frequency. Refractive time scales for the pulsars detected in the WENSS vary from a couple of days to several years and the expected modulation index from 0.05 to 0.3.
If the refractive time scale is less than the time between observations of the same mosaic (couple of days to several years), any flux density variation will be averaged out when the mosaics are combined. However, stong flux density variations between 12 hour sessions cause a ring at the first grating ring of the synthesised beam. Since the mutual distances between the dishes are multiples of 72 m, the ring will have radius of 72 m / (325 MHz) radians, i.e. 44′ in right ascension and 44′ in declination. The second and higher grating rings are not visible, since data far from the field center gets a low weighting factor when the final image is created.
It is hard to give good estimates for the expected diffractive and refractive scintillation timescales. They depend on the often poorly known pulsar velocity. For large pulsar velocities (compared to the velocity of the interstellar medium, being about 50 km/s) the dependence is as one over the square root of this velocity. Since some pulsar velocities might be up to several hundred kilometers per second, this cannot be neglected. I divided the pulsars that are detected in the WENSS in two groups, based on their expected refractive modulation index if their velocity is neglected. Both groups had similar relative deviations between their measured and expected flux densities.
The observed modulation index is about 0.4, much larger than the expected value of about 0.2. The WENSS pulsar flux densities vary more due to refractive scintillation than predicted by the equations. This has been observed before by several authors and is attributed to the assumption that the turbulence in the interstellar medium has a Kolmogorov spectrum (e.g. Blandford & Narayan, 1985).
The NVSS flux densities are even more affected by scintillation effects. Each point in the NVSS maps is an average of about three snapshots. Two of these three are taken right after each other (snapshot series are taken at constant declination and increasing right ascension, see figure 7 in Condon et al. 1998) and very little averaging takes place. The expected refractive modulation index at 1400 MHz is larger than at the WENSS frequency. The expected diffractive frequency bandwidth is also larger at the NVSS frequency, even relative to the increased total bandwidth used in the NVSS. One therefore expects the differences between the pulsar flux densities in the NVSS and the flux densities reported by LYLG to be larger than the differences reported in this study. This is indeed observed: the modulation index of the WENSS sources in Table 2, excluding PSRs J0218+4232, B0329+54 and B2021+51 is 0.40, the modulation index of the NVSS sources in table 1 of Han & Tian Han & Tian (1999) is 0.60.
De Breuck et al. De Breuck et al. (2000) show that the total spectral index distribution of WENSS sources that are correlated with a NVSS source ( mJy and ) has a mean of 0.80 and a standard deviation of 0.24. Pulsar have a mean spectral index of 1.6 (see LYLG). An increase of 0.5 due to scintillation will move the pulsar spectral index well into the distribution of normal sources, which are much more frequent. The spectrum of some point-like quasars will also be affected by scintillation and some of them will seem to have a much steeper spectrum than they really have. This effect should be taken into consideration if pulsar candidates are selected on the basis of their spectral index derived from the WENSS and NVSS.
Acknowledgements.
I thank F. Verbunt and A. G. de Bruyn for discussion and comments. I thank B. W. Stappers for comments on the manuscript. I am supported by The Netherlands Research School for Astronomy (NOVA), a national association of astronomy departments at the Universities of Amsterdam, Groningen, Leiden and Utrecht.References
- Baars & Hooghoudt (1974) Baars J. W. M., Hooghoudt B. G., 1974, A&A 31, 323
- Backer et al. (1982) Backer D. C., Kulkarni S. R., Heiles C., Davis M. M., Goss W. M., 1982, Nat 300, 615
- Blandford & Narayan (1985) Blandford R., Narayan R., 1985, MNRAS 213, 591
- Condon et al. (1998) Condon J. J., Cotton W. D., Greisen E. W. et al., 1998, AJ 115, 1693
- De Breuck et al. (2000) De Breuck C., van Breugel W., Röttgering H. J. A., Miley G. K., 2000, A&AS 143, 303
- de Bruyn et al. (1998) de Bruyn A. G., Tang Y., Rengelink R. B. et al., 1998, WENSS source catalog, available via http://www.strw.leidenuniv.nl/wenss/
- Galama et al. (1997) Galama T. J., de Bruyn A. G., van Paradijs J., Hanlon L., Bennett K., 1997, A&A 325, 631
- Han & Tian (1999) Han J. L., Tian W. W., 1999, A&AS 136, 571
- Kaplan et al. (1998) Kaplan D. L., Condon J. J., Arzoumanian Z., Cordes J. M., 1998, ApJS 119, 75
- Kramer et al. (1999) Kramer M., Lange C., Lorimer D. R. et al., 1999, ApJ 526, 957
- Kulkarni et al. (1988) Kulkarni S. R., Clifton T. C., Backer D. C. et al., 1988, Nat 331, 50
- Lorimer et al. (1995) Lorimer D. R., Yates J. A., Lyne A. G., Gould D. M., 1995, MNRAS 273, 411 (LYLG)
- Lyne & Rickett (1968) Lyne A. G., Rickett B. J., 1968, Nat 219, 1339
- Malofeev et al. (1994) Malofeev V. M., Gil J. A., Jessner A. et al., 1994, A&A 285, 201
- Manchester & Taylor (1977) Manchester R. N., Taylor J. H., 1977, Pulsars, Freeman, San Fransico
- Narayan (1992) Narayan R., 1992, Phil. Trans. R. Soc. London A 341, 151
- Navarro et al. (1995) Navarro J., de Bruyn A. G., Frail D. A., Kulkarni S. R., Lyne A. G., 1995, ApJ 455, L55
- Nicastro et al. (1995) Nicastro L., Lyne A. G., Lorimer D. R. et al., 1995, MNRAS 273, L68
- Rengelink et al. (1997) Rengelink R. B., Tang Y., de Bruijn A. G. et al., 1997, A&AS 124, 259
- Rickett (1990) Rickett B. J., 1990, ARA&A 28, 561
- Rickett et al. (2000) Rickett B. J., Coles W. A., Markkanen J., 2000, ApJ 533, 304
- Sayer et al. (1997) Sayer R. W., Nice D. J., Taylor J. H., 1997, ApJ 474, 426
- Strom (1987) Strom R. G., 1987, ApJ 319, L103
- Taylor & Cordes (1993) Taylor J. H., Cordes J. M., 1993, ApJ 411, 674
- Taylor et al. (1993) Taylor J. H., Manchester R. N., Lyne A. G., 1993, ApJS 88, 529
- Taylor et al. (1995) Taylor J. H., Manchester R. N., Lyne A. G., Camilo F., 1995, Catalog of 706 Pulsars, Unpublished work, available via http://pulsar.princeton.edu/pulsar/catalog.shtml
- Walker (1998) Walker M. A., 1998, MNRAS 294, 307