email: tafalla@oan.es, bachiller@oan.es 22institutetext: Harvard-Smithsonian Center for Astrophysics, MS 42, 60 Garden St., Cambridge, MA 02138, USA
email: pmyers@cfa.harvard.edu 33institutetext: Departamento de Astronomía, Universidad de Chile, Casilla 36-D, Santiago, Chile
email: mardones@das.uchile.cl
L483: a protostar in transition from Class 0 to Class I
Abstract
We present line observations of different molecular species toward the dense core in L483 and its bipolar outflow powered by the Class 0 object IRAS 18148-0440. 12CO(2–1) maps show that the outflow is well collimated and asymmetric, and that its gas is warmer than the surrounding cloud by at least a factor of 2. In contrast with the outflows from other Class 0 objects, the CH3OH(–) lines in L483 do not show strong high velocity wings, although there is a small ( km s-1) velocity shift approximately along the outflow direction. We do not find evidence for a CH3OH abundance enhancement in the flow, and the CH3OH lines trace a centrally concentrated core which we model, assuming optically thin emission, as having a density gradient between and for radii between and . H2CO(212–111) lines show strong high-velocity wings with the same distribution as the outflow, and evidence for a H2CO abundance enhancement of a factor of 20 with respect to the ambient cloud. At ambient velocities and over the central , this line presents a strong self absorption and a brighter blue peak, a characteristic signature of inward motions. A simple analysis of the H2CO line profiles suggests an infall rate of M⊙ yr-1.
Combining the results from our observations with previous work, we discuss the evolutionary status of IRAS 18148-0440 and its outflow. The bipolar outflow presents some characteristics common to other outflows from Class 0 sources, like high degree of collimation, gas heating, and H2CO abundance enhancement. However, other characteristics, like its low velocity, the lack of bright SiO or CH3OH outflow wings, and the association with a NIR scattering nebula (optically invisible) seem more common to outflows from the more evolved Class I sources. As IRAS 18148-0440 is a Class 0 object based on its spectral energy distribution, we propose that it is more evolved than other objects in its class, probably in transition from Class 0 to Class I.
Key Words.:
Stars: formation – ISM: clouds – ISM: individual objects: L483 – ISM: jets and outflows – ISM: molecules1 Introduction
Class 0 objects are the youngest stellar objects known (André et al. And93 (1993), And99 (1999)). They commonly power bipolar outflows with extreme characteristics like a very high degree of collimation and evidence for shock processing of molecular gas even in cases of very low stellar luminosity (see Bachiller & Tafalla Bac99 (1999) for a recent review). In order for these outflows to evolve into the more quiescent (“standard”) outflows associated with Class I sources, rapid changes in outflow morphology and kinematics have to occur in the few yr that Class 0 lasts (André et al. And93 (1993)). These changes are most likely associated with changes in the source itself, which is undergoing its major phase of assembling via gravitational infall (e.g., Bontemps et al. Bon96 (1996), Mardones et al. Mar97 (1997)). Understanding how these first evolutionary changes of the stellar and outflow life occur is a major challenge to star formation studies, and it requires the simultaneous analysis of Class 0 objects, their outflows, and their dense gas environments. Here we present a molecular line study of the L483 core and its outflow powered by IRAS 18148-0440 (IRAS 18148 hereafter), a system that we find at the end of its Class 0 stage, starting its transition to become a Class I object.
The source IRAS 18148 in L483, first identified as an embedded object by Parker (1988a ), is one of the reddest low-mass sources known (Ladd et al. 1991a , 1991b ), and is located toward the Aquila Rift, at a most likely distance of 200 pc (Dame & Thaddeus Dam85 (1985)). Ladd et al. (1991a ) and Fuller et al. (Ful95 (1995)) estimate a source bolometric temperature (in the sense of Myers & Ladd Mye93 (1993)) of 50-60 K, and using the flux compilation by Fuller et al. (Ful95 (1995)) (their Fig. 4), we estimate a / % (also, Fuller et al. Ful95 (1995) fit the spectral energy distribution with a single-temperature dust model at 40 K, and from their 1.1mm flux, we estimate /). These numbers suggest that IRAS 18148 is a Class 0 object (André et al. And93 (1993), And99 (1999), Chen et al. Che95 (1995)), as already proposed by Fuller et al. (Ful95 (1995)) and Fuller & Wooten (Ful00 (2000)), although it is less extreme than the prototype Class 0 source VLA1623 (André et al. And90 (1990), André et al. And93 (1993)). IRAS 18148 has a luminosity of about 10 L⊙ and drives a well-collimated bipolar CO outflow (Parker et al. 1988b , Par91 (1991), Fuller et al. Ful95 (1995), Bontemps et al. Bon96 (1996), Hatchell et al. Hat99 (1999)), and is associated with a variable H2O maser (Xiang & Turner Xia95 (1995)) and shocked H2 emission (Fuller et al. Ful95 (1995), Buckle et al. Buc99 (1999)). NIR imaging of the source vicinity shows a well-defined, parabolic reflection nebula, which is optically invisible and coincides with the blue lobe of the CO outflow (Hodapp Hod94 (1994), Fuller et al. Ful95 (1995)). Ammonia observations by Goodman et al. (Goo93 (1993)), Fuller & Myers (Ful93 (1993)), Anglada et al. (Ang97 (1997)), and Fuller & Wootten (Ful00 (2000)) reveal that the L483 core is centrally concentrated, has a strong velocity gradient across it, and a gas kinetic temperature of about 10 K. H2CO and CS spectra toward the central source present strong self absorption with lines having brighter blue peak, a signature of infall motions (Myers et al. Mye95 (1995), Mardones et al. Mar97 (1997)).
The combination in L483 of Class 0 characteristics, like a low and infall asymmetry, together with the presence of a bright NIR nebula, indicative of partial core disruption, makes this source an interesting object to study the early evolution of a very young stellar object. To carry out such a study, we have observed L483 in tracers sensitive to different aspects early stellar life, like the outflow (CO, section 3.1), the dense core and possible chemical outflow anomalies (CH3OH, section 3.2), and infall and shock chemistry (H2CO, 3.3). From the combination of these observations, we propose that the central source in L483 has already started its transition toward Class I, and that the outflow has lost part of the chemical richness characteristic of Class 0 flows (section 4).
2 Observations
We observed L483 with the IRAM 30m telescope during several sessions in 1994 September, 1995 September, November, and 1996 June. Different receiver configurations were used to map the core in 12CO(2–1) [230.53799 GHz], H2CO(212–111) [140.839518 GHz], and CH3OH(–) [96.741420 GHz], and to observe selected positions in 13CO(1–0), C18O(1–0), C17O(1–0), HCO(212–111), H2CO(312–211), and SiO(2–1). Most observations were done in position switching mode (PSW) in order to obtain flat baselines. After searching for a clean off position, we settled with (, ) with respect to our map center (, position of IRAS 18148-0440). This position lies outside the optical obscuration associated with L483 and seems free from dense gas tracer emission, although it has a weak 12CO(2–1) line at a level of 2 K between km s-1 (outside the L483 range). A frequency switched (FSW) 12CO(2–1) spectrum of this position was taken so it could be added to the data if needed, and a test was made by adding the off spectrum to a PSW spectrum from the origin and comparing the result with a FSW spectrum; the two were indistinguishable. The data shown in this paper, except when indicated, correspond to PSW observations without addition of the off position.
The backend was an autocorrelator split into different windows with resolutions ranging from 0.1 km s-1 for 12CO(2–1) to 0.03 km s-1 for CH3OH(–). The telescope pointing was corrected frequently by observing continuum sources and is expected to be accurate within . The scale of the telescope was converted into using the main beam efficiencies recommended by Wild (Wil95 (1995)). The full width at half maximum of the telescope beam varies linearly with wavelength, and ranges from for CH3OH(–) to for 12CO(2–1). Spectra were taken with spacing, which is slightly less than one beam at the highest frequency.
3 Results
3.1 CO data
3.1.1 Ambient CO emission
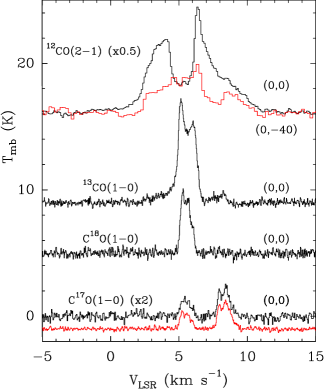
In this section we derive the basic parameters of the gas along the line of sight towards the L483 core center using a series of CO isotopomer lines. As Fig. 1 shows, the 12CO(2–1) line is heavily self absorbed between 4.5 and 6.5 km s-1, with a of 4-5 K Given that the gas between these velocities is optically thick, its excitation temperature has to be 8.5-9.5 K, a value close to the kinetic temperature of the dense gas (10 K, from NH3 and HC3N, Fuller & Myers Ful93 (1993), Anglada et al. Ang97 (1997)). The gas responsible for the 12CO(2–1) absorption represents low density gas in the outer layers of the cloud, far from the dense core, so the above result suggests that all the ambient gas along the line of sight has an almost constant temperature of 10 K (note that the outflow gas is warmer, see below).
In contrast with the self absorbed 12CO(2–1) emission, C18O(1–0) and C17O(1–0) are optically thin. This is not evident because of the non-Gaussian shape of the spectra (Fig. 1), but can be proved using the following simple model: we create a C17O(1–0) spectrum by adding three replicas of the C18O(1–0) line each shifted in velocity by the proper hyperfine splitting and weighted by the optically thin relative intensity. The result, shown in lighter shade below the C17O(1–0) spectrum, matches very well the observations, indicating that both C18O(1–0) and C17O(1–0) are thin. The non Gaussian shape of these lines has therefore to result from velocity structure along the line of sight (see section 3.2 for further details).
With the excitation temperature of 10 K and the fact that C17O(1–0) is thin, we can derive the core central H2 column density. We integrate the C17O(1–0) emission in velocity and assume local thermodynamic equilibrium, estimating a N(C17O) of 1.5 cm-2. For a standard C17O abundance of (Frerking et al. Fre82 (1982), Wilson & Rood Wil94 (1994)), this value implies an H2 column density of 3 cm-2.
To finish this section, we note the presence in Fig. 1 of CO emission outside the ambient cloud range (-6.5 km s-1). Part of this emission comes from outflow gas (discussed in section 3.1.2), but other part must come from additional clouds along the line of sight. This is the case for two features at and 8 km s-1, mostly seen in 13CO, as they are spread over an area larger than 6 arcminutes. It must also be the case for some contribution between 2.5 and 4.5 km s-1, which is very prominent in the 12CO spectra outside the outflow range (see (0,) spectrum in Fig. 1). As we will see below, this low velocity emission limits our study of the outflow gas, to which we now turn our attention.
3.1.2 The outflow
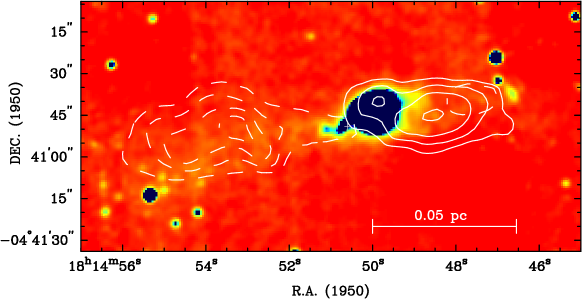
Fig. 2 presents our CO(2–1) map of the L483 outflow (see also Fig. 9). As previous maps (Parker et al. Par91 (1991), Fuller et al. Ful95 (1995), Bontemps et al. (Bon96 (1996)), and Hatchell et al. Hat99 (1999)), it shows that the accelerated CO emission extends E-W with IRAS 18148 at the center. The red CO lies to the east of IRAS 18148 while the blue CO lies to the west, although there is some red gas near the western tip of the blue lobe. This anomalous red gas coincides with a region of shocked H2 emission (Fuller et al. Ful95 (1995)), and probably represents outflow material with an enhanced turbulent component because of the shock.
A comparison of the CO outflow with the K′ (2.1 m) image of Hodapp (Hod94 (1994)) (Fig. 2) shows that the blue CO delineates very closely the reflection nebula and presents a relative maximum toward its center. In contrast, the red (eastern) CO is weak and highly collimated near IRAS 18148 and reaches a maximum 0.04 pc away from it. This east-west asymmetry of the CO outflow suggests that a similar asymmetry occurs in the underlying nebula, which would therefore have an intrinsically brighter western side.
As the 12CO(2–1) spectrum in Fig. 1 shows, the outflow gas is warmer than the ambient core, or otherwise its emission would not be brighter than the self absorption by 10 K gas. The strongest CO wings imply excitation temperatures of 20 K (twice the ambient kinetic temperature), and this is a lower limit because the CO emission may not be thick and thermalized. In fact, Hatchell et al. (Hat99 (1999)) have argued, from a comparison of CO(4–3) and CO(2–1) lines, that temperatures up to 50 K could be present in the CO outflow. Given that we do not find brightness temperatures larger than 20 K, we take this value as a lower limit for our further calculations of the outflow energetics (see below) and molecular abundances (sections 3.2 and 3.3).
With the above value for the CO(2–1) , we estimate the outflow energetics. This requires special care because the outflow is rather slow and the CO spectra are contaminated at low velocities, so in the Appendix we present a method to deal with the contaminating emission. Of course, we cannot correct for the outflow gas hidden by the self absorption, so all CO emission in the central 3 km s-1 (about km s-1) will be ignored, and our estimate will represent a lower limit. As the highest outflow velocities, we take and 14 km s-1, because no faster outflow emission is found in the CO(2–1) velocity maps. Assuming a CO abundance of (Frerking et al. Fre82 (1982)), we derive an outflow mass of 0.01 M⊙, a momentum of 0.03 M⊙ km s-1, and a kinetic energy of erg. From a total outflow length of and a total velocity extent of 15 km s-1, we derive a kinematical time of yr. These values are in reasonable agreement with those from from Parker et al. (Par91 (1991)).
3.2 CH3OH and SiO data

Figure 3 presents a CH3OH(–) spectrum toward the core center with labels indicating the different components. Among the E-type lines, the =1 component is not detected, while the the integrated intensity ratio between the – and – lines is approximately 7, very similar to the ratio found by Turner (Tur98 (1998)) for TMC-1 and L183. The relatively high intensity of the lines (about 2.5 K at the peak) implies an excitation temperature of at least 5.5 K, while an LTE rotation diagram analysis (e.g., Menten et al. Men88 (1988)) indicates temperatures of 4 K at most. This suggests that non LTE conditions may apply, and that for the E-type CH3OH, the lower lying = ladder has a higher than the higher =0 ladder. The excitation conditions are probably constant over the core, as an average over all (75) positions outside the central gives a spectrum with the same intensity ratios among all the E and A components as in the spectrum shown in Fig. 3; we will use below this apparently constant conditions to infer a lower limit to the density gradient in the core. From the integrated intensities in the central spectrum, we estimate a CH3OH column density of about cm-2, which together with our estimated H2 column density implies a CH3OH abundance of , which is very close to the abundances estimated for other dark clouds (Friberg et al. Fri88 (1988), Bachiller et al. Bac95 (1995), Turner Tur98 (1998)).
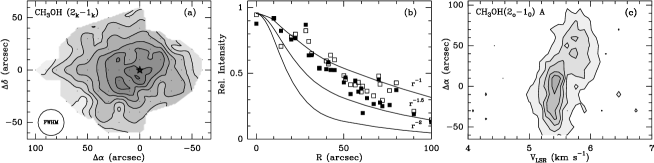
The spatial distribution of the CH3OH(–) integrated intensity, shown in Fig. 4a, is rather round and centrally concentrated toward IRAS 18148. This is also the case with other dense gas tracers like HC3N, NH3, and N2H+ (Fuller & Myers Ful93 (1993), Anglada et al. Ang97 (1997), Caselli et al. Cas00 (2000)), and is probably a sign of the extreme youth of the embedded star, which has not had time to perturb the bulk of the parental core (despite carving the nebula). The central concentration of the emission reinforces our interpretation that the emission is mostly optically thin, as otherwise we would expect a flat distribution (our unpublished NH3 data indicate a constant gas kinetic temperature across the core).
Fuller et al. (Ful95 (1995)) have inferred an r-2 density gradient within of the IRAS source based on the intensity contrast between the two sides of the IR reflection nebula, but their calculation depends critically on assuming that the nebula is symmetric, which we have seen is probably not the case. More recently, Fuller & Wootten (2000) have proposed that the r-2 profile continues to larger radii () using a model for the NH emission, although this result could be affected by interferometer missing flux. Here we use the CH3OH emission to derive an independent estimate, assuming that this emission is thin and the excitation temperature is constant. In Fig. 4b, we show a radial average of the emission, together with the results from our model for three density power laws: , , and (results convolved with a Gaussian beam). As the figure shows, the density law is too steep, and the observations are better fit between and using a profile with probably some steepening for .
In the optically thin limit, the brightness radial profiles of Fig. 4 are proportional to column density radial profiles, so we can use them to estimate the core mass by normalizing them to the central H2 column density and integrating them radially. In this way, we derive a core mass between 5 M⊙ ( density profile) and 10 M⊙ ( density profile). These values are in good agreement with the ammonia result from Anglada et al. Ang97 (1997), and also agree with a virial estimate using the average CH3OH line width over the core (0.64 km s-1), which gives 7 and 8 M⊙ for and density profiles, respectively.
Although the CH3OH lines are relatively narrow compared with other dense gas tracers like H2CO, they are systematically asymmetric and change velocity across the core. This is illustrated in Fig. 4c with a position-velocity diagram along the east-west axis of the core, which shows that the line center velocity shifts abruptly by about 0.3 km s-1 near the position of IRAS 18148 (origin of offset coordinates); lines toward are brighter, bluer, and narrower than toward the east. These two velocity components coincide with the C18O (and C17O) peaks we have found in section 3.1.1, and and can also be seen in our N2H+(1–0) data. Fuller & Myers (Ful93 (1993)), with low resolution observations, have reported that the spectra from L483 seem to have two velocity components, while Goodman et al. Goo93 (1993) found a systematic velocity gradient across the core, all in the same direction as the velocity change we find. The origin of this behavior is not clear, but we notice that the sense of the velocity change agrees with the sense of the bipolar outflow. It is therefore possible that it arises from the acceleration of dense gas by the outflow, since the position velocity diagram is similar to that of L1228 in C3H2 (Tafalla & Myers Taf97 (1997)), where outflow acceleration is the cause of a similar velocity shift.
Independently of the origin of the velocity shift, it is clear that the CH3OH spectra in L483 do not show the prominent high-velocity wings seen in some low mass outflows like NGC 1333-IRAS 2 (Sandell et al. San94 (1994)) and L1157 (Bachiller at al. Bac95 (1995)). The wings in these systems arise from large abundance enhancements of CH3OH, which in the best studied case of L1157, amounts to a factor of 400 (Bachiller et al. Bac95 (1995), Bachiller & Pérez-Gutiérrez Bac97 (1997)). For L483, the non detection of CH3OH at the velocities with CO outflow implies that any possible CH3OH abundance enhancement cannot be larger than around 10, which is at least 40 times lower than in L1157. Higher signal-to-noise data can probably lower this limit by a significant amount.
Another tracer with prominent wings toward certain outflows is SiO (e.g., Bachiller & Pérez-Gutiérrez Bac97 (1997)), and three L483 positions were observed in the 2–1 line of this molecule (origin, E, and W). Our non detections (with limits of the order of 0.1 K km s-1) imply SiO abundances lower than and for the ambient gas and the outflow, respectively (numbers derived using an large velocity gradient analysis). Although the non detections make impossible to estimate an abundance enhancement in the outflow, comparing our outflow limit with the SiO abundance found in L1157 (, Mikami et al. Mik92 (1992), Bachiller & Pérez-Gutiérrez Bac97 (1997)), we estimate that any possible enhancement in L483 is at least 100 times smaller than in L1157.
3.3 H2CO Data

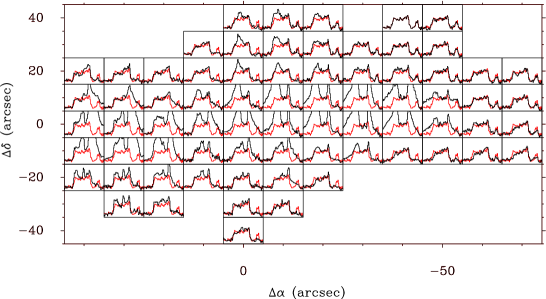
Our other dense gas tracer, H2CO, presents very different lines than CH3OH. Fig. 5 shows a series of H2CO(212–111) spectra for different core positions illustrating the variety of profiles. At ambient velocities ( km/s), the lines are strongly self absorbed over most of the core, as can be checked by comparing the double-peaked main isotope with the single-peaked rare HCO line toward the central position (Fig. 5 top panel). This self absorption is slightly red shifted with respect to the emitting gas, so the resulting spectrum has a brighter blue peak, a fact already noticed by Myers et al. (Mye95 (1995)) and Mardones et al. (Mar97 (1997)), who have presented preliminary versions of the H2CO spectrum towards the core center. Such red-shifted self absorptions are characteristic signatures of inward motions (e.g, Leung & Brown Leu77 (1977)), and their presence in L483 makes this core one of the best infall candidates known. A detailed study of the spatial distribution of the self absorption and its interpretation in terms of infall motions will be presented elsewhere (Mardones et al. Mar00 (2000), see also Mardones Mar98 (1998)), so here we limit ourselves to briefly comment on this feature.
Double-peaked H2CO spectra abound in the core and are more prominent along the outflow axis, although a map of the spectral asymmetry parameter (defined as the difference between the thick and thin line peaks normalized to the thin line width, see Mardones et al. Mar97 (1997)) shows that the blue asymmetry is stronger perpendicular to the flow. Overall, despite the presence of high-velocity blue and red wings in the H2CO lines, the ambient self absorption is mostly red shifted and an average spectrum over the central core is clearly asymmetric in the sense of infall. To estimate the global infall rate in L483, we first determine the infall radius from the extent of the H2CO spectra with brighter blue peak, which we measure from the data as 0.02 pc. Then, we use the simple 2-layer model of Myers et al. (Mye96 (1996)), which allows to derive an infall velocity from the contrast between the blue and red peaks of a self absorbed line profile knowing the intrinsic line width from a thin tracer (see their Eq. 9). To do this, we take the average H2CO spectrum inside the infall radius, and use as thin tracer the average CH3OH spectrum over the same area. In this way, we derive a mean infall speed of 0.02 km s-1, which is clearly subsonic. Finally, we derive a mean density inside the infall radius using the power-law density models derived in our CH3OH analysis, which give a mean density of cm-3 for a profile and cm-3 for a profile. Averaging the above densities to cm-3, we derive a mass infall rate of M⊙ yr-1 (see Mardones et al. Mar00 (2000) for further details).
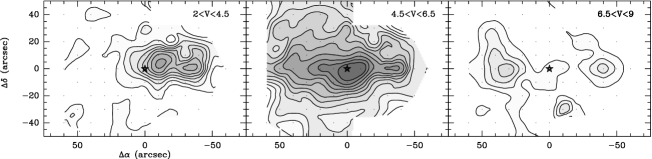
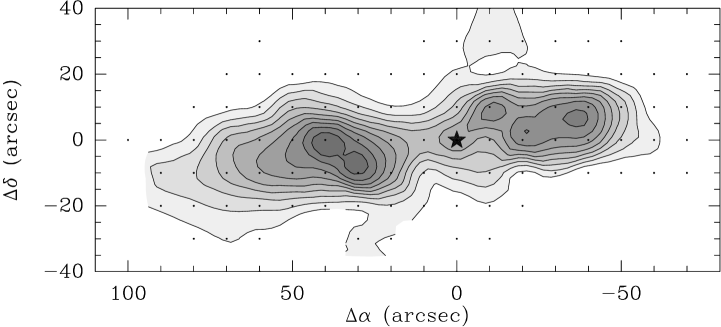
At velocities outside the ambient range, the H2CO spectra present strong wings that change with position following the distribution of accelerated gas in the bipolar outflow. The spectra at (, 0) and (, 0) in Fig. 5 illustrate this effect, which implies that the bipolar outflow is accelerating part of the dense core gas, probably shocking it and altering its chemical composition (see below). To better illustrate the dense-gas acceleration traced by H2CO, we present in Figure 6 velocity maps for the blue, ambient, and red regimes. The blue and red maps agree very well with equivalent outflow maps from CO (see Fig. 2), especially for the blue lobe. There, both emissions present two maxima, one associated with the reflection nebula, and the other with the region of strong H2 emission at the end of the lobe. Even more, both emissions present an “anomalous” red peak towards the position of bright H2 emission, again suggesting this gas is shock related. These similarities suggest that CO and H2CO, despite their different dipole moments, are tracing the same (or very closely connected) gas.

As a further illustration of the importance of the outflow acceleration in the H2CO emission, we show in Fig. 7 a position-velocity diagram along the the Right Ascension axis (i.e., approximately parallel to the outflow). At ambient velocities, the strong self absorption can be easily seen in the form of two bright emission peaks at about 5.2 and 6 km s-1. At high velocities, the outflow wings form two triangular-shaped extensions which illustrate how the emission terminal velocity increases almost linearly with distance from the outflow source (at ); such linear increases are common in the CO emission from outflows (e.g., Meyers-Rice & Lada Mey91 (1991)). We can also see in the position-velocity diagram that towards the west (), both the wing and the ambient emission drop simultaneously. This suggests that the high velocity gas is breaking through the dense core, something also suggested by the presence of bright H2 emission. Towards the east, the ambient gas is more extended than the outflow wing, so it seems the outflow is bounded in this direction.
We finish studying the H2CO abundance in the outflow and comparing it to the abundance in the ambient cloud. As the H2CO(212–111) line is self absorbed at ambient velocities, we use in this range the HCO isotopomer, which is very likely thin (see Fig. 5). In this way, using an LTE analysis with K and a 12C/13C ratio of 77 (Wilson & Rood Wil94 (1994)), we derive a H2CO ambient column density of cm-2 for the central position (a similar analysis using H2CO(312–211) gives the same number). This value implies an ambient abundance of . For the outflow regime, we use the H2CO(212–111) line and compare it with the outflow CO emission. Applying the same LTE analysis as before, we estimate outflow abundances at (, 0) (blue) and (, 0) (red) of about , suggesting an H2CO abundance enhancement of a factor of 20. This number is slightly smaller that the factor of 60-80 found in L1157 (Bachiller & Pérez-Gutiérrez Bac97 (1997)), but is significantly larger than our limit for the CH3OH enhancement. Thus, in contrast with L1157 for which CH3OH is enhanced by almost an order of magnitude more than H2CO, L483 is richer in H2CO.
4 Evolutionary status of IRAS 18148-0440
As mentioned in the Introduction, IRAS 18148 belongs to Class 0 (André et al. And93 (1993), André et al. And99 (1999)) due to its red spectral energy distribution, although it is less extreme than objects like VLA1623. IRAS 18148 has additional Class 0 characteristics like the presence of infall asymmetry in line spectra (Mardones et al. Mar97 (1997)). After analyzing its molecular environment in previous sections, we now compare this object and its outflow with other Class 0 sources, and to do this, we present in Table 1 a summary of properties of different Class 0 sources with similar luminosity () for which enough molecular data are available.
-
a
With respect to ambient cloud.
-
b
Outflow terminal velocity from CO in km s-1.
-
c
Presence of CO “bullets.”
-
d
Not detected. Enhancement at least 100 times smaller than in L1157.
-
References:
(1) Bachiller et al. 1991a , (2) Mardones et al. Mar97 (1997), (3) Bachiller et al. Bac90 (1990), (4) Bachiller et al. 1991b , (5) Umemoto et al. Ume92 (1992), (6) Bachiller & Pérez-Gutiérrez Bac97 (1997), (7) Avery & Chiao Ave96 (1996), (8) Bourke et al. Bou97 (1997), (9) Garay et al. Gar98 (1998), (10) Fuller et al. Ful95 (1995)
As Table 1 shows, L483 is very different kinematically from L1448-C, a source characterized by an extremely collimated and fast bipolar CO outflow with discrete high velocity components (“bullets”) (Bachiller et al. Bac90 (1990), see also Barsony et al. Bar98 (1998), O’Linger et al. Oli99 (1999), Eislöffel Eis00 (2000), and the similar object VLA1623 found by André et al. And90 (1990)). Despite our limited knowledge of the chemical composition of the L1448-C outflow, Table 1 shows that L483 also differs from L1448-C in its chemical enhancements, again in the sense of L1448-C being more extreme.
More similarities are found between L483 and L1157 and BHR 71 (L1157: Umemoto et al. Ume92 (1992), Mikami et al. Mik92 (1992), Bachiller et al. Bac95 (1995), Tafalla & Bachiller Taf95 (1995), Zhang et al. Zha95 (1995), Avery & Chiao Ave96 (1996), Bachiller & Pérez-Gutiérrez Bac97 (1997) Gueth et al. Gue98 (1998), Umemoto et al. Ume99 (1999), Zhang et al. Zha00 (2000); BHR 71: Bourke et al. Bou97 (1997), Garay et al. Gar98 (1998)). These outflows have comparable kinematics in the sense of having lower velocities and lacking “bullets” (also their collimation is similar), but differ by the amount of the chemical enhancement in the sense that the numbers for L483 are systematically smaller. Although the uncertainties in the chemical estimates are rather large, the differences shown in Table 1 are too extreme to be due to observational error. This means that among “chemically active” outflows, L483 is a weak case.
Bachiller & Tafalla Bac99 (1999) have argued that outflows evolve with time from having “bullets” to not having them, and from being chemically active to not being so (see Bontemps et al. Bon96 (1996) for evidence that outflow momentum flux systematically decreases with outflow age). If this evolution scenario is correct, IRAS 18148 in L483 would represent a rather late stage of a Class 0 source, and the objects in Table 1 would be ordered by increasing age from top to bottom. Unfortunately, no independent stellar clock exists yet to order by age the different Class 0 objects, and as Table 1 shows, the bolometric temperature cannot distinguish between extremely young sources, probably due to the lack of mid and far IR photometry. There is a reason, however, to suspect that IRAS 18148 is more evolved than other Class 0 sources, and that the above evolution scenario is correct: L483 has a bright NIR nebula (Hodapp Hod94 (1994), Fuller et al. Ful95 (1995)) in contrast with L1448-C and L1157 (Bally et al. Bal93 (1993), Hodapp Hod94 (1994), Davis & Eislöffel Dav95 (1995)) (but note BHR 71 also has a NIR nebula, Bourke et al. Bou97 (1997)). The presence of such a nebula suggests that the L483 outflow has been accelerating ambient material for longer than the outflows from the other objects in Table 1, and that IRAS 18148 is more advanced in its transition to become a visible object (e.g., Shu et al. 1987). Other Class 0 object with a NIR nebula is L1527 (Eiroa et al. Eir94 (1994)), so if the above scenario is correct, one would expect to find in this object a weak abundance enhancement of the molecules shown in Table 1. Observations of this object should be done to test this point.
The status of L483 as a somewhat evolved Class 0 object is also consistent with its relatively low value / ( %, compare with the 10 % of VLA1623, André et al. And93 (1993)) and with the work of Bontemps et al. Bon96 (1996). Applying the factor of 10 correction these authors apply to their CO data (see their Eq. 2), we estimate for L483 a momentum flux á la Bontemps et al. of M⊙ km s-1 yr-1. This value is almost a factor of 2 lower than the mean momentum flux of Class 0 objects, but still 8 times larger than the average number for Class I sources. L483, again, appears as a Class 0 object already evolving toward Class I.
If the Class 0 encompasses sources as diverse as those powering the L1448-C and L483 outflows, outflow evolution should occur very rapidly during the star’s first few yr (the expected duration of the Class 0 stage, see André et al. And93 (1993)). It is possible that this evolution is driven by a rapid decrease in the infall/accretion rate on the central object (Bontemps et al. Bon96 (1996), Tomisaka Tom96 (1996), Henriksen et al. Hen97 (1997)), but although Class 0 objects do have stronger infall signatures than Class I sources, there is no clear infall trend among Class 0 objects themselves (Mardones et al. Mar97 (1997)). Further study of transition objects like L483 is needed to understand these earliest changes of stellar life, and as this work has shown, the combination of the chemistry and kinematics of the outflow may hold the key to that understanding.
5 Summary
We have observed the L483 core and outflow in different mm molecular transitions and made full maps in CO(2–1), CH3OH(2k–1k), and H2CO(221–111). With these data, we have studied the outflow, the core, and their relation with the IR cometary nebula around IRAS 18148. The main conclusions of our work are as follows:
1. The 12CO emission at ambient velocities is extremely thick with the brightness temperature expected for gas at 9 K, the temperature previously estimated for the core gas. Outside the ambient regime the 12CO lines present bright wings indicating outflow material warmer than the ambient gas by at least a factor of 2. A simple model for the C17O(1–0) emission towards the core center shows that this line is optically thin and non Gaussian due to the presence of two velocity components. From the integrated C17O(1–0) emission we estimate a central H2 column density of cm-3 in the inner .
2. The CO outflow emission is compact and slow, with a total length of 0.15 pc and a kinematical age of yr. Lower limits to the outflow mass, momentum, and energy are 0.01 M⊙, 0.03 M⊙ km s-1, and erg, respectively. The CO outflow is asymmetric, with a blue lobe having a bright spot coinciding with the NIR nebula and the red lobe being weaker near IRAS 18148 and having a relative maximum from the source. This asymmetry suggests that the reflection nebula around the IRAS source may also be asymmetric and have a more prominent blue side.
3. The CH3OH emission traces a dense core with no appreciable outflow wing contribution, although there is a shift in the line velocity along the direction of the outflow. The CH3OH emission is centrally concentrated on the IRAS position, and in the central (0.1 pc) it decreases radially in a manner intermediate between what would be expected for optically thin emission with density power laws of and . The estimated mass in this region is 5-10 M⊙. No evidence for CH3OH or SiO abundance enhancement is found in the outflow.
4. The H2CO(212–111) emission is self absorbed at ambient velocities, and presents spectra with brighter blue peak, characteristic of inward motions, toward the central . With a simple model, we estimate an average infall speed of 0.02 km s-1 and an infall rate of M⊙ yr-1. At high velocities, the H2CO(212–111) line presents bright wings in the same sense as the CO outflow wings, indicative of outflow acceleration. Comparing the H2CO and CO wing intensities we find that the H2CO abundance in the outflow regime is enhanced with respect to the ambient regime by a factor of 20.
5. The combination of CO, CH3OH, and H2CO data shows that the L483 outflow is less extreme than other outflows from Class 0 objects, like L1448-C and L1157, although it has some of their characteristics, such as gas heating and some abundance enhancement. We therefore suggest that the Class 0 source at the center of the L483 outflow is more evolved than other Class 0 sources, and it is in its transition to become a Class I object.
Acknowledgements.
This research has made use of the Simbad data base, operated at CDS, Strasbourg, France, and NASA’s Astrophysics Data System Abstract Service. The Digitized Sky Survey was produced at the Space Telescope Science Institute under US Government grant NAG W-2166. MT and RB acknowledge partial support from the Spanish DGESIC grant PB96-104, PCM acknowledges support from NASA Origins of Solar Systems grant NAG5-6266, and DM acknowledges partial support from grant FONDECYT 1990632.Appendix A Separation between outflow and ambient cloud emission
Estimating the outflow energetics for L483 is complicated because its low velocity and the presence of an extended component. In this appendix we discuss the method we have applied to correct for contamination by background gas seen in emission. Unfortunately, the part of the outflow emission absorbed by foreground gas cannot be recovered by any simple means.
The reason it is possible to correct for the extended emission in L483 is because this emission seems constant over the flow. This can be seen in Figure 8, where we present a map of spectra with the spectrum from (, ) (a representative ambient position) superposed in lighter shade over each map position. As the figure shows, positions without outflow wings have spectra with the same shape, suggesting that the ambient cloud superposed to the outflow emission contributes everywhere with a similar spectrum. If the outflow emission is optically thin (as suggested by the lack of 13CO(1–0) wings), this extended component can be subtracted out, leaving outflow-only emission as a residual. The origin of the extended component is in part ambient cloud background to the outflow (the foreground part causes the absorption and cannot be corrected for) and in part background emission from unrelated gas from the Aquila Rift, as discussed in section 3.1.1. The fact that its spectrum is rather flat topped suggests that this emission is partly thick with a kinetic temperature around 10 K, like that of the ambient L483 emission (but less extreme given its weaker 13CO(1–0) emission). Given these characteristics, the gas that does not appear in absorption is most likely background to the outflow and therefore susceptible to correction.
To avoid adding noise in the process, we have used as background emission the average of all non outflow positions, and we have subtracted this spectrum to each observed position. The result seems to contain outflow emission only, as illustrated by the total integrated emission map of Figure 9, which is very similar to the outflow map in Fig. 2 (where no background subtraction was applied). To these background-subtracted spectra we have applied the standard energetics analysis (cf. Margulis & Lada Mar85 (1985)), and have ignored any contribution in the range -7 km s-1, as these velocities are contaminated by self absorption. For being forced to ignore these very low velocities, our estimates are necessarily lower limits to the real outflow parameters.
References
- (1) André, P., Martín-Pintado, J., Despois, D., Montmerle, T. 1990, A&A 236, 180
- (2) André, P., Ward-Thompson, D., Barsony, M., 1993, ApJ, 406, 122
- (3) André, P., Ward-Thompson, D., Barsony, M., 1999, in Protostars and Planets IV, Mannings V., Boss A.P., Russel S.S., (Tucson: Univ. of Arizona Press),
- (4) Anglada, G., Sepúlveda, I., & Gómez, J.L., 1997, AAS, 121, 255
- (5) Avery, L.W., Chiao, M., 1996, ApJ, 463, 642
- (6) Bachiller, R., André, P., & Cabrit, S., 1991a, A&A, 241, L43
- (7) Bachiller, R., Cernicharo, J., Martín-Pintado, J., Tafalla, M., Lazareff, B. 1990 A&A 231, 174
- (8) Bachiller, R., Martín-Pintado, J., Fuente, A., 1991b, A&A, 243, L21
- (9) Bachiller, R., Liechti, S., Walmsley, C.M., Colomer, F. 1995, A&A 295, L51
- (10) Bachiller, R., & Pérez-Gutiérrez, M., 1997, ApJ, 487, L93
- (11) Bachiller, R., & Tafalla, M., 1999, in The Origins of Stars and Planetary Systems, Lada C.J., Kylafis, N.D. (eds.), (Dordretch: Kluwer), 227
- (12) Bally, J., Lada, E.A., Lane, A.P. 1993, ApJ, 418, 322
- (13) Barsony, M., Ward-Thompson, D., André, P., O’Linger, J., 1998, ApJ, 509, 733
- (14) Bontemps, S., André, P., Terebey, S., Cabrit, S., 1996, A&A, 311, 858
- (15) Bourke, T.L. et al. 1997, ApJ, 476, 781
- (16) Buckle, J.V., Hatchell, J., Fuller, G.A., 1999, A&A, 348, 584
- (17) Caselli et al. 2000, in preparation
- (18) Chen H., Myers, P. C., Ladd, E. F., Wood, D. O. S., 1995, ApJ, 445, 377
- (19) Dame, T.M., Thaddeus, P., 1985, ApJ, 297, 751
- (20) Davis, C.J., Eislöffel, J., 1995, A&A, 300, 851
- (21) Eislöffel, J., 2000, A&A, 354, 236
- (22) Eiroa, C., Miranda, L.F., Anglada, G., Estalella, R., 1994, A&A, 283, 973
- (23) Fuller, G.A., Lada, E.A., Masson, C.R., Myers, P.C., 1995, ApJ, 453, 754
- (24) Fuller, G.A., & Myers, P.C., 1993, ApJ, 418, 273
- (25) Fuller, G.A., & Wootten, A., 2000, ApJ, in press
- (26) Frerking, M. A., Langer, W. D., Wilson, R. W., 1982, ApJ, 262, 590
- (27) Friberg, P., Madden, S.C., Hjalmarson, Å, Irvine, W.M., 1988, A&A, 195, 281
- (28) Garay, G., Köhnenkamp, I., Bourke, T.L., Rodríguez, L.F., Lehtinen, K.K. 1998, ApJ, 509, 768
- (29) Gueth, F., Guilloteau, S., Bachiller, R., 1998, A&A, 333, 287
- (30) Goodman, A.A., Benson, P.C., Fuller, G.A., Myers, P.C., 1993, ApJ, 406, 528
- (31) Henriksen, R.N., André, P., Bontemps, S., 1997, A&A, 323, 549
- (32) Hatchell, J., Fuller, G.A., Ladd, E.F., 1999, A&A, 344, 687
- (33) Hodapp, K.-W., 1994, ApJS, 94, 615
- (34) Ladd, E.F., Adams, F.C., Casey, S., Davidson, J.A., Fuller, G.A., Harper, D.A., Myers, P.C., Padman, R., 1991, ApJ, 366, 203
- (35) Ladd, E.F., Adams, F.C., Fuller, G.A., Myers, P.C., Casey, S., Davidson, J.A., Harper, D.A., Padman, R., 1991, ApJ, 382, 555
- (36) Leung, C.M., Brown, R.B., 1977, ApJ, 214, L73
- (37) Mardones, D., 1998, PhD thesis, Harvard University
- (38) Mardones, D., Myers, P.C., Tafalla, M., Wilner, D.J., Bachiller, R., Garay, G., 1997, ApJ, 489, 719
- (39) Mardones et al., 2000, in preparation
- (40) Margulis, M., Lada, C.J., 1985, ApJ, 299, 925
- (41) Menten, K.M., Walmsley, C.M., Henkel, C., Wilson, T.L., 1988, A&A, 198, 253
- (42) Meyers-Rice, B.A., Lada, C.J., 1991, ApJ, 368, 445
- (43) Mikami, H., Umemoto, T., Yamamoto, S., Saito, S., 1992, ApJ, 392, L87
- (44) Myers, P.C., Ladd, E.F., 1993, ApJ, 413, L47
- (45) Myers, P.C., Bachiller, R., Caselli, P., Fuller, G.A., Mardones, D., Tafalla., M., Wilner, D.J. 1995, ApJ, 449, L65
- (46) Myers, P.C., Mardones, D., Tafalla, M., Williams, J.P., Wilner, J.D., 1996, ApJ, 465, L133
- (47) O’Linger, J., Wolf-Chase, G., Barsony, M., Ward-Thompson, 1999, ApJ, 515, 696
- (48) Parker, N.D. 1988, MNRAS, 235, 139
- (49) Parker, N.D., Padman, R., Scott, P.F., 1991, MNRAS, 252, 442
- (50) Parker, N.D., Padman, R., Scott, P.F., Hills, R.E., 1988, MNRAS, 234, 67P
- (51) Sandell, G. Knee, L.B.G., Aspin, C., Robson, I.E., Russell, A.P.G. 1994, A&A, 285, L1
- (52) Shu, F. H., Adams, F. C., Lizano, S., 1987, ARAA, 25, 23
- (53) Tafalla, M., Bachiller, R., 1995, ApJ, 443, L37
- (54) Tafalla, M., Myers, P.C., 1997, ApJ, 491, 653
- (55) Tomisaka, K., 1996, PASJ, 48, L97
- (56) Turner, B.E., 1998, ApJ, 501, 731
- (57) Umemoto, T., Iwata, T., Fukui, Y., Mikami, H., Yamamoto, S., Kameya, O., Hirano, N., 1992, ApJ, 392, L83
- (58) Umemoto, T., Mikami, H., Yamamoto, S., Hirano, N. 1999, ApJ, 525, L105
- (59) Wild, W., 1995, The 30 m Manual: A Handbook for the 30 m Telescope, IRAM Tech. R
- (60) Wilson, T.L., Rood, R.T., 1994, ARAA, 32, 191
- (61) Xiang, D., Turner, B.E., 1995, ApJS, 99, 121
- (62) Zhang, Q., Ho, P.T.P., Wright, M.C.H., Wilner, D.J. 1995, ApJ 451, L71
- (63) Zhang, Q., Ho, P.T.P., Wright, M.C.H., 2000, AJ, 119, 1345