The Abundance of Interstellar Boron11affiliation: Based on observations made with the NASA/ESA Hubble Space Telescope, obtained from the data archive at the Space Telescope Science Institute. STScI is operated bythe Association of Universities for Research in Astronomy, Inc. under the NASA contract NAS 5-26555.
Abstract
We use new Space Telescope Imaging Spectrograph (STIS) and archival Goddard High Resolution Spectrograph (GHRS) observations to study interstellar B II and O I absorption along seven sightlines. Our new column density measurements, combined with measurements of four sightlines from the literature, allow us to study the relative B/O abundances over a wide range of interstellar environments. We measure sightline-integrated relative gas-phase abundances in the range to , and our data show the B/O abundances are anticorrelated with average sightline densities over the range to . Detailed comparisons of the B II and O I line shapes show that the B/O ratio is significantly higher in warm interstellar clouds than in cool clouds. These results are consistent with the incorporation of boron into dust grains in the diffuse ISM. Since boron is likely incorporated into grains, we derive a lower limit to the present-day total (gas+dust) interstellar boron abundance of . The effects of dust depletion and ionization differences from element to element will make it very difficult to reliably determine 11B/10B along most interstellar sightlines.
1 Introduction
Production of the light element boron in standard big bang nucleosynthesis models is negligible (see, e.g., Pagel 1997). The chemical evolution of boron is determined by its production through cosmic ray spallation of interstellar material (Reeves, Fowler, & Hoyle 1970; Meneguzzi, Audouze, & Reeves 1971) and/or neutrino-induced spallation in type II supernovae (Woosley et al. 1990) and its destruction via astration. The evolution of the cosmic boron abundance therefore reflects the cosmic ray flux and/or supernova rate history in the Milky Way. Measurements of stellar boron abundances have revealed a trend of increasing B/H over time (as expected), from in very metal-poor halo stars (Edvardsson et al. 1994; Duncan et al. 1997) to the much higher Orion association (; Cunha et al. 1997) and solar system (meteoritic) abundances (; Anders & Grevesse 1989). Because there is evidence that the solar system may be enhanced in metals such as oxygen relative to the local interstellar medium (ISM; e.g., Meyer et al. 1998), young B stars (e.g., Gies & Lambert 1992; Kilian-Montenbruck et al. 1994) and H II regions (e.g., Peimbert, Torres-Peimbert, & Dufour 1993), it is unclear that the solar system B/H is the best fiducial point for the present-day boron abundance in studies of Galactic chemical evolution. The boron abundance of the present-day ISM may be more appropriate for such studies. The differences between the solar system and the ISM could yield important information on the recent chemical evolution of the solar neighborhood.
Here we present new high-resolution observations of interstellar B II and O I absorption towards the stars HD 104705, HD 121968, HD 177989, HD 218915, and HD 303308 taken with STIS on-board the Hubble Space Telescope (HST). We also present analyses of the B/O abundances along the Scorpii B and Ophiuchi sightlines using archival GHRS datasets. We have more than doubled the measurements of interstellar boron, and the available data now probe a wide range of diffuse ISM environments. After discussing our observations in §2, we will show in §3 that the present-day interstellar B/H ratio seems to be dominated by the incorporation of boron into dust grains. Thus the interstellar gas-phase boron abundance provides only a lower limit to the total (gas+dust) interstellar boron abundance.
2 Observations and Reductions
The STIS data used here were obtained as part of our STIS GO program (#7270), with the exception of the HD 303308 data, which were obtained from the STIS archive. In all cases the observations employed the far-ultraviolet MAMA detector and the E140H grating with the light from the star passing through the aperture. The resolution of these data is km s-1 (FWHM). The data were extracted and the backgrounds estimated as described by Howk & Sembach (2000). For spectral regions covered in multiple orders (or observations), we have coadded the flux-calibrated data and weighted the contribution of each individual spectrum by the inverse-square of its error vector.
The archival, post-COSTAR GHRS data used in this work were reduced as discussed by Howk, Savage, & Fabian (1999). The Sco B data were obtained through the large science aperture, while the Oph data were obtained through the small science aperture. Both datasets employed the Ech-A grating, yielding a resolution of km s-1 (FWHM).
Figure 1 shows the STIS spectra and Table 1 gives the measured equivalent widths, , for the new STIS and GHRS measurements. The continua were estimated using low-order Legendre polynomial fits to regions free of interstellar lines, and our error estimates include continuum placement uncertainties and the effects of 2% zero-point uncertainties for both spectrographs (Sembach & Savage 1992).
Federman et al. (1993) and Lambert et al. (1998) have studied the B II absorption along the Oph sightline using the GHRS with discrepant results. Federman et al. (1993) derive mÅ using the G160M grating, while Lambert et al. (1998) derive mÅ using the Ech-A grating. Given the differences in these studies, we have reanalyzed both GHRS datasets. We derive an equivalent width using the Ech-A of mÅ, within of the Lambert et al. result. We do not find clear evidence for B II absorption in the small science aperture G160M grating data to a limiting equivalent width of mÅ, consistent with our Ech-A results. However, the continuum placement uncertainties are large in this region of the spectrum when using the intermediate-resolution G160M grating. Alternative continuum placements could push this limiting equivalent width as high as 2.1 mÅ. We believe that the Ech-A results are the most reliable for this sightline and adopt mÅ for the B II absorption towards Oph.
The sightline towards Sco B also deserves comment. The sightline to this star passes through the stellar wind of the M1.5 Ib primary (Antares), which lies from the Sco B sightline (van der Hucht, Bernat, & Kondo 1980; Bernat 1982; Cardelli 1984). It is therefore possible that the absorption lines in the spectra of Sco B probe the wind of the primary star. We do not believe that the O I and B II absorption seen in the archival GHRS spectra are caused by the stellar wind. These species show two blends of material centered at and +3.5 km s-1. Material associated with the wind is centered near km s-1 (van der Hucht et al. 1980). The archival GHRS dataset contains good observations of lines that trace only the outflowing stellar wind, notably Ti II, Ti II∗, Ti II∗∗, and S I∗∗. These lines are clearly shifted with respect to the O I and B II absorption. They are centered near km s-1, often with wings extending towards more negative velocities. There is no evidence for wind material at the velocities of the O I and B II absorption. Therefore, we believe the absorption line measurements presented in Table 1 trace the ISM in this direction rather than the stellar wind of Antares.111We also note that the column density of O I derived below is comparable to that of other stars in this region of sky with similar distances (Meyer et al. 1998).
3 Results and Discussion
Table 2 gives the derived column densities of O I and B II for the stars listed in Table 1. Also given are the total hydrogen column densities and the normalized relative gas-phase abundances [B/O]222We define and assume a meteoritic abundance (Anders & Grevesse 1989). for these sightlines. We also compile all measurements of interstellar B II using HST data from the literature (with references given in the table).
The new O I and B II column densities were derived by integrating the apparent optical depth profiles (Savage & Sembach 1991) of each line. In a few cases we have deemed it necessary to apply moderate saturation corrections to the O I column densities. We have tested for saturation problems and derived the necessary corrections by applying a single-component curve of growth to the measured O I equivalent widths (Table 1), adopting -values derived from a curve-of-growth fit to several C I lines for each sightline. The O I absorption is dominated by narrow components that are also strong in species that trace dense clouds such as C I, S I, Cl I, and CO. While C I and O I need not be coexistent, the emperical association of C I and O I absorption, particularly in the components where the saturation is likely to be greatest, gives us confidence that C I saturation effects provide a suitable means for understanding the O I saturation along these sightlines. The O I apparent column densities we obtained for four of the sightlines from Table 1 required moderate saturation corrections of +0.06 to +0.08 dex based on the curve-of-growth fits, and these have been noted in Table 2.
Figure 2 shows the sightline-integrated gas-phase abundances [B/O] as a function of average line of sight hydrogen densities, 333Defined , where is the distance to the star from Table 2., for the 11 sightlines from Table 2. Where no H2 column density measurements exist we adopt a generous dex uncertainty in the total hydrogen column, , to account for the unknown contribution from molecular material. The bottom panel of Figure 2 shows [O/H] versus for the same sightlines. The dashed line shows the average value of [O/H]() from the sightlines studied by Meyer et al. (1998), several of which are included in this work.444We adopt the O I -value suggested by Morton (2000), which implies a dex correction to the O I column densities in Meyer et al. (1998).
Figure 2 shows a clear trend of decreasing [B/O] abundance with increasing . Such a trend is often observed for species incorporated into interstellar dust grains (cf., Jenkins 1987). The general decrease in gas-phase abundance with increasing reflects the mixture of cold and warm diffuse clouds along the line of sight (Jenkins, Savage, & Spitzer 1986), where the cold clouds exhibit a greater incorporation of elements into interstellar grains.
All of the STIS targets in Table 2 have distances pc, while the GHRS targets are all at pc. It is conceivable that the gas being probed by the STIS data is also significantly more distant than that being probed by the GHRS data. In this case, some of the behavior seen in Figure 2 could be caused by abundance gradients. There are several reasons to believe this is not the case. First, of the 11 stars in our sample (Table 2), 8 have galactocentric distances between 7.5 and 9.5 kpc, i.e., they lie within 1 kpc of the solar circle. Within this 2 kpc in galactocentric distance, the [B/O] abundance varies from to , i.e., the abundance varies by a factor of 5. Thus, most of the trend seen in Figure 2 occurs within 1 kpc galactocentric distance of the solar circle and cannot be caused by large-scale abundance gradients.
Second, there is evidence that the absorption along all of the sightlines actually arises within the first 1-2 kpc. Most of the absorption seen in Figure 1 is at velocities that are consistent with nearby material, and given that typical cloud-to-cloud velocity dispersions are of order km s-1 (Sembach & Danks 1994), most of the gas is likely very local. For example, although the extended STIS sightlines towards HD 177989 and HD 218915 pass over known spiral arms with prominent absorption in other species (e.g., Mg II, Mn II, Ni II, Cu II, and Ge II), there is no evidence for any absorption in the weak O I and B II lines from those distant structures. The nearest arms probed along these sightlines are the Perseus arm seen towards HD 218915 at a distance of kpc, and the Sagittarius arm towards HD 177989, which is likely at a distance of kpc. The Perseus and Sagittarius arms are seen seen in absorption in other species at km s-1 and km s-1 towards HD 218915 and HD 177989, respectively.
The relatively local origin of the gas towards HD 218915 may explain why it does not fit well the general trend with average sightline density seen in Figure 2 (point 4 in this figure). One would prefer to use a more physically-meaningful measure of physical conditions such as the fraction of hydrogen in molecular form, . Figure 3 shows the [B/O] abundances versus for those sightlines with measurements. This diagram is sparsely populated, but there seems to be a slight trend of increasing [B/O] abundance with decreasing . For this diagram to be truly useful, however, more measurements are needed. The Far Ultraviolet Spectroscopic Explorer will soon provide molecular hydrogen column densities for a large number of sightlines towards distant stars, making it possible to fill in the missing points in Figure 3.
The trend seen in Figure 2, and the fact that the more distant stars studied by STIS show higher [B/O] abundances, is likely caused by the heights of these stars above the plane of the Galaxy. Because the stars studied by STIS are more distant, they generally lie at larger distances from the Galactic plane than do the stars studied by the GHRS. Thus, the sightlines probed by our STIS measurements probe lower density regions, on average, than the sightlines probed by the GHRS measurements. The well-documented trend of higher gas-phase abundances of most elements in lower density regions suggests that we should expect the segregation of of STIS and GHRS measurements observed in Figure 2.
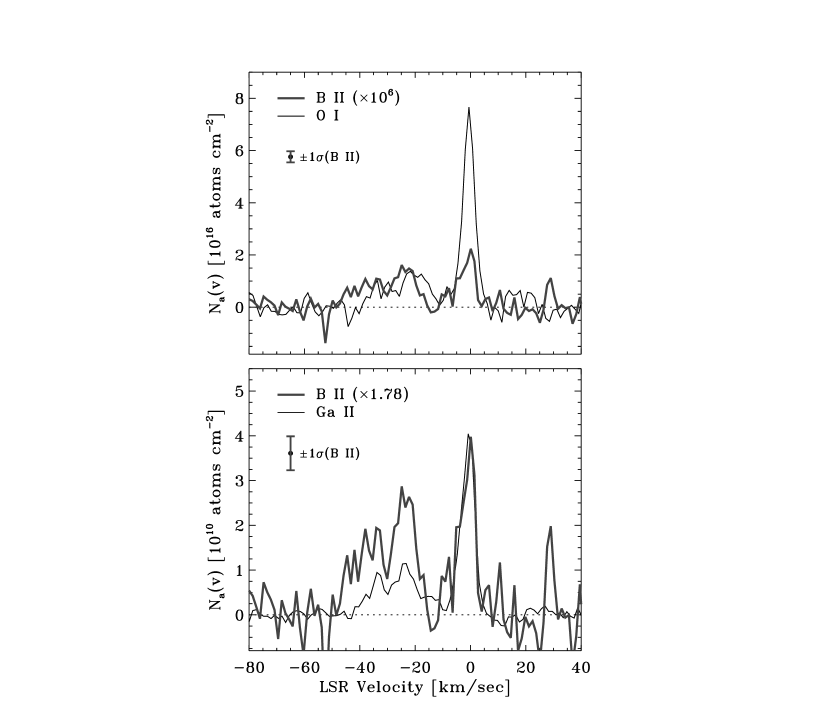
While the average sightline [B/O] values show a clear trend with , an imperfect measure of sightline properties, there is also evidence within the observed line profiles for variation of [B/O] with the physical properties of the absorbing material. Several of the sightlines displayed in Figure 1 show evidence for dense clouds with lower B/O ratios than warm clouds along the same line of sight, in qualitative agreement with the Jenkins et al. (1986) model of integrated sightline properties. Figure 4 shows the apparent column density (Savage & Sembach 1991), or , profile of B II towards HD 104705 with the corresponding profiles of O I and Ga II . This sightline exhibits a narrow, cold component centered at km s-1, which is prominent in species such as O I, S I, Cl I, and CO, as well as a blend of warmer components between and km s-1 (Sembach, Howk, & Savage 2000). Figure 4 shows that the B/O ratio changes between these two regions. The integrated abundances in these two components are significantly different: for the component centered at km s-1, and for the blend of warm components at negative velocities. This sightline exhibits variations in [B/O] that are coupled to real changes in the physical properties of the observed components.
The dependence of [B/O] on could potentially be caused by other effects, including true abundance variations (gas+dust) and differential ionization (e.g., Sembach et al. 2000). Boron may be particularly sensitive to the latter effect since its second ionization potential is high (25.15 eV, similar to that of C II). While the effects of differential ionization may modify the component-to-component B/O ratios, they are likely not large enough (perhaps dex) to cause the 0.8 dex range of [B/O] seen in Figure 2.
We believe the incorporation of boron into grains is dominant among the possible effects leading to the trend seen in Figure 2. It is reasonable to expect that boron should be incorporated into dust. It has a condensation temperature ( K; Zhai 1995; Lauretta & Lodders 1996) similar to those of gallium and copper and is in the same group of the periodic table as aluminum and gallium, all of which are known to be significantly incorporated into interstellar dust (Hobbs et al. 1993; Savage & Sembach 1996).
The cold cloud towards HD 104705 (Figure 4) shows a solar B/Ga ratio, though the blend of warm components exhibits super-solar B/Ga ratios. If the abundance variations between these regions are caused by the destruction of dust (see Savage & Sembach 1996), then boron is more readily-stripped from grains than is gallium.
The gas-phase abundance measurements of boron in Table 2 yield no firm information on the solid-phase abundance of boron. We derive a lower limit to the present-day total (gas+dust) interstellar boron abundance of (using the measured [B/O] towards HD 121968 and assuming from Meyer et al. 1998 corrected for the Morton 2000 O I -value). The interstellar B/H is lower than the meteoritic abundances (; Anders & Grevesse 1989) and non-LTE abundances for stars of solar-like metallicity (; see discussion in Lambert et al. 1998).
The probable incorporation of boron into interstellar dust makes it difficult to use the measured gas-phase interstellar boron abundance to study the influence of spallation on the chemical evolution of the light elements. Another probe of spallation-induced chemical evolution is the 11B/10B isotope ratio (cf., Lambert et al. 1998), and some of the sightlines presented here might allow accurate measurements of this ratio with higher resolution or signal to noise. In fact, the sightline towards HD 104705 seems to show a high 11B/10B ratio; the red wing of B II profile is very similar to that of the Ga II profile. However, the relative component structure seen in the profiles of B II towards HD 104705, HD 177989, and HD 218915 are significantly different than all of the other ionic species covered by our observations, including Ga II, Cu II, and Ge II. The depletion and/or ionization characteristics of B II are disimilar to these species, perhaps making it inappropriate to use them as templates for B II when studying the 11B/10B ratio along complicated sightlines.
4 Summary
We have presented new and archival observations of the gas-phase abundance of boron in the diffuse interstellar medium using STIS and GHRS. From our analysis of these high-quality absorption line data, and measurements from the literature, we have concluded the following.
-
1.
The gas-phase abundance of [B/O] in the ISM is anticorrelated with the average density of hydrogen along the sightline being probed, as well as the fraction of hydrogen seen in molecular form along a sightline. Along individual sightlines, we also find a significantly higher gas-phase [B/O] abundance in warm than in cold diffuse clouds. The evidence strongly suggests that boron is incorporated into dust grains in the diffuse ISM.
-
2.
The relative component-to-component strengths in the observed B II profiles are significantly different than those of any other observed species, including Ga II, Cu II, and Ge II. The depletion and/or ionization characteristics of B II are different than those of other species. Although Ga II, Cu II, and Ge II are sometimes used as templates for modeling the B II absorption, the differences seen in our data suggest it may be inappropriate to assume they trace the B II profile when deriving the 11B/10B ratio along complicated sightlines.
-
3.
We derive a lower limit to the present-day total (gas+dust) B/H abundance of .
References
- (1)
- (2) Anders, E., & Grevesse, N. 1989, Geochem. Cosmochem. Acta, 53, 197
- (3)
- (4) Bernat, A.P. 1982, ApJ, 252, 644
- (5)
- (6) Bohlin, R.C., Savage, B.D., & Drake, J.F. 1978, ApJ, 224, 132
- (7)
- (8) Cardelli, J.A., 1984, AJ, 89, 1825
- (9)
- (10) Cunha, K., Lambert, D.L., Lemke, M., Gies, D.R., Roberts, L.C. 1997, ApJ, 478, 211
- (11)
- (12) Diplas, A., & Savage, B.D. 1994, ApJS, 93, 211
- (13)
- (14) Duncan, D.K., et al. 1997, ApJ, 488, 338
- (15)
- (16) Edvardsson, B., Gustafsson, B., Johansson, S.G., Kiselman, D., Lambert, D.L., Nissen, P.E., & Gilmore, G. 1994, A&A, 290, 176
- (17)
- (18) Federman, S.R., Lambert, D.L., Cardelli, J.A., & Sheffer, Y. 1996, Nature, 381, 764
- (19)
- (20) Gies, D.R., & Lambert, D.L. 1992, ApJ, 387, 673
- (21)
- (22) Hobbs, L.M., Welty, D.E., Morton, D.C., Spitzer, L., & York, D.G. 1993, ApJ, 411, 750
- (23)
- (24) Howk, J.C., Savage, B.D., & Fabian, D. 1999, ApJ, 525, 253
- (25)
- (26) Howk, J.C., & Sembach, K.R. 2000, AJ, in press (astro-ph/9912388)
- (27)
- (28) Jenkins, E.B. 1987, in Interstellar Processes, ed. D.J. Hollenbach & H.A. Thronson, Jr. (Dordrecht: Reidel), p. 533.
- (29)
- (30) Jenkins, E.B., Savage, B.D., & Spitzer, L. 1986, ApJ, 301, 355
- (31)
- (32) Jura, M., Meyer, D.M., Hawkins, I., & Cardelli, J.A. 1996, ApJ, 456, 598
- (33)
- (34) Kilian-Montenbruck, J., Gehren, T., & Nissen, P.E. 1994, A&A, 291, 757
- (35)
- (36) Lambert, D.L., Sheffer, Y., Federman, S.R., Cardelli, J.A., Sofia, U.J., & Knauth, D.C. 1998, ApJ, 494, 614
- (37)
- (38) Lauretta, D.S., & Lodders, K. 1996, Meteorit. Planet Sci., 31 (suppl.), A77
- (39)
- (40) Meneguzzi, M., Audouze, J., & Reeves, H. 1971, A&A, 15, 337
- (41)
- (42) Meyer, D.M., Jura, M., & Cardelli, J.A. 1998, ApJ, 493, 222
- (43)
- (44) Morton, D.C. 2000, ApJS, in preparation
- (45)
- (46) Pagel, B.E.J. 1997, Nucleosynthesis and Chemical Evolution of Galaxies, (Cambridge: University Press)
- (47)
- (48) Peimbert, M., Torres-Peimbert, S., & Dufour, R.J. 1993, ApJ, 413, 242
- (49)
- (50) Perryman, M.A.C. et al. 1997, A&A, 323, 49
- (51)
- (52) Reeves, H., Fowler, W.A., & Hoyle, F. 1970, Nature, 226, 727
- (53)
- (54) Savage, B.D., Bohlin, R.C., Drake, J.F., & Budich, W. 1977, ApJ, 216, 291
- (55)
- (56) Savage, B.D., Cardelli, J. A., & Sofia, U. J. 1992, ApJ, 401, 706
- (57)
- (58) Savage, B.D., & Sembach, K.R. 1991, ApJ, 379, 245
- (59)
- (60) Savage, B.D., & Sembach, K.R. 1996, ARA&A, 34, 279
- (61)
- (62) Sembach, K.R., & Danks, A.C. 1994, A&A, 289, 539
- (63)
- (64) Sembach, K.R., & Savage, B.D. 1992, ApJS, 83, 147
- (65)
- (66) Sembach, K.R., Howk, J.C., Ryans, R.S.I., Keenan, F.P. 2000, ApJ, 528, 310
- (67)
- (68) Sembach, K.R., Howk, J.C., & Savage, B.D. 2000, in preparation.
- (69)
- (70) van der Hucht, K.A., Bernat, A.P., & Kondo, Y. 1980, A&A, 82, 14
- (71)
- (72) Woosley, S.E., Hartmann, D.H., Hoffman, R.D., & Haxton, W.C. 1990, ApJ, 356, 272
- (73)
- (74) Zhai, M. 1995, Meteoritics, 29, 607
- (75)
| [mÅ]aaMeasured equivalent width and uncertainties (in mÅ). | ||||
|---|---|---|---|---|
| Star | O I | B II | bbThe range in over which the absorption profiles were integrated. | S/NccEmpirically estimated signal-to-noise ratios for continuum regions near the O I and B II absorption lines, respectively. |
| STIS | ||||
| HD 104705 | 80, 60 | |||
| HD 121968 | 55, 50 | |||
| HD 177989 | 70, 65 | |||
| HD 218915 | 60, 70 | |||
| HD 303308 | 45, 40 | |||
| GHRS | ||||
| Sco B | 35, 35 | |||
| Oph | ddThe O I measurement for Oph is from Savage, Cardelli, & Sofia (1992) and represents the sum of their components A and B. | 56, 370 | ||
| Star | IDaaIdentification number designating the observed stars in Figure 2. | bbGalactic coordinates for the observed stars. | [pc]ccDistances to the observed stars. Where available we have used Hipparcos (Perryman et al. 1998) distances (those distances with error bars). Otherwise we have adopted the distances from Diplas & Savage (1994). | ddLogarithmic column densities and error estimates (in units atoms cm-2) for O I and B II derived by integrating the apparent column density profiles. We adopt oscillator strengths from Morton (2000): and . | ddLogarithmic column densities and error estimates (in units atoms cm-2) for O I and B II derived by integrating the apparent column density profiles. We adopt oscillator strengths from Morton (2000): and . | eeTotal logarithmic hydrogen column density . For many sightlines no H2 column densities are available, and we have adopted H I column densities from Diplas & Savage (1994) with an upper error bar of +0.25 dex. All other measurements are a weighted mean of the Bohlin et al. (1978) and Diplas & Savage (1994) H I column densities combined with the Savage et al. (1977) H2 column densities. | [B/O]ffRelative logarithmic abundance of boron to oxygen, referenced to the relative solar system values such that , where (Anders & Grevesse 1989). | Ref.ggReferences for O I and B II column densities: (1) This work; (2) Savage et al. 1992; (3) Meyer et al. 1998; (4) Lambert et al. 1998; (5) Jura et al. 1996. |
|---|---|---|---|---|---|---|---|---|
| HD 104705 | 1 | 3900 | 1 | |||||
| HD 121968 | 2 | 3600 | 1 | |||||
| HD 177989 | 3 | 4900 | hhSmall saturation corrections have been made to the original apparent column densities based upon the C I curve of growth for each sightline. The applied corrections are (in dex) +0.06, +0.06, +0.06, and +0.08 for HD 177989, HD 218915, HD 303308, and Sco B, respectively. | 1 | ||||
| HD 218915 | 4 | 3600 | hhSmall saturation corrections have been made to the original apparent column densities based upon the C I curve of growth for each sightline. The applied corrections are (in dex) +0.06, +0.06, +0.06, and +0.08 for HD 177989, HD 218915, HD 303308, and Sco B, respectively. | 1 | ||||
| HD 303308 | 5 | 2600 | hhSmall saturation corrections have been made to the original apparent column densities based upon the C I curve of growth for each sightline. The applied corrections are (in dex) +0.06, +0.06, +0.06, and +0.08 for HD 177989, HD 218915, HD 303308, and Sco B, respectively. | 1 | ||||
| Oph | 6 | 140 | 1,2 | |||||
| Sco B | 7 | 158 | hhSmall saturation corrections have been made to the original apparent column densities based upon the C I curve of growth for each sightline. The applied corrections are (in dex) +0.06, +0.06, +0.06, and +0.08 for HD 177989, HD 218915, HD 303308, and Sco B, respectively. | 1 | ||||
| Sco | 8 | 123 | iiThe O I column density for the Sco sightline is derived from Copernicus observations of the 1355 Å transition (see Meyer et al. 1998). | 3,4 | ||||
| Ori | 9 | 220 | 3,4 | |||||
| Ori | 10 | 320 | 3,5 | |||||
| Ori | 11 | 410 | 3,5 |