Exploring the high frequency emission of radio loud X-ray binaries
Abstract
We report millimetre-wave continuum observations of the X-ray binaries Cygnus X-3, SS 433, LSI+61∘303, Cygnus X-1 and GRS 1915+105. The observations were carried out with the IRAM 30 m-antenna at 250 GHz (1.25 mm) from 1998 March 14 to March 20. These millimetre measurements are complemented with centimetre observations from the Ryle Telescope, at 15 GHz (2.0 cm), and from the Green Bank Interferometer at 2.25 and 8.3 GHz (13 and 3.6 cm). Both Cygnus X-3 and SS 433 underwent moderate flaring events during our observations, whose main spectral evolution properties are described and interpreted. A significant spectral steepening was observed in both sources during the flare decay, that is likely to be caused by adiabatic expansion, inverse Compton and synchrotron losses. Finally, we also report 250 GHz upper limits for three additional undetected X-ray binary stars: LSI+65$^∘$010, LSI+61$^∘$235 and X Per.
Key Words.:
Stars: Radio continuum: stars – Stars: individual: Cygnus X-3, Cygnus X-1, SS 433, GRS 1915+105, LSI+61∘3031 Introduction
An interesting group of X-ray binary systems in our Galaxy are known to be powerful and efficient sources of radio waves. The number of radio emitting X-ray binaries (REXRBs) detected so far is about 10 of the total 200 systems catalogued (Hjellming & Han 1995). Although far from representing a numerous population, their remarkable properties and scaled down similarity with extragalactic AGNs and quasars makes them to deserve a careful study based on multi-wavelength monitoring programs.
Radio emission in REXRBs is normally highly variable and of non-thermal synchrotron origin. Radio outbursts with different amplitude are frequently detected and interpreted as synchrotron radiation due to the ejection and expansion of ionized plasma clouds (plasmons), usually following a super Eddington accretion event. Recent multi-wavelength monitoring of radio outbursts from the microquasar system GRS 1915+105 (Fender et al. 1997a; Mirabel et al. 1998) have revealed that the flaring synchrotron emission extends well beyond the centimetric domain, reaching up to infrared wavelengths. The energetic implications of this fact are considerable (Mirabel et al. 1998), and it would be important to investigate if similar behaviour is observed in other REXRBs. In an attempt to better assess this issue, we undertook a daily monitoring campaign in the mm domain for some well known objects in the REXRB class. Our main goal here was to study the variability and spectral index properties of selected sources in a wide frequency range. Whenever possible, we have taken advantatge from the availability of daily monitorings in the cm domain, thanks to the Ryle Telescope and to the Green Bank Interferometer. This allowed us to estimate the source spectral indices between radio frequencies separated by two orders of magnitude.
The targets for the observing program were chosen among the brightest REXRBs with luminous massive companions and declination . They include: Cygnus X-3, SS 433, LSI+61∘303, Cygnus X-1 and GRS 1915+105. A summary of their main physical properties is condensed in Table 1. Previous cm observations for all of them are abundant in the literature, and a few mm detections have been reported as well. Nevertheless, no extended and truly simultaneous cm/mm monitoring has been systematically carried out to our knowledge. The present work is an exploratory step in this direction.
| Source | Classification | cm-Flux density (Jy) | mm-Flux density (Jy) | Periods | Remarks |
|---|---|---|---|---|---|
| Quiescent Outburst | Quiescent Outburst | ||||
| Cygnus X-3 | W-R+? | 0.05 20 | 0.05 3 | 4.8 h (orbital) | jets |
| Cygnus X-1 | O9.7Iab+BH | 0.015 0.040 | 0.010 | 5.6 d (orbital) | |
| GRS 1915+105 | Be?+BH | 0.01 1 | 0.015 | superluminal jets | |
| LSI+61∘303 | Be+NS? | 0.03 0.5 | 0.01 | 26.5 d (orb.), 4 yr ? | radio and X-ray period |
| SS 433 | OB?+? | 0.5 10 | 0.12 | 13 d (orb.), 164 d | precessing jets |
| Source | Date | Number of | Flux density |
|---|---|---|---|
| (1998 March) | subscans | (mJy) | |
| Cygnus X-3 | 14.532 | 60 | |
| 14.555 | 19 | ||
| 15.531 | 124 | ||
| 16.555 | 84 | ||
| 18.569 | 60 | ||
| 19.571 | 93 | ||
| 20.558 | 60 | ||
| Cygnus X-1 | 14.530 | 120 | 9 |
| 15.555 | 100 | 17 | |
| 16.537 | 100 | 12 | |
| 18.583 | 100 | 18 | |
| 19.587 | 50 | 24 | |
| 20.575 | 102 | 21 | |
| GRS 1915+105 | 15.510 | 29 | 27 |
| 16.508 | 126 | 12 | |
| 18.543 | 100 | 37 | |
| 19.543 | 32 | 47 | |
| 20.519 | 61 | 23 | |
| LSI+61∘303 | 14.500 | 60 | 12 |
| 14.715 | 224 | ||
| 15.591 | 140 | ||
| 16.588 | 107 | 12 | |
| 17.705 | 300 | 6 | |
| 18.610 | 100 | 15 | |
| 19.612 | 90 | 12 | |
| 20.610 | 160 | 11 | |
| SS 433 | 15.497 | 24 | |
| 16.491 | 50 | ||
| 18.525 | 100 | ||
| 19.525 | 100 | ||
| 20.508 | 28 |
2 Observations
The observations of the REXRBs listed in Table 1 were carried out, during the interval 1998 March 14 to March 20, using the following astronomical facilities:
2.1 IRAM 30 m-telescope
Observing sessions were conducted at the 30 m telescope of the Institut de Radio Astronomie Millimétrique (IRAM) in Pico Veleta (Spain). The backend installed was the Max Planck Institut für Radioastronomie (MPIfR) 39 channel bolometer array, operating at the 250 GHz frequency (1.25 mm). The technical details of this instrument and those of the 30 m telescope are described by Wild (1995) and Kramer et al. (1998). Each daily session was started with a skydip, pointing and focus sequence. Such sequence was repeated every hour minimum and very often before a new target source. In this way, we were able to ensure an continuous monitoring on the atmospheric opacity, pointing offsets and focusing parameters of the telescope. The method used to determine the pointing corrections was by cross-scanning on a bright calibrator as close as possible to the target source. For the program sources, the ON-OFF technique was preferred in order to obtain higher sensitivity. The ON-OFF procedure should also help to remove possible background extended emission around some of our sources, specially in the case of SS 433 and its associated radio nebula W50. A typical target observation consisted of several tens of symmetric ON-OFFs subscans, during which the antenna beam was nutated on and off the source by 46 at a sampling rate of 0.5 s. The duration of each subscan was 10 s. The resulting count rate, for a given source, is taken as the weighted average of all these individual subscans. Source counts were finally converted to flux density using planets as calibrators.
The data reduction was all carried out with the New Imaging Concept (NIC) package, available at the telescope site and originally written at the MPIfR and IRAM. The NIC tasks include spike removal, bad subscan flagging, gain channel and elevation corrections, and correlated channel noise subtraction.
2.2 Ryle Telescope
The Ryle Telescope at the Mullard Radio Astronomy Observatory (MRAO) was used to monitor the daily flux variations of four sources in our list: Cygnus X-3, Cygnus X-1, GRS 1915+105 and LSI+61∘303. The Ryle Telescope operates at the frequency of 15 GHz (2.0 cm). Details of the observing procedure are given in Pooley & Fender (1997). The data reported here were measured with linearly-polarized feed-horns and represent the Stokes parameters .
2.3 Green Bank Interferometer
The public data from the Green Bank Interferometer111 The GBI is a facility of the USA National Science Foundation operated by the NRAO in support of NASA High Energy Astrophysics programs. (GBI) were also retrieved to complete our study. The GBI consists of two 26 m antennas on a 2.4 km baseline observing simultaneously at 2.25 and 8.3 GHz (13 and 3.6 cm). The data taken are made available to the public immediately. All our targets are included among the radio sources routinely monitored by the GBI. Some of them are also observed more than five times daily. Typical errors in GBI data are 4 mJy at 2.25 GHz and 6 mJy at 8.3 GHz for fluxes less than 100 mJy. For fluxes of about 1 Jy (as in SS433), the errors at 2.25 and 8.3 GHz are 15 and 50 mJy respectively. In order to better compare the GBI light curves with those obtained at other instruments, the GBI observations were averaged on a daily basis.

3 Results
The summary of our main results, those obtained with the IRAM 30 m-telescope at 250 GHz (1.25 mm), is presented in Table 2. First column lists the star name; the second one indicates the date of the observation and the third column lists the number of subscans performed. Finally, fourth column gives the measured flux density and its error. The error quoted is based on the standard deviation for the estimated flux density. For the cases where the radio star has not been detected, an upper limit of three times the rms noise is given. Among the sources listed in Table 1, the only ones that we could never detect at 250 GHz were Cygnus X-1 and GRS 1915+105. In the cm domain, all targets were found to be detectable with the Ryle and GBI facilities. The cm flux density levels appeared mostly consistent with expectations based on the available literature.
The light curves for Cygnus X-3, SS 433 and LSI+61∘303 provided several positive mm detections and we additionally plot them in Figs. 1, 3 and 4. These figures also include panels with selected radio spectra from cm to mm wavelengths. They have been computed by interpolating (when possible) the daily Ryle and GBI monitorings at the times of the corresponding IRAM observations. When discussing this spectral information, the spectral index will be defined as , where is the flux density and the frequency.
3.1 Cygnus X-3

This system is currently regarded as a Wolf-Rayet star plus a compact object (van Kerkwijk et al. 1992; Fender et al. 1999a). The orbital cycle is assumed to be 4.8 h based on the strong modulation observed with this period, specially in the X-ray domain (Parsignault et al. 1972). This modulation has been also reported at infrared (Becklin et al. 1973) and radio wavelengths (Molnar 1985). Cygnus X-3 is well known for its strong radio flares reaching cm and mm peak flux densities of several Jy (Gregory et al. 1972 and references therein; Nesterov 1992), that may be interpreted in terms of collimated ejection events (e.g. Martí et al. 1992). Waltman et al. (1994) have shown that Cygnus X-3 exhibits periods of normal quiescent emission, varying on time scales of months from 60 to 140 mJy. The average emission level is often around 80 mJy and 90 mJy at 2.25 GHz and 8.3 GHz, respectively. From the GBI data presented in Fig. 1, it is clear that Cygnus X-3 was in a quiescent state during our observations with only minor flaring events taking place.
At mm wavelengths, only five observations have been published in the past. The first two were carried out during a strong flaring period in the radio (Pompherey & Epstein 1972; Baars et al. 1986). Fender et al. (1995) and Tsutsumi et al. (1996) do detect the Cygnus X-3 quiescent radio emission at mm wavelengths using the JCMT. A low level flare peaking at 263 mJy was detected by Altenhoff et al. (1994) with the IRAM 30 m-telescope at 250 GHz. Finally, there is also a sub-mm detection of Cygnus X-3 by Fender et al. (1997b).
The data in this paper, that extend over nearly one week, confirm that Cygnus X-3 is continuously active at 250 GHz even during quiescent emission periods. The peak frequency of the spectrum is most likely to be between 8.3 and 15 GHz most of the time, as for example on 1998 March 16. Although sparsely sampled, our IRAM flux densities are suggestive of a possible mm flare around 1998 March 18.
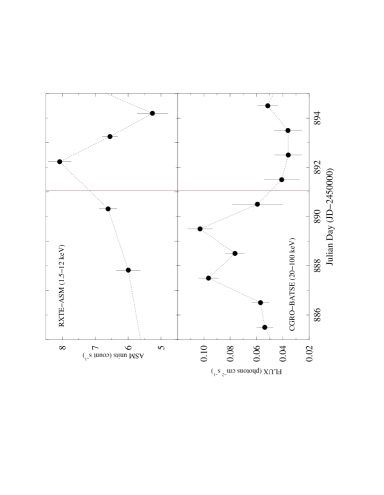
The occurrence of this minor flaring event is also supported from the hard X-ray (HXR) and soft X-ray (SXR) behaviour of Cygnus X-3 as recorded by the BATSE (20-100 keV) and ASM (1.5-12 keV) instruments on board the CGRO and RXTE satellites, respectively. The HXRs are known to be anticorrelated with quiescent and low level flaring emission in the radio (McCollough et al. 1997). HXRs are also generally anticorrelated with the SXRs. The top panel in Fig. 2 represents the one day average from a number of individual ASM dwells. There are typically 10 dwells of s each per day, that provide an acceptable sampling of the 4.8 h orbital modulation. Therefore, the ASM daily averages may be considered as representative of the unmodulated level of emission. Similarly, the bottom panel in this figure contains the daily averaged HXR data reported by BATSE. We notice here that the HRX flux dropped significantly in coincidence with our bright mm detection, as expected when a low level radio flare occurs.
The 1.25 mm emission on 1998 March 18 was higher than average by a factor of 3. This apparent flaring increase seems to have induced an important evolution in the Cygnus X-3 spectrum. Its main stages are sketched in Fig. 1. We can see here how the high frequency end of the spectrum experiences significative changes. The 8.3-250 GHz spectral index evolves from during the first three days (March 14-16) to a nearly flat value during the mm ‘maximum’ (March 18), and back to the original negative value after its decay. Unfortunately, the 2 d gap in the Ryle monitoring prevents us from interpolating a reliable 15 GHz measurement at the time of the mm ‘maximum’, that could provide a better view of this event.
At low frequencies, the spectrum remains always optically thick with the 2.25-8.3 GHz spectral index being . The slower evolution and consequent overlapping of flaring events at optically thick frequencies causes the mm flare to be barely evident in the GBI curves.
3.2 SS 433
SS 433 is well known to exhibit highly collimated jets flowing out at and precessing every 164 days (e.g. Hjellming & Johnston 1981). The accepted interpretation of the observed sub-arcsecond radio structure assumes that, during the SS 433 radio outbursts, twin plasmons or “bullets”, containing relativistic plasma, are ejected from a central unresolved core into the jet opposite directions (Vermeulen et al. 1987). The source cm emission is consistent with non-thermal synchrotron radiation with optically thin properties. This can be seen clearly in the 2 yr GBI radio flux history (see e.g. Fender et al. 1997c). At mm wavelengths, a steep optically thin spectrum has been also reported (Band & Gordon 1989; Tsutsumi et al. 1996).
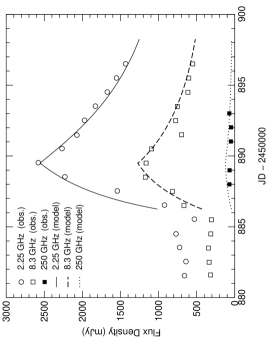
At the time of our observations, it is evident from the left panel in Fig. 3 that SS 433 was undergoing one of its outburst events at cm wavelengths. The onset time can be estimated around JD 2450885.5 (1998 March 13), peaking 4 d later in the GBI data. At mm wavelengths, our sampling is unfortunately not very good. Nevertheless, it is likely that the 250 GHz peak took place between JD 2450888-889. The mm flux density on these dates appears to be higher than in the following days, when the outburst decay is already in progress according to GBI.
It is known that SS 433 always exhibits an important optically thin quiescent emission of non-thermal synchrotron origin. According to Seaquist et al. (1982), it can be estimated on average as Jy GHz. From the GBI data during the d long period of quiescence, prior to the outburst event, we derive the similar power law Jy GHz.
In order to better appreciate the spectral evolution of SS 433 during the outburst, we have subtracted this quiescent component from all spectra in the right panel of Fig. 3 and, hereafter, only the flaring emission will be considered. The three representative epochs shown correspond to the outburst decaying part, on JD 2450889, 891 and 892 (March 16, 18 and 19, respectively). For each of these epochs, we plot two estimates of the intrinsic flaring spectrum. They correspond to the use of the Seaquist et al. (1982) and the contemporaneous GBI quiescent spectra, respectively. The difference between both estimates is indicative of the uncertainty involved in the subtraction process. This problem is only important at the IRAM frequency. Probably, the most reliable subtraction is the one involving contemporaneous GBI data.
The results obtained are suggestive that the synchrotron flaring spectrum of SS 433 extends up to the mm regime throughout the full radio outburst. In addition we also find possible evidence of spectral steepening during the outburst decay, at least concerning the GBI frequencies. The spectral index between 2.25 and 8.3 GHz varied from (March 16) to (March 19). This result does not depend very much on which quiescent spectrum is subtracted. On the other hand, the evolution of the spectral index between 8.3 and 250 GHz also seems to indicate a steepening evolution. Unfortunately, the errors in the subtraction at 250 GHz prevent us from being very certain about it.
3.3 LSI+61∘303
This object is a Be REXRB with periodic and strong outburst events in the radio every 26.5 d. This recurrence is assumed to reflect the system orbital period and was discovered by Taylor & Gregory (1982). LSI+61∘303 is thus the only selected stars where the onset of radio outbursts can be predicted (see e.g. Paredes et al. 1990).
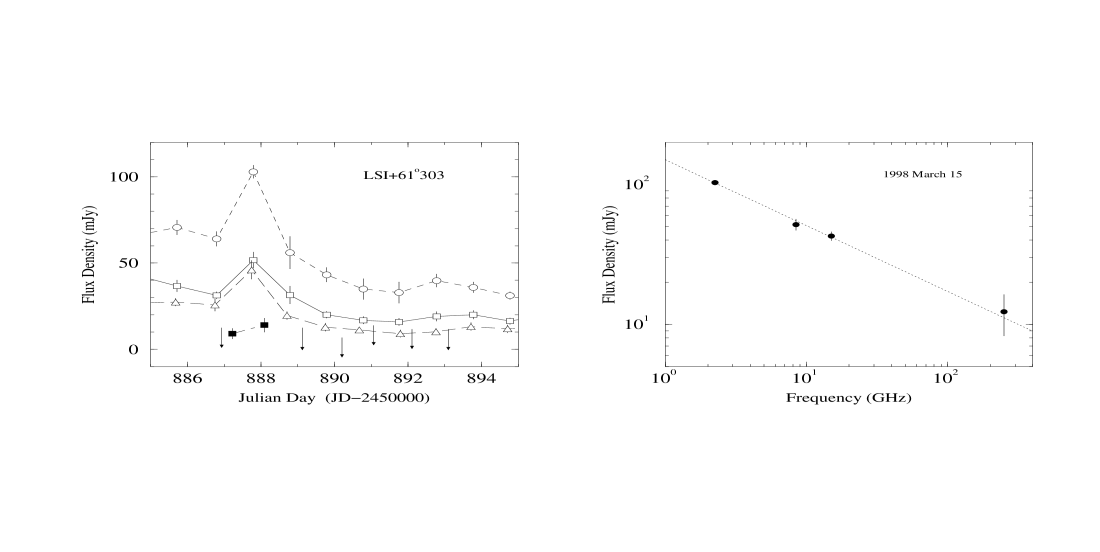
In the millimetre region, two previous LSI+61∘303 observations are available in the literature. Altenhoff et al. (1994) observed this star at 250 GHz but they did not detect it. Considering their sensitivity, this can be possibly understood because their observation did not coincide with an outburst episode. On the contrary, Tsutsumi et al. (1996) do detected LSI+61∘303 at 230 GHz at a flux density level of 10 mJy. This occurred on two consecutive days close to the expected outburst phases, when the source was reported to peak at mJy at cm wavelengths.
In view of these facts, our observing runs were specially scheduled in coincidence with one of LSI+61∘303 periodic radio outbursts. As it can be seen in the Fig. 4 left panel, the expected flaring event actually took place at cm wavelengths according to the GBI monitoring. Its amplitude and duration were, however, lower than expected. Variations in the outburst shape from cycle to cycle are in fact not unusual, as shown by the extended GBI light curves (see e.g. Ray et al. 1997). In our IRAM measurements, we managed to detect the source at 1.25 mm on two consecutive days that happen to be in close coincidence with the radio outburst peak. The right panel in Fig. 4 shows that, at this time (1998 March 15), the synchrotron spectrum of LSI+61∘303 extended from cm to mm wavelengths over two frequency decades. A least square fit gives mJy as the best power law representing the data.
During the decay, no mm observation of LSI+61∘303 resulted in a positive detection and only upper limit estimates are available (see Table 2). All these upper limits are consistent with the extrapolation of the observed 2.25-8.3 GHz spectral indices in the corresponding GBI data (). For example, at the times of lowest GBI emission, the expected 250 GHz flux density should be mJy. This value is below our sensitivity.
3.4 Cygnus X-1
The cm radio emission of this massive REXRB, and classical black hole candidate, is usually persistent at the 15 mJy level. Its spectral index is usually flat and some radio outbursts, reaching up to 30-40 mJy, have been occasionally witnessed (Hjellming 1973; Martí et al. 1996). Radio variations at the binary period (5.6 d) and at a longer period (150 d) have been reported (Pooley et al. 1999). The only mm detection so far published is the value of 103 mJy given by Altenhoff et al. (1994), suggesting that the generally flat radio spectrum extends into the mm regime. This suspicion has been recently confirmed by Fender et al. (1999b), who found no evidence for a high frequency cut-off up to 220 GHz.
During our monitoring, the centimetric radio emission of Cygnus X-1 behaved in the expected way, i.e., GBI flux densities in the range -20 mJy with a flat spectral index being observed. In contrast, very little can be said at 250 GHz. The source remained below our IRAM detection limits throughout all our observations.
3.5 GRS 1915+105
This is one of the two superluminal jet sources in the Galaxy as discovered by Mirabel & Rodríguez (1994). The system has been proposed to be a high mass X-ray binary (Mirabel et al. 1997). Its radio emission displays highly active episodes, lasting several months during which multiple and strong ( Jy) radio outbursts have been reported. During one of these events, a 234 GHz flux density of 123 mJy was observed with the IRAM 30 m telescope (Rodríguez et al. 1995). As in SS 433, the GRS 1915+105 flaring episodes correspond to the ejection of twin plasmons, at relativistic speeds, sometimes producing apparent superluminal motion on the sky. The most recent sequence of superluminal motion in GRS 1915+105 has been obtained by Fender et al. (1999c) with unprecedented resolution.
We monitored GRS 1915+105 on five different days at 250 GHz. The level of activity indicated by the GBI and Ryle monitoring was relatively weak, i.e., a few tens of mJy. Consistent with this state, no positive 250 GHz detection was achieved in a reliable way.
3.6 Other X-ray binaries
On 1998 March 17, most of our program sources were not in good elevation conditions during the scheduled time. Therefore, we devoted part of our run to try to detect three additional X-ray binaries at 250 GHz: the stars LSI+65∘010, LSI+61∘235 and X Per.
We observed the first star, LSI+65∘010, for a total of 37 subscans around 18.5h UT. No positive detection was achieved, with our upper limit estimate being 17 mJy. Previous attempts to detect this system at cm wavelengths have failed as well. Nelson & Spencer (1988) used the Jodrell Bank Lovell-MkII interferometer at 5 GHz to provide upper limits of 1.2 mJy and 3.7 mJy in 1986 and 1987, respectively. Our group has also carried out cm observations of LSI+65∘010 with the VLA interferometer of NRAO222The National Radio Astronomy Observatory is a facility of the USA National Science Foundation operated under cooperative agreement by Associated Universities, Inc. on two consecutive dates, 1993 March 9 and 10. The 20 cm wavelength was used with the array being in its B configuration. A flux density upper limit of 0.34 mJy was obtained after concatenating all the visibility data.
The second star, LSI+61∘235, was observed for a total number of 80 subscans around 18.8h UT. Again, no positive detection occurred. The 250 GHz upper limit in this case is 11 mJy. At the 20 cm wavelength, a mJy upper limit is also available for LSI+61∘235 from the same VLA runs mentioned above. Finally, X Per appeared to be below our detection limits as well when observed with the IRAM antenna at 18.1h UT. The number of subscans devoted to it was 60 and the resulting upper limit 15 mJy.
4 Discussion
4.1 How extended is the synchrotron spectrum in REXRBs?
We have already mentioned that non-thermal radio emission in REXRBs is attributed to the ejection of ionized plasmons containing relativistic electrons. These particles generate synchrotron emission due to the plasmon magnetic field acting on them. In this scenario, the changes in the radio spectrum are actually reflecting those occurring in the electron energy distribution. The energy spectra of the electrons is often well represented by a truncated power law (). At any time, the synchrotron emission will extend up to a break frequency corresponding approximately to the critical frequency of electrons with the highest energy available. In c.g.s. units:
| (1) |
Based on the data of this paper, the fact that both Cygnus X-3 and SS 433 are persistently detected at 1.25 mm implies for these sources that GHz most of the time. Consequently, relativistic electrons need to be accelerated up to energies of erg, equivalent to gamma factors of , to account for the observed high frequency emission. Estimates of the magnetic field in REXRB plasmons come mainly from equipartition arguments, electron age considerations and theoretical fits to light curves during radio outbursts. The resulting values are mostly in the range - G (see e.g. Martí et al. 1992; Martí 1993; Mirabel et al. 1998; Ogley et al. 1998). Adopting G as a representative estimate, the maximum gamma factor of the electrons is typically expected to be higher than . These order of magnitude considerations are also valid for LSI+61∘303 and possibly other REXRBs when in outburst.
4.2 Interpreting the spectral steepening in Cygnus X-3 and SS 433
In both Cygnus X-3 and SS 433, we have witnessed episodes of spectral steepening during the decaying part of flaring events. As explained below, we interpret this behavior in terms of the energy distribution of the relativistic electrons evolving in time during a flaring event. Of course we cannot rule out that other effects may be work, although the proposed explanation appears to be reproduce this kind of behavior.
| Initial radius | cm |
|---|---|
| Expansion velocity | 1650 km s-1 |
| Initial magnetic field | 1.8 G |
| Injection time interval | 3.5 d |
| Electron power law index | 2.3 |
| Electron injection rate | d-1 |
| Energy limits | and |
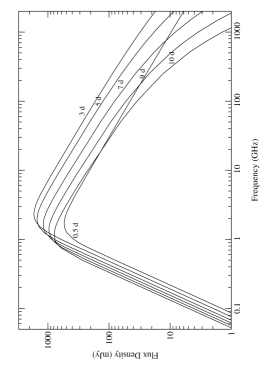
Our interpretation is as follows. Since the electrons are undergoing energetic losses of different kind (expansion losses, synchrotron radiation, inverse Compton scattering, etc.), the distribution will be shifted towards lower energies. The values of , and consequently that of will be decreasing functions of time. A progressive steepening of the radio spectrum is thus expected as the outburst evolves and decays. Theoretical modeling of plasmon evolution, within spherical and jet geometries, has been addressed among others by Paredes et al. (1991), Martí et al. (1992) and Peracaula (1997). When these models are used to compute multi-epoch spectra, we are able to reproduce a clear steepening behavior in strong resemblance to what is observed.
The plots in Fig. 5 are intended to be an illustrative example of what we have described in a qualitative way. They correspond to a modelling attempt of the SS 433 radio outburst previously discussed, i.e., the best sampled event that is well suitable for this purpose. The best fit plasmon physical parameters found are listed in Table 3. The Paredes et al. (1991) formulation has been used in the calculations as improved by Peracaula et al. (1997). Two plasmons ejected into opposite directions at a velocity of are considered. The ejection center coincides with the compact companion of the binary system with an adopted orbital separation of cm. The assumed luminosity of the optical companion is erg s-1. It is this radiation field which causes most of the steepening seen in Fig. 5 through strong inverse Compton losses.
5 Conclusions
-
1.
We have conducted a series of millimetre and centimetre observations of a sample of REXRBs during a week long interval. Our target list included both Cygnus X-3 and SS 433, that were persistently detected at 250 GHz (1.25 mm) throughout the whole run. The REXRB LSI+61∘303 was also detected at 250 GHz near the peak of one of its periodic radio outbursts. Several 250 GHz upper limits for other REXRBs are also reported.
-
2.
For the detected sources, our results are in agreement with the synchrotron spectrum in REXRBs extending commonly up to millimetre wavelengths and possibly beyond. This observed fact reinforces the idea that these systems are able to accelerate relativistic electrons to very high energies, at least .
-
3.
The high frequency radio spectrum of Cygnus X-3 and SS 433 was also observed to steepen noticeably during the decay of flaring events. This behavior is interpreted in terms of energetic losses of the synchrotron emitting electrons.
Acknowledgements.
JMP and JM acknowledge partial support by DGICYT (PB97-0903). JM is in addition supported by Junta de Andalucía (Spain), and wishes to thank as well the hospitality and support of the Service d’Astrophysique (CEA/Saclay, France) during the early stages of this work.References
- (1) Altenhoff W.J., Thum C., Wendker H.J., 1994, A&A 281, 161
- (2) Baars J.W.M., Altenhoff W.J., Hein H., Steppe H., 1986, Nat 324, 39
- (3) Band D.L., Gordon M.A., 1989, ApJ, 338, 945
- (4) Becklin E.E., Neugebauer G., Hawkins F.J., et al., 1973, Nat 245, 302
- (5) Fender R.P., Bell Burnell S.J., Garrington S.T., Spencer R.E., Pooley G.G., 1995, MNRAS 274, 633
- (6) Fender R.P., Pooley G.G., Brocksopp C., Newell S.J., 1997a, MNRAS, 290, L65
- (7) Fender R.P., Bell Burnell S.J., Waltman E.B., Pooley G.g., Ghigo f.D., Foster R.S., 1997b, MNRAS, 288, 849
- (8) Fender R.P., Bell Burnell S.J., Waltman E.B., 1997c, VA 41, 3
- (9) Fender R.P., Hanson M.M., Pooley G.G., 1999a, MNRAS (in press)
- (10) Fender R.P., Pooley G.G., Durouchoux P., Tilanus R.P.J., Brocksopp, C., 1999b, MNRAS (submitted)
- (11) Fender R.P., Garrington S.T., McKay J., Muxlow T.W.B., Pooley G.G., Spencer R.E., Stirling A.M., Waltman E.B., 1999c, MNRAS 304, 865
- (12) Gregory P.C., Kronberg P.P, Seaquist E.R., Hughes V.A., Woodsworth A., Viner M.R., Retallack D., Hjellming R.M., Balick B., 1972, Nat Phys Sci 239, 114
- (13) Hjellming R.M., 1973, ApJ 182, L29
- (14) Hjellming R.M., Johnston K.J., 1981, ApJ 246, L141
- (15) Hjellming R.M., Han X., 1995. In: X-Ray Binaries, Cambridge Astrophysics Series, W.H.G. Lewin, J. van Paradijs and E.P.J. van den Heuvel (eds.), 26, 308
- (16) Kramer C., Thum C., Sievers A., 1998, IRAM Internal Report
- (17) McCollough M.L., Harmon B.A., Robinson C.R., et al., 1997, in Transparent Universe, ESA, SP-382, 265
- (18) Martí J., Paredes J.M., Estalella, R., 1992, A&A 258, 309
- (19) Martí J., 1993, PhD Thesis, University of Barcelona
- (20) Martí J., Rodríguez L.F., Mirabel I.F., Paredes J.M., 1996, A&A 306, 449
- (21) Mirabel I.F., Rodríguez L.F., 1994, Nat 371, 46
- (22) Mirabel, I.F., Bandyopadhyay R., Charles P.A., Shahbaz T., Rodriguez L.F., 1997, ApJ 477, L45
- (23) Mirabel I.F., Dhawan V., Chaty S., et al., 1998, A&A 330, L9
- (24) Molnar L.A., 1985, PhD Thesis, Harvard University
- (25) Nelson R.F., Spencer R.E., 1988, MNRAS 234, 1105
- (26) Nesterov N.S., 1992, Bulletin of the Crimean Astrophysical Observatory 82, 40
- (27) Ogley R.N., Bell Burnell S.J., Fender R.P., Pooley G.G., Waltman E.B., van der Klis, M., 1998, NewAR 42, 637
- (28) Paredes J.M., Estalella R., Rius A., 1990, A&A 232, 377
- (29) Paredes J.M., Martí J., Estalella R., Sarrate J., 1991, A&A 248, 124
- (30) Parsignault D.R., et al., 1972, Nat Phys Sci 239, 123
- (31) Penninx W., 1997, Proc. 23rd ESLAB Symp. on Two-Topics in X-Ray Astronomy, ESA SP-296, 185
- (32) Peracaula M., 1997, PhD Thesis, Universitat de Barcelona
- (33) ooley G.G., Fender R.P., 1997, MNRAS, 292, 925
- (34) Pooley G.G., Fender R.P., Brocksopp C., 1999, MNRAS 302, L1
- (35) Pomphrey R.B., Epstein E.E., 1972, Nat 239, 125
- (36) Ray P.S., Foster R.S., Waltman E.B., Tavani M., Ghigo F.D., 1997, ApJ 491, 381
- (37) Rodríguez L.F., Gerard E., Mirabel I.F., Gómez Y., Velázquez A., 1995, ApJS 101, 173
- (38) Rybicki G.B., Lightman A.P., 1979, Radiative Processes in Astrophysics, John Wiley & Sons (eds.)
- (39) Seaquist E.R., Gilmore W.S., Johnston K.J., Grindlay J.E., 1982, ApJ 260, 220
- (40) Taylor A.R., Gregory P.C., 1982, ApJ 255, 210
- (41) Tsutsumi T., Peracaula M., Taylor A.R., 1996. In: Radio Emission from the Stars and the Sun, A.R. Taylor & J.M. Paredes (eds.), ASP Conference Series, Vol. 93, 258
- (42) Vermeulen R.C., Icke V., Schilizzi R.T., Fejes I., Spencer R.E., 1987, Nat 328, 309
- (43) Waltman E.B., Fiedler R.L., Johnston K.J., Ghigo F.D. 1994, AJ 108, 179
- (44) Wild W. 1995, A handbook for the IRAM 30m telescope Pico Veleta, IRAM Internal Report