The Universe behind the Milky Way
Abstract
Due to the foreground extinction of the Milky Way, galaxies appear increasingly fainter the closer they lie to the Galactic Equator, creating a ”zone of avoidance” of about 25% in the distribution of optically visible galaxies. A ”whole-sky” map of galaxies is essential, however, for understanding the dynamics in our local Universe, in particular the peculiar velocity of the Local Group with respect to the Cosmic Microwave Background and velocity flow fields such as in the Great Attractor region.
Various dynamically important structures behind the Milky Way have only recently been made “visible” through dedicated deep surveys at various wavelengths. The wide range of observational searches (optical, near infrared, far infrared, radio and X-ray) for galaxies in the Zone of Avoidance are reviewed, including a discussion on the limitations and selection effects of these partly complementary approaches. The uncovered and suspected large-scale structures are summarized. Reconstruction methods of the density field in the Zone of Avoidance are described and the resulting predictions compared with observational evidence. The comparison between reconstructed density fields and the observed galaxy distribution allow derivations of the density and biasing parameters and .
1Depto. de Astronomía, Universidad de Guanajuato, Apartado
Postal 144, Guanajuato GTO 36000, Mexico
2
Institute of Astronomy, Madingley Road, Cambridge CB3 OHA, UK
1. Introduction
The unveiling of the galaxy distribution behind the Milky Way has turned into a research field of its own in the last ten years (e.g. “Unveiling Large-Scale Structures behind the Milky Way”, ASP Conf. Ser. 67, eds. Balkowski & Kraan-Korteweg, 1994, and “Mapping the Hidden Universe”, ASP Conf. Ser., eds. Kraan-Korteweg et al. 2000, in press). Why is it of interest to know the galaxy distribution behind the Milky Way, and why is it not sufficient to study galaxies and their large-scale distribution away from the foreground “pollution” of the Milky Way? To understand the dynamics in the nearby Universe and answer the question whether the the dipole in the Cosmic Microwave Background (CMB) and other velocity flow fields (e.g. towards the Great Attractor) can be fully explained by the clumpy galaxy/mass distribution, whole-sky coverage is essential. The lack of data in large areas of the sky – where the size of the gap due to the Milky Way depends on the wavelength at which galaxies are sampled – constitutes a severe restriction in solving these questions.
Based on various dedicated observational programs, using nearly all the bands of the electromagnetic spectrum, and the charting of large-scale structures and flow fields in the Zone of Avoidance (ZOA) from statistical reconstructions, a lot of progress has been achieved. In this review, we will give a status report on all of the above approaches. After a historic perspective on the ZOA (Sect. 2.), the cosmological questions for which the unveiling of the ZOA are most relevant are described (Sect. 3.). In Sect. 4., a discussion on the current knowledge of the foreground extinction is presented. This is followed by a description of the various observational multi-wavelength techniques that are currently being employed to uncover the galaxy distribution in the ZOA such as deep optical searches (Sect. 5.), near-infrared and far-infrared surveys (Sect. 6., and 7.), systematic blind radio surveys (Sect. 8.) and searches for hidden massive X-ray clusters (Sect. 9.). For each method, the different limitations and selection effects and results are presented. The various statistical reconstruction methods are reviewed and results of the density field in the ZOA compared with observational data (Sect. 10.).
2. The Zone of Avoidance
A first reference to the Zone of Avoidance (ZOA), or the “Zone of few Nebulae” was made in 1878 by Proctor, based on the distribution of nebulae in the “General Catalogue of Nebulae” by Sir John Herschel (1864). This zone becomes considerably more prominent in the distribution of nebulae presented by Charlier (1922) using data from the “New General Catalogue” by Dreyer (1888, 1895). These data also reveal first indications of large-scale structure: the nebulae display a very clumpy distribution. Currently well-known galaxy clusters such as Virgo, Fornax, Perseus, Pisces and Coma are easily recognizable even though Dreyer’s catalog contains both Galactic and extragalactic objects as it was not known then that the majority of the nebulae actually are external stellar systems similar to the Milky Way. Even more obvious in this distribution, though, is the absence of galaxies around the Galactic Equator. As extinction was poorly known at that time, no connection was made between the Milky Way and the “Zone of few Nebulae”.
A first definition of the ZOA was proposed by Shapley (1961) as the region delimited by “the isopleth of five galaxies per square degree from the Lick and Harvard surveys” (compared to a mean of 54 gal./sq.deg. found in unobscured regions by Shane & Wirtanen, 1967). This “Zone of Avoidance” used to be “avoided” by astronomers interested in the extragalactic sky because of the lack of data in that area of the sky and the inherent difficulties in analyzing the few obscured galaxies known there.
Merging data from more recent galaxy catalogs, i.e. the Uppsala General Catalog UGC (Nilson 1973) for the north (), the ESO Uppsala Catalog (Lauberts 1982) for the south (), and the Morphological Catalog of Galaxies MCG (Vorontsov-Velyaminov & Archipova 1963-74) for the strip inbetween (), a whole-sky galaxy catalog can be defined. To homogenize the data determined by different groups from different survey material, the following adjustments have to be applied to the diameters: and (see Fouqué & Paturel 1985, Lahav 1987). According to Hudson & Lynden-Bell (1991) this “whole-sky” catalog then is complete for galaxies larger than .
The distribution of these galaxies is displayed in Galactic coordinates in Fig. 1 in an equal-area Aitoff projection centered on the Galactic Bulge (). The galaxies are diameter-coded, so that structures relevant for the dynamics in the local Universe stand out accordingly. Figure 1 clearly displays the irregularity in the distribution of galaxies in the nearby Universe such as the Local Supercluster visible as a great circle (the Supergalactic Plane) centered on the Virgo cluster at , the Perseus-Pisces chain (PP) bending into the ZOA at and , the general overdensity in the Cosmic Microwave Background dipole direction (; Kogut et al. 1993) and the general galaxy overdensity in the Great Attractor region (GA) centered on (Kolatt et al. 1995) with the Hydra (), Antlia (), Centaurus () and Pavo () clusters.
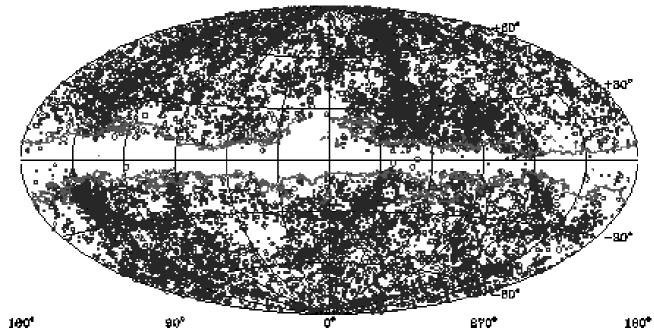
Most conspicuous in this distribution is, however, the very broad, nearly empty band of about 20∘ width. As optical galaxy catalogs are limited to the largest galaxies they become increasingly incomplete close to the Galactic Equator where the dust thickens. This diminishes the light emission of the galaxies and reduces their visible extent. Such obscured galaxies are not included in diameter- or magnitude-limited catalogs because they appear small and faint – even though they might be intrinsically large and bright. A further complication is the growing number of foreground stars close to the Galactic Plane (GP) which fully or partially block the view of galaxy images.
Comparing this “band of few galaxies” with the currently available 100m dust extinction maps of the DIRBE experiment (Schlegel et al. 1998; see Sect. 4.), we can see that the ZOA – the area where the galaxy counts become severely incomplete – is described almost perfectly by the absorption contour in the blue of (where ; Cardelli et al. 1989). This contour matches the by Shapley (1961) defined ZOA closely.
3. The ZOA as an obstacle for cosmological studies
3.1. Large-scale structures
Enormous effort and observation time has been devoted in the last decades to establish the extragalactic large-scale structure. From the various redshift slices, 3-dimensional pictures evolve that distribute galaxies predominantly in clusters, sheets and filaments, leaving large areas devoid of luminous matter. These filaments, respectively their sizes, carry information on the conditions and formation processes of the early Universe, providing important constraints which must be reproduced in cosmological models.
Many of the known nearby large-scale structures are, however, bisected by the Galactic Plane - such as the Local Supercluster, the Perseus-Pisces chain, and the Great Attractor (see Fig. 1). What is their true extent and their mass? It is curious that the two major superclusters in the local Universe, i.e. Perseus-Pisces and the Great Attractor overdensity, lie at similar distances on opposite sides of the Local Group (LG) – both partially obscured by the ZOA. Which one of the two is dominant in the tug-of-war on the LG? Do these features continue across the Galactic Plane and are there other massive structures hidden in the ZOA for which so far no indication exists?
What is the size of the largest coherent structures? Are, for instance, the Great Wall and the Perseus-Pisces chain connected across the ZOA as suggested in 1982 by Giovanelli & Haynes (but see Marzke et al. 1996), indicating structures of over Mpc. The latter would be incompatible with the angular extent over which fluctuations – the seeds of current large-scale structures – have been measured in the CMB. To answer these questions, superclusters need to be fully mapped across the ZOA.
3.2. Dipole determinations
Filling the ZOA also is paramount with respect to the evaluation of the peculiar velocity of the Local Group. The dipole anisotropy in the CMB radiation is explained by a peculiar motion of the LG relative to the CMB of km s-1 towards (Kogut et al. 1993). This motion arises from the net gravitational attraction on the LG due to the irregular distribution of matter in the Universe. Reproducing the vector measured in the CMB radiation with the LG motion determined from the matter distribution (direction as well as convergence distance) will lead to constraints on the cosmological parameter .
The determination of the gravity field at the position of the LG, i.e. velocity and direction of the peculiar motion, requires whole-sky coverage. Kolatt et al. (1995) have shown, for instance, that the mass distribution within of the ZOA – as derived from theoretical reconstructions of the density field (see Sect. 10.) – is crucial to the derivation of the gravitational acceleration of the LG: the direction of the motion measured within a volume of 6000 km s-1 will change by when the (reconstructed) mass within the ZOA is included. The results derived so far for the apex of the LG motion, as well as the distance at which convergence is attained, still are controversial. The lack of data for the ZOA remains one of the main uncertainty in current dipole determinations (e.g. Rowan-Robinson et al. 2000).
Most dipole determinations have assumed a uniformly filled ZOA (e.g. by Poissonian statistics) or have used cloning methods which transplant the fairly well-mapped regions adjacent to the ZOA into the ZOA, or a spherical harmonic analysis (Sect. 10.). All procedures are unsatisfactory, because inhomogenous data coverage, incorrect assumptions on the galaxy distribution in the ZOA, and/or false assumptions on the ZOA mask to be filled will introduce nonexisting flow fields. Care should therefore be taken on how to extrapolate the galaxy density field across the ZOA. Obviously, a reliable consensus on the galaxy distribution in the ZOA is important to minimize these uncertainties.
In this context, not only the identification of unknown and suspected clusters, filaments and voids are relevant, but also the detection of nearby smaller entities. In linear theory, the peculiar velocity of the LG is propertional to the net gravity field which can be determined from the sum of the masses of all galaxies divided by the distance squared:
where is the density parameter and the bias parameter. Since gravity as well as the flux of a galaxy decrease with , the direction and amplitude of the peculiar velocity can be determined directly from, for instance, the sum of the apparent magnitudes of the galaxies in the sky under the assumption of constant mass-to-light ratio
This has important implications and suggests, for instance, that the galaxy CenA with an absorption-corrected magnitude of exerts a stronger luminosity-indicated gravitational attraction on the Local Group than the whole Virgo cluster. The problem whether galaxies trace the mass is inherent to all cumulative dipole determinations. These calculations also predict that the 8 apparently brightest galaxies – which are all nearby ( km s-1) – are responsible for 20% of the total dipole as determined from optically known galaxies within km s-1. Hence, a major part of the peculiar motion of the LG is generated by a few average, but nearby galaxies. Note, however, that for nearby objects non-linear dynamics has to be taken into account.
In this sense, the detection of nearby galaxies or galaxy groups hidden by the obscuration layer of the Galaxy can be as important as the detection of entire clusters at larger distances. The expectation of finding additional nearby galaxies in the ZOA is not unrealistic. Six of the nine apparently brightest galaxies (extinction-corrected) are located in the ZOA: IC342, Maffei 1, Maffei 2, NGC4945, CenA and the recently discovered galaxy Dwingeloo 1 (Kraan-Korteweg et al. 1994b). In the absence of Galactic extinction both Maffei 1 and IC 342 would subtend angles as large as the full Moon (McCall & Buta 1996).
3.3. Dynamics of the Local Group
It is commonly believed that the Local Group (LG) of galaxies is dominated by the Milky Way and Andromeda (M31). A discovery of an unknown Andromeda-like galaxy behind the Milky Way may therefore dramatically change our understanding of the LG dynamics.
Kahn & Woltjer (1959) and Lynden-Bell (1982) have shown that the distances and motions of nearby galaxies may be used to constrain the total mass of the pair Milky Way and M31 and the dynamical age of the Local Group. The method, known as “Local Group timing”, is based upon the assumption that M31 and the Milky Way separated from the Hubble flow soon after formation and behaved dynamically like an isolated binary ever since, with the consequence that the Milky Way has turned in its orbit and is now falling back toward M31. However, it seems that the dominant members of the IC 342/Maffei Group may be massive enough and near enough to the Local Group to have had an influence on its dynamical history (McCall 1989; Valtonen et al. 1993), thereby calling into question the binary hypothesis of LG timing. Peebles (1990) and Dunn & Laflamme (1995) extended this approach by tracing the orbits of the LG galaxies back in time, under the “least action principle”. These analyses rely heavily on having a full census of LG galaxies and on accurate distances to them. Therefore, better mapping of the ZOA is important in two ways: (a) discovering new members of the LG and neighbouring groups (or ruling out their existence); (b) measuring the intrinsic properties of galaxies, properly corrected for extinction, to accurately estimate their distances.
3.4. Cosmic flow fields
Density enhancements locally decelerate the uniform expansion field, as observed within our own Local Supercluster, resulting in systematic streaming motions over and above the uniform expansion field. These flows, on the other hand, can be exploited to map the mass density field independent of the galaxy distribution and/or an assumption on the mass-to-light ratio using peculiar velocities of galaxies, , for which distance determinations independent of redshift are available. The latter can be obtained via the Tully-Fisher relation for spiral galaxies (Tully and Fisher 1977) or the relation for elliptical galaxies (Lynden-Bell et al. 1988). Note though, that only the radial component of the peculiar motion of a galaxy can be measured. The reconstruction of such potential fields and density fields have the advantage that they can locate hidden mass overdensities even if “unseen”. These methods are therefore of particular interest for ZOA research, as these potential fields provide information on the mass distribution behind the Milky Way without having access to the real data on the galaxies hidden there.
Based on these considerations, Dressler et al. (1987) interpreted a systematic infall pattern from the peculiar velocities of about 400 elliptical galaxies as being due to a hypothetical Great Attractor with a mass of at a position in redshift space of km s-1) (Lynden-Bell et al. 1988). A more recent study by Kolatt et al. (1995), based on a larger data set (elliptical and spiral galaxies) and the potential reconstruction method POTENT (see Sect. 10. and Fig. 18) place the center of the GA right behind the Milky Way. Recent consensus is that the GA is an extended region () of moderately enhanced galaxy density. Although there is a considerable excess of optical galaxies and IRAS-selected galaxies in this region (see Fig. 1 and Fig. 8), no dominant cluster or central peak can been seen. But the central part of the GA is hidden by the Milky Way.
Large surveys (e.g. Mathewson et al. 1992 for field galaxies, Mould et al. 1991, Han 1992 for clusters) have resulted in a large collection of peculiar velocities of galaxies, put together in the Mark III catalog of peculiar velocities (Willick et al. 1997). A large effort to obtain peculiar motions of a sample of uniform sky coverage (excluding, however, the ZOA at ) is presented by Giovanelli et al. (1997) and da Costa et al. (1996). This has opened up a new field in cosmology, namely the dynamics of cosmic flows or large-scale dynamics.
4. Extinction by the Milky Way
A crucial step in exploring the extragalactic sky behind the ZOA is a detailed understanding of our own Galaxy, since it would otherwise remain impossible to disentangle newly unveiled clustering from the patchiness of the foreground extinction and, moreover, to correct the observed parameters of detected galaxies for the absorption effects. This requires (a) a high-resolution, well-calibrated map of the foreground extinction and (b) a clear understanding how Galactic extinction affects the observed galaxy parameters. Cameron (1990) investigated the latter in the optical by artificially obscuring high-latitude galaxies, an approach which really needs to be refined and to be explored at other wavelengths.
The Galactic foreground extinction is a function of wavelength. According to Cardelli et al. (1989), the mean extinction at a given wavelength, , compared to the visual extinction, , is:
(see Mathis 1990, for a comprehensive overview on the interstellar dust in the Galaxy). The interstellar extinction is a function of the ratio of total to selective extinction, e.g. [] and the actual value depends on the environment along the line of sight through the Galaxy. For the diffuse interstellar medium a standard value of applies, whereas a higher value of is evident for lines of sight through dense molecular clouds (). But this ratio of total to selective extinction generally is founded upon observations of stars in the Milky Way, ignoring shifts in effective wavelengths which are known to depend upon reddening and intrinsic color. For galaxies heavily reddened by dust in the Milky Way, this approach can lead to significant errors in both magnitudes and distances (McCall & Armour 2000). So the values for are by no means generally applicable.
For years, the extinction maps by Burstein & Heiles (1982) were the standard. But they do not cover the ZOA (). These maps can, however, be extrapolated towards lower latitudes, following the precepts of Burstein & Heiles (1978, 1982) using the Galactic H I column densities (e.g. from Kerr et al. 1986 for the south, and Hartmann & Burton 1997 for the north) assuming a constant gas-to-dust ratio:
However, the gas-to-dust ratio does vary. Burstein et al. (1987) report, for instance, an increase in the gas-to-dust ratio for a region in the southern Milky Way ( and ) of up to a factor of 2, implying severe overstimates of the extinction. Moreover, close to the Galactic Plane (), the Galactic H I line might be saturated, leading to an underestimate of the true extinction. At these latitudes though, the Galactic CO (Dame et al. 1987) can be used as a tracer of extinction.
The recently published 100m extinction maps from the DIRBE experiment (Schlegel et al. 1998) give an improved estimate of the foreground extinction because they provide a direct measure of the dust column density, and because these maps have better angular resolution (61 compared to of the H I maps). According to Schlegel et al., they are a factor 2 better at low and moderate extinction compared to the Burstein & Heiles maps. However, as stated by Schlegel et al. themselves, the accuracy of the DIRBE maps still needs to be established at low Galactic latitudes (). Woudt (1998) found – from photometry and measurements of the Mg2-index of 18 early type galaxies in the ZOA – that the extinction for moderate to high DIRBE reddenings is systematically underestimated (by a factor of f=0.86). As his new calibration so far is based only on few galaxies in a small region of the ZOA, it seems too early to incorporate these adjustments to the DIRBE maps. However, this study clearly illustrates the need for a careful calibration of the DIRBE maps in the ZOA.
Although the knowledge on the Galactic foreground extinction has improved enormously in the last 20 years, many open points still need to be resolved before we can properly analyze the galaxy distribution uncovered in the ZOA. On the other hand, a lot can be learned about total extinction from ZOA research itself. As mentioned above, Woudt (1998) has used photometry and spectroscopy of early-type galaxies in the ZOA to obtain a first calibration of the DIRBE maps in the ZOA. He now has started a program to pursue this systematically for the southern Milky Way using a sample of about 300 early-type galaxies distributed within the southern ZOA. Furthermore, Saito et al. (2000) have used colors of over a hundred galaxy candidates at extremely low latitudes () in combination with CO emission to determine extinction estimates, and Temporin et al. (2000) determined total extinctions from photometry towards galaxies in the region . Similarly, the colors of galaxies identified in the ZOA with the near infrared surveys DENIS and 2MASS (see Sect. 6.) will provide a huge data base to calibrate the DIRBE maps at low Galactic latitudes.
5. Optical surveys
Systematic optical galaxy catalogs are generally limited to the largest galaxies (typically with diameters D , e.g. Lauberts 1982). These catalogs become, however, increasingly incomplete as the dust thickens, creating a “Zone of Avoidance” in the distribution of galaxies of roughly 25% of the sky. Systematically deeper searches for partially obscured galaxies – down to fainter magnitudes and smaller dimensions compared to existing catalogs – have been performed on existing sky surveys with the aim of reducing this ZOA. Meanwhile, through the efforts of various collaborations, nearly the whole ZOA has been surveyed and over 50000 previously unknown galaxies were discovered in this way. These surveys are not biased with respect to any particular morphological type and were able to identify important new large-scale structures in and across the Milky Way.
5.1. Early searches and results
One of the first attempts to detect galaxies in the ZOA was carried out by Böhm-Vitense in 1956. She did follow-up observations in selected fields in the GP in which Shane and Wirtanen (1954) found objects that ”looked like extragalactic nebulae” but were not believed to be galaxies because they were so close to the dust equator. She confirmed many galaxies and concluded that the obscuring matter in the GP must be extremely thin and full of holes between and .
Because extinction was known to be low in Puppis, Fitzgerald (1974) performed a galaxy search in one field there () and discovered 18 small and faint galaxies. Two years later Dodd & Brand (1976) examined 3 fields adjacent to this area () and detected another 29 galaxies. Kraan-Korteweg & Huchtmeier (1992) observed these galaxies in H I at Effelsberg and identified an unknown nearby cluster at ( km s-1). Including IRAS data in the analysis of this cluster, it could be shown that its density is comparable to the Virgo cluster and that this Puppis cluster may contribute a significant component to the motion of the LG (Lahav et al. 1993).
During a search for infrared objects, Weinberger et al. (1976) detected two galaxy candidates near the Galactic Plane () which Huchra et al. confirmed in 1977 to be the brightest members of a galaxy cluster at 4200 km s-1. This discovery led Weinberger (1980) to start the first systematic galaxy search. Using the POSS E prints, he covered the whole northern GP () in a thin strip . He found 207 galaxies, the distribution of which is highly irregular: large areas disclose no galaxies and the ”hole” pointed out by Böhm-Vitense was verified, but most conspicuous was a huge excess of galaxies around . In 1984, Focardi et al. made the connection with large-scale structures: they interpreted the excess as the possible continuation of the Perseus-Pisces cluster across the GP to the cluster A569. Radio-redshift measurements by Hauschildt (1987) established that the PP cluster at a mean redshift of km s-1 extends to the cluster 3C129 in the GP (). Additional H I and optical redshift measurements of Zwicky galaxies by Chamaraux et al. (1990) indicate that this chain can be followed even further to the A569 cloud at km s-1 on the other side of the ZOA.
These early searches proved that large-scale structure can be traced to much lower Galactic latitudes despite the foreground obscuration and its patchy nature which suggests clustering in the galaxy distribution independent of large-scale structure. The above investigations did confirm suspected large-scale features across the GP through searches in selected regions and follow-up redshift observations. To study large-scale structure systematically broader latitude strips covering the whole Milky Way, respectively the whole ZOA (see Fig. 1) are required.
5.2. Status of systematic optical searches
Using existing sky surveys such as the first and second generation Palomar Observatory Sky Surveys POSS I and POSS II in the north, and the ESO/SRC (United Kingdom Science Research Council) Southern Sky Atlas, various groups have performed systematic deep searches for “partially obscured” galaxies, i.e. they catalogued galaxies down to fainter magnitudes and smaller dimensions () than existing catalogs. Here, examination by eye remains the best technique. A separation of galaxy and star images can not be done as yet on a viable basis below by automated measuring machines such as e.g. COSMOS (Drinkwater et al. 1996) or APM (Lewis & Irwin 1996) and sophisticated extraction algorithms, nor with the application of Artificial Neural Networks [ANN]. The latter was tested by Naim (1995) who used ANN to identify galaxies with diameters above 25′′ at low Galactic latitudes (). Galaxies could be identified using this algorithm, and although an acceptable hit rate for galaxies of 80 – 96% could be attained when ANN was trained on high latitude fields, the false alarms were of equal order. Using low latitude fields as training examples, the false alarms could be reduced to nearly zero but then the hit rate was low ( 30 - 40%). The first attempts of using ANN in the ZOA are encouraging but clearly need further development. So, although surveys by eye are both tiring and time consuming, and maybe not as objective, they currently still provide the best technique to identify partially obscured galaxies in crowded star fields.
Meanwhile, nearly the whole ZOA has been visually surveyed for galaxies. The various surveyed regions are displayed in Fig. 2. Details and results on the uncovered galaxy distributions and the respective references are described below:
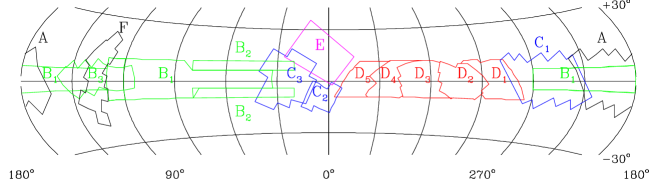
Region A: In order to trace the possible continuity across the Galactic Plane of the southwestern spur of the PP complex Pantoja et al. (1994, 1997) have searched for galaxy candidates on 29 POSS E prints with a 12 magnification. They identified 1480 galaxy candidates in the region delimited by , where the declination range was optimized for H I follow-up redshift observations with the 305 m Arecibo radio telescope.
Regions B1-B3: Using the first generation POSS I prints, and more recently also the deeper POSS II films, Weinberger and collaborators in Austria have expanded their optical galaxy searches in such a way that they now cover nearly the whole northern Milky Way. They also searched the Puppis region for comparative purposes. The information and data of the B1 region from POSS I plates can be found in Seeberger et al. (1994), Seeberger et al. (1996), Lercher et al. (1996), Saurer et al. (1997), Seeberger et al. (1998), and Marchiotto et al. 1999 for the B2 regions (also POSS I), and the B3 region from POSS II fields in Weinberger et al. 1999). In total, they uncovered about 9500 galaxies in the northern ZOA. Their distribution shows a marked overdensity at the suspected connection of the PP supercluster across the Galactic Plane (). A comparison between the old and new generation POSS fields found a dramatic increase in galaxy numbers of about a factor of 3 for the deeper POSS II fields.
Regions C1-C3: Using the infrared film copies of the ESO/SRC survey Japanese groups led by Saito investigated the ZOA in the longitude range (C1: Saito et al. 1990, 1991). On 32 fields they charted over 7000 galaxies with mm. As anticipated, a large number of galaxies was detected in the low opacity region of Puppis (). Correlating the density with the H I-column density, they found indications of the existence of various clusters. They then continued studying regions close to the Galactic bulge, i.e. the Sagittarius/Galactic region (C2: by Roman et al. 1998), and the Aquila and Sagittarius region (C3: by Roman et al. 1996) uncovering a further 12500 galaxies in this very opaque region. This data set is less homogeneous as a variety of survey material had to be used to cover this area.
Regions D1-D5: Since 1988, various groups led by Kraan-Korteweg have searched the southern Milky Way between the Puppis region (C1) and the Galactic bulge region (C2 & E) using the IIIaJ film copies of the ESO/SRC and a magnification of 50. The surveys are divided into the Hydra to Puppis region (D1: Salem & Kraan-Korteweg, in prep.), the Hydra/Antlia Supercluster region (D2: Kraan-Korteweg 2000), the Crux region (D3: Woudt 1998, Woudt & Kraan-Korteweg 2000a), the GA region (D4: Woudt 1998, Woudt & Kraan-Korteweg 2000b), and the Scorpius region (D5: Fairall & Kraan-Korteweg, 2000). Slightly over 17 000 galaxies were identified in these regions of which were previously unknown. Folding the galaxy distribution with extinction maps revealed various unknown clumpings, the most impressive recognition being that the cluster A3627 at ( km s-1) within the Great Attractor region (see Fig. 3) would be the most prominent galaxy overdensity in the southern sky were it not for the diminishing effects of the foreground extinction (Kraan-Korteweg et al. 1996).
Region E: Motivated by the chance discovery of two clusters behind the Galactic bulge, i.e. the Ophiuchus cluster at km s-1) by Johnston et al. (1981) and Wakamatsu & Malkan (1981), as well as the Sagittarius cluster closeby in redshift space ( km s-1), Wakamatsu and collaborators surveyed this region in more detail. They performed a deep survey of six ESO/SRC fields centered on these clusters and a shallow survey from to search for wall-like connections with the Hercules cluster (region E). In the former region close to 4000 galaxies were charted with mm, revealing two new clusters and 4 galaxy groups all at the same redshift range (Wakamatsu et al. 1994, Hasegawa et al. 2000).
Region F: In 1995, Hau et al. (1995) searched 12 red POSS plates at because of the increased likelyhood of detecting galaxies along the Supergalactic Plane. They indeed identified a signficant number of galaxies (N = 2575), though this relatively high number is also due to the fact that this search includes higher latitude () regions, hence lower extinction levels compared to the other searches. To confirm the nature of these galaxy candidates, follow-up observations using various techniques were performed on a sample of suspected nearby galaxies (Lahav et al. 1998).
A comparison of the surveyed regions (Fig. 2) with the ZOA as outlined in Fig. 1 clearly demonstrates that nearly the whole ZOA has been covered by systematic deep optical galaxy searches. All these searches have similar characteristics and reveal that galaxies can easily be traced through obscuration layers of 3 magnitudes, narrowing therewith the ZOA considerably. This is illustrated with Fig. 3 which shows an area of the sky centered on the southern Milky Way with all the Lauberts galaxies larger than (diameter-coded as in Fig. 1) plus all the galaxies with from the deep optical galaxy searches by Kraan-Korteweg and collaborators (D1-D5 in Fig. 2). DIRBE extinction contours equivalent to and are also drawn.
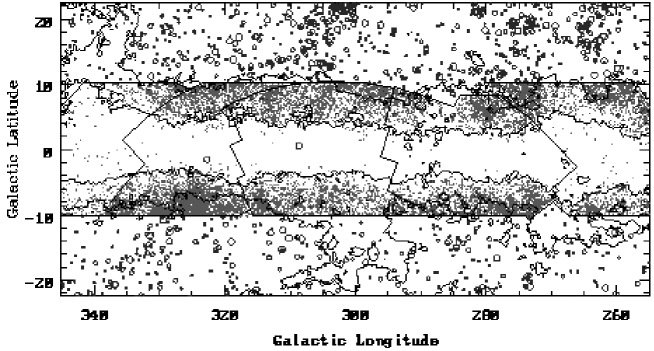
A few galaxies still are recognizable up to extinction levels of and a handful of very small galaxy candidates have been found at even higher extinction levels. The latter ones most likely indicate holes in the dust layer. Overall, the mean number density follows the dust distribution remarkably well. The contour level of , for instance, is nearly indistinguishable from the galaxy density contour at 0.5 galaxies per square degree.
Analyzing the galaxy density as a function of galaxy size, magnitude and/or morphology in combination with the foreground extinction has led to the identification of various important large-scale structures and their approximate distances. In Fig. 3, for instance, the most extreme overdensity is found at ). It is at least a factor 10 denser compared to regions at similar extinction levels. This galaxy excess is centered on the cluster A3627, now recognized as the most massive cluster in the nearby Universe (Kraan-Korteweg et al. 1996, see also Sect. 5.4.). To trace these structures in detail, an understanding of the completeness of these searches is required and follow-up observations must be obtained to map the large-scale structures in redshift space (see Sect. 5.4.).
5.3. Completeness of optical galaxy searches
In order to merge the various deep optical ZOA surveys with existing galaxy catalogs, Kraan-Korteweg (2000) and Woudt (1998) have analyzed the completeness of their ZOA galaxy catalogs – the Hyd/Ant [D2], Crux [D3] and GA [D4] region – as a function of the foreground extinction.
By studying the apparent diameter distribution as a function of the extinction (Schlegel et al. 1998) as well as the location of the flattening in the slope of the cumulative diameter curves for various extinction intervals (cf. Fig. 5 and 6 in Kraan-Korteweg 2000), they conclude that their optical ZOA surveys are complete to an apparent diameter of – where the diameters correspond to an isophote of 24.5 mag/arcsec2 – for extinction levels less than .
How about the intrinsic diameters, i.e. the diameters galaxies would have if they were unobscured? A spiral galaxy seen through an extinction of will, for example, be reduced to of its unobscured size. Only of a (spiral) galaxy’s original dimension is seen when it is observed through . In 1990, Cameron derived analytical descriptions to correct for the obscuration effects by artificially absorbing the intensity profiles of unobscured galaxies. These corrections depend quite strongly on morphological type due to the mean surface brightness and difference in brightness profiles between early-type galaxies and spiral galaxies. Applying these corrections, Kraan-Korteweg (2000) and Woudt (1998) found that at , an obscured spiral or an elliptical galaxy at their apparent completeness limit of would have an intrinsic diameter of , respectively . At extinction levels higher than , an elliptical galaxy with would appear smaller than the completeness limit and might have gone unnoticed. These optical galaxy catalogs should therefore be complete to for galaxies of all morphological types down to extinction levels of with the possible exception of extremely low-surface brightness galaxies. Only intrinsically very large and bright galaxies – particularly galaxies with high surface brightness – will be recovered in deeper extinction layers. This completeness limit could be confirmed by independently analyzing the diameter vs. extinction and the cumulative diameter diagrams for extinction-corrected diameters.
One can thus supplement the ESO, UGC and MCG catalogs – which are complete to – with galaxies from optical ZOA galaxy searches that have and . As the completeness limit of the optical searches lies well above the ESO, UGC and MGC catalogs, one can assume that the other similarly performed optical galaxy searches in the ZOA should also be complete for galaxies with extinction-corrected diameters to extinction levels of . In Fig. 4, we have then taken the first step in arriving at an improved whole-sky galaxy distribution with a reduced ZOA. In this Aitoff projection, we plot all the UGC, ESO, MGC galaxies that have extinction-corrected diameters (remember that galaxies adjacent to the optical galaxy search regions are also affected by absorption though to a lesser extent: ), and added all the galaxies from the various optical surveys with and for which positions and diameters were available. The regions for which these data are not yet available are marked in Fig. 4. As some searches were performed on older generation POSS I plates, which are less deep compared to the second generation POSS II and ESO/SERC plates, an additional correction was applied to those diameters, i.e. the same correction as for the UGC galaxies which also are based on POSS I survey material ().
A comparison of Fig. 1 with Fig. 4 demonstrates convincingly how the deep optical galaxy searches realize a considerable reduction of the ZOA: we can now trace the large-scale structures in the nearby Universe to extinction levels of . Inspection of Fig. 4 reveals that the galaxy density enhancement in the GA region is even more pronounced and a connection of the Perseus-Pisces chain across the Milky Way at more likely. Hence, these supplemented whole-sky maps certainly should improve our understanding of the velocity flow fields and the total gravitational attraction on the Local Group.
5.4. Redshift follow-ups of optical surveys
The analysis of the galaxy density as a function the foreground extinction revealed various large-scale structures in the ZOA. These need to be mapped in redshift space. So far, the Perseus-Pisces supercluster, the Puppis region, the Ophiuchus supercluster behind the Galactic Bulge area, and the southern ZOA have been intensively observed. The most prominent new galaxy structures revealed in this way are summarized below. Their approximate positions (ordered in Galactic latitude) are given as ():
Based on a redshift survey of over 2500 galaxies using the multi-spectrograph “Flair” on the UKST (AAO), Wakamatsu et al. (2000) confirmed that the Ophiuchus cluster behind the Galactic bulge ( km s-1) is the central component of a supercluster including two more clusters and four groups of galaxies. There seems to be a wall-like structure connecting the Ophiuchus cluster to the Hercules supercluster at 11000 km s-1. This wall runs orthogonal to the Great Wall.
At () (), Marzke et al. (1996) and Roman et al. (1998) found evidence for a nearby cluster close to the Local Void at 1500 km s-1, as well as a prominent cluster behind the Local Void at 7500 km s-1. The nearby cluster is independently supported by data from blind H I-surveys (see Sect. 8.).
The connection of the Perseus-Pisces supercluster across the ZOA to the cluster A569, suspected by Focardi et al. (1984), was confirmed by Chamaraux et al. (1990) and Pantoja et al. (1997). The Perseus-Pisces chain seems to fold back into the ZOA at higher redshifts at ( km s-1), Marzke et al. (1996), Pantoja et al. (1997).
In 1992, Kraan-Korteweg & Huchtmeier uncovered a nearby cluster in Puppis ( km s-1) which was later shown by Lahav et al. (1993) to contribute a non-negligible component to the peculiar z-motion of the Local Group. Since then, this region has been investigated in further detail. Chamaraux et al. (1999) found further evidence for this cluster. It lies within a long narrow filament (Masnou & Chamaraux, in prep.) which extends from the Antlia to the Fornax cluster (see also Fig. 12).
Kraan-Korteweg et al. (1994a) presented evidence for a continous filamentary structure extending over on the sky from the Hydra and Antlia clusters across the ZOA, intersecting the Galactic Plane at ( km s-1). At the same longitudes, they noted significant clustering at 15000 km s-1, indicative of a connection between the Horologium and Shapley clusters a hundred degrees apart in the sky.
Kraan-Korteweg & Woudt (1993) uncovered a shallow but extended supercluster in Vela at ( km s-1).
Next to the massive cluster A3627 at the core of the Great Attractor (clustering in the Great Attractor region is discussed in the next section), Woudt (1998) discovered a cluster at () called the Cen-Crux cluster, and a more distant cluster, the Ara cluster at ( km s-1). The latter might be connected to the Triangulum-Australis cluster.
Clustering within the Great Attractor region
Based on a deep optical galaxy search and subsequent redshift follow-ups, Kraan-Korteweg et al. (1996) and Woudt (1998) have clearly shown that the Norma cluster, A3627, at (, 4848 km s-1) is the most massive galaxy cluster in the GA region known to date and probably marks the previously unidentified but predicted density-peak at the bottom of the potential well of the GA overdensity. The prominence of this cluster has independently been confirmed by ROSAT observations: the Norma cluster ranks as the 6th brightest X-ray cluster in the sky (Böhringer et al. 1996). It is comparable in size, richness and mass to the well-known Coma cluster. Redshift-independent distance determinations (RC and IC band Tully – Fisher relation analysis) of the Norma cluster have shown it to be at rest with respect to the rest frame of the Cosmic Microwave Background (Woudt 1998).
One cannot, however, exclude the possibility that other unknown rich clusters reside in the GA region as the ZOA has not been fully unveiled with optical searches. Finding a hitherto uncharted, rich cluster of galaxies at the heart of the GA would have serious implications for our current understanding of this massive overdensity in the local Universe. Kraan-Korteweg & Woudt (1999) found various indications that PKS1343601, the second brightest extragalactic radio source in the southern sky ( Jy, McAdam 1991, and references therein) might form the center of yet another highly obscured rich cluster, particularly as it also shows significant X-ray emission (Tashiro et al. 1998): extended diffuse hard X-ray emission at the position of PKS1343601 has been detected with ASCA. The radiation, kT = 3.9 keV, is far too large for it being associated with a galactic halo surrounding the host galaxy, hence it might be indicative of emission from a cluster – if it is not due to the Inverse Compton process.
At (), this radio galaxy lies behind an obscuration layer of about 12 magnitudes of extinction in the B-band, as estimated from the DIRBE extinction maps (Schlegel et al. 1998). Its observed diameter of 28 arcsec in the Gunn-z filter (West & Tarenghi 1989) translates into an extinction-corrected diameter of 232 arcsec (following Cameron 1990). With a recession velocity of km s-1 (West & Tarenghi 1989), this galaxy can be identified with a giant elliptical galaxy.
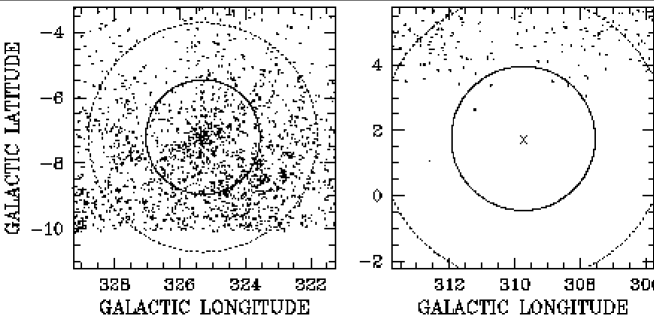
Since PKS1343601 is so heavily obscured, little data are available to substantiate the existence of this prospective cluster. In Fig. 5, the A3627 cluster at a mean extinction as seen in deep optical searches is compared to the prospective PKS1343 cluster at ( km s-1) with an extinction of 12m. One can clearly see that at the low Galactic latitude of the suspected cluster PKS1343, the optical galaxy survey could not retrieve the underlying galaxy distribution, especially not within the Abell radius of the suspected cluster (the inner circle in Fig. 5). To verify this cluster, other observational approaches are necessary. We have imaged the prospective cluster within its Abell radius in the near infrared (Woudt et al. in progress). These observations will allow us to determine whether or not PKS1343601 is embedded in a centrally condensed overdensity of galaxies. Interestingly enough, deep H I observations did uncover a significant excess of galaxies at this position in velocity space (see Sect. 8.2.) although a “finger of God”, the characteristic signature of a cluster in redshift space, is not seen. Hence, the Norma cluster A3627 remains the best candidate for the center of the extended GA overdensity.
5.5. The Sagittarius dwarf
A remarkable discovery was made by Ibata et al. (1994). They found a nearby ‘dwarf’ galaxy with diameter of about 3 kpc. This new galaxy, named the Sagittarius dwarf, is on the far side of the Galactic center, about 25 kpc away from us, but well inside the Milky Way. This galaxy is most probably undergoing some tidal disruption, before being absorbed by the Milky Way. An interesting feature of the discovery of this galaxy is that it was based on velocities, not direct detection on plates. In fact, the Sagittarius dwarf galaxy is some twenty degrees from end to end, making it the largest structure in the sky after the Milky Way itself. Nonetheless, since the new galaxy lies directly behind the central bulge of the Milky Way, it cannot be seen in direct images - even with hindsight - through the dust and against the very much larger number of Galactic stars.
The Sagittarius dwarf galaxy provides an important clue to the formation process of the Milky Way. Many popular models of galaxy formation suggest that large galaxies are formed by a long process of aggregation of many smaller galaxies, possibly with some merger events being disruptive of the normal disk structure of spiral galaxies. Such a process should still be common today, yet it had been observed previously only in extremely rare cases. The Sagittarius dwarf merger with the Milky Way provides the ‘smoking gun’, showing that such mergers do happen, they happen today, and they are not destructive.
5.6. Conclusions
Deep optical galaxy searches have succesfully reduced the solid angle of the ZOA by a factor of about down to extinction levels of and have identified a number of important unknown structures. However, they fail in the most opaque part of the Milky Way, the region encompassed by the contour in Fig. 4 – a sufficiently large region to hide further dynamically important galaxy densities. Here, systematic surveys in other wavebands can be applied to reduce the current ZOA even further. The success and status of these approaches are discussed in the following sections.
6. Near infrared surveys
Observations in the near infrared (NIR) can provide important complementary data to other surveys. With extinction decreasing as a function of wavelength, NIR photons are up to 10 times less affected by absorption compared to optical surveys – an important aspect in the search and study of galaxies behind the obscuration layer of the Milky Way. The NIR is sensitive to early-type galaxies – tracers of massive groups and clusters – which are missed in IRAS and H I surveys (Sect. 7. and 8.). In addition, confusion with Galactic objects is considerably lower compared to the FIR surveys. Furthermore, because recent star formation contributes only little to the NIR flux of galaxies (in contrast to optical and FIR emission), NIR data give a better estimation of the stellar mass content of galaxies. It is therefore well suited for the application of the Tully – Fisher relation either through pointed H I observations of galaxies detected in the NIR or a merging of detections from systematic blind H I surveys with NIR observations (Sect. 6.3.).
6.1. The NIR surveys DENIS and 2MASS
Two systematic near infrared surveys are currently being performed: DENIS, the DEep Near Infrared Southern Sky Survey, is imaging the southern sky from in the (0.8m), (m) and (m) bands. 2MASS, the 2 Micron All Sky Survey, is covering the whole sky in the (m), (m) and (m) bands. The mapping of the sky is performed in declination strips, which are in length and 12 arcmin wide for DENIS, and for 2MASS. Both the DENIS and 2MASS surveys are expected to complete their observations by the end of 2000. The main characteristics of the 2 surveys and their respective completeness limits for extended sources are given in Table 1 (Epchtein 1997, 1998, Skrutskie et al. 1997, Skrutskie 1998).
| DENIS | 2MASS | |||||
| Channel | ||||||
| Central wavelength | m | m | m | m | m | m |
| Arrays | 1024x1024 | 256x256 | 256x256 | 256x256 | 256x256 | 256x256 |
| Pixel size | ||||||
| Integration time | 9s | 10s | 10s | 7.8s | 7.8s | 7.8s |
| Completeness limit | ||||||
| for extended sources | ||||||
| Number counts for the | ||||||
| completeness limits | 50 | 28 | 3 | 48 | 40 | 24 |
| Extinction compared | ||||||
| to the optical | 0.45 | 0.21 | 0.09 | 0.21 | 0.14 | 0.09 |
Details and updates on completeness, data releases and data access for DENIS and 2MASS can be found on the websites http://www-denis.iap.fr, and http://www.ipac.caltech.edu/2mass, respectively.
The DENIS completeness limits (total magnitudes) for highly reliable automated galaxy extraction (determined away from the ZOA, i.e. ) are , , (Mamon 1998). The number counts per square degrees for these completeness limits are 50, 28 and 3 respectively. For the 2MASS, the completeness limits are , , (isophotal magnitudes), with number counts of 48, 40 and 24. Because no counts have been published we estimated their counts from low, mid and high-density fields and the and color distribution (cf. http://spider.ipac.caltech.edu/staff/jarrett/2mass). The numbers agree well with the 2MASS predictions of the detection of 1 million galaxies on the whole sky for their band completeness limit. In all wavebands, except , the number counts are still imprecise due to the low number statistics and the strong dependence on the star crowding in the analyzed fields. Still, these numbers suffice to reveal the promise of NIR surveys for probing the galaxy distribution at very low Galactic latitudes.

The decrease in number counts is considerably slower in the , , and bands compared to the optical because extinction is only 45%, 21%, 14% and 9% compared to the band. This dependence makes NIR surveys very powerful at low Galactic latitudes even though they are not as deep as the POSS and ESO/SERC sky surveys. As illustrated in Fig. 6, the galaxy density in the band in unobscured regions is 110 galaxies per square degree for the completeness limit of (Gardner et al. 1996). But the counts in the blue decrease rapidly with increasing obscuration: deg-2. The decrease in detectable galaxies due to extinction is slower in the NIR, and the counts of the shallower NIR surveys overtake the optical counts at extinction levels of . The location of the reversal in efficiency is particularly opportune because the NIR surveys become more efficient where deep optical galaxy searches become incomplete, i.e. at (see Sect. 5.3.).
The above predictions do not take into account any dependence on
morphological type, surface brightness, intrinsic color, orientation
and crowding, which may lower the counts of actually detectable
galaxies counts. In practice, was found to be superior for
identification of galaxies on DENIS images to extinction levels of at
least . And even though 2MASS appears more powerful in
Fig. 6 for ZOA research compared to DENIS, the higher
sensitivity of 2MASS also results in higher star densities at low
latitudes, making galaxy identifications more difficult. This problem
becomes apparent from, for instance, Fig. 28 and Fig. 29a in the ’List
of Figures’ accessible from
http://spider.ipac.caltech.edu/staff/jarrett/2mass/3chan/basic/paper_ I.html
which show galaxy images in , and in the ZOA at extinction
levels which are not yet very severe ( and in the
optical).
6.2. Pilot studies with DENIS data in the ZOA
To compare the above predictions with real data, Schröder et al. (1997, 1999) and Kraan-Korteweg et al. (1998b) examined the efficiency of uncovering galaxies at high extinctions using DENIS images. The analyzed regions include the rich cluster A3627 ( at the heart of the GA (Norma) supercluster, as well as its suspected extension across the Galactic Plane.
Three high-quality DENIS strips cross the cluster A3627. 66 images on these strips lie within the Abell-radius () and were inspected by eye (Kraan-Korteweg et al. 1998a). This covers about one-eighth of the cluster area. The extinction over the regarded cluster area varies as .
On these 66 images, 151 galaxies had previously been identified in the deep optical ZOA galaxy search (Woudt & Kraan-Korteweg 2000b). Of these, 122 were recovered in the , 100 in the , and 74 in the band. Most of the galaxies not re-discovered in are low surface brightness spiral galaxies.
Surprisingly, the band provides better galaxy detection than the band. In the latter, the severe star crowding makes identification of faint galaxies very difficult. At these extinction levels, the optical survey does remain the most efficient in identifying obscured galaxies.
The search for more obscured galaxies was made in the region and , i.e. the suspected crossing of the GA. Of the 1800 images in that area, 385 of the then available DENIS images were inspected by eye (308 in ). 37 galaxies at higher latitudes were known from the optical survey. 28 of these could be re-identified in , 26 in , and 14 in the band. In addition, 15 new galaxies were found in and , 11 of which also appear in the band. The ratios of galaxies found in compared to , and of compared to are higher than in the A3627 cluster. This is due to the higher obscuration level (starting with at the high-latitude border).
On average, about 3.5 galaxies per square degree were found in the band. This roughly agrees with the predictions of Fig. 6. Because of star crowding, we do not expect to find galaxies below latitudes of in this longitude range (Mamon 1994). Low-latitude images substantiate this – the images are nearly fully covered with stars. Indeed, the lowest Galactic latitude galaxies were found at and (in and only).
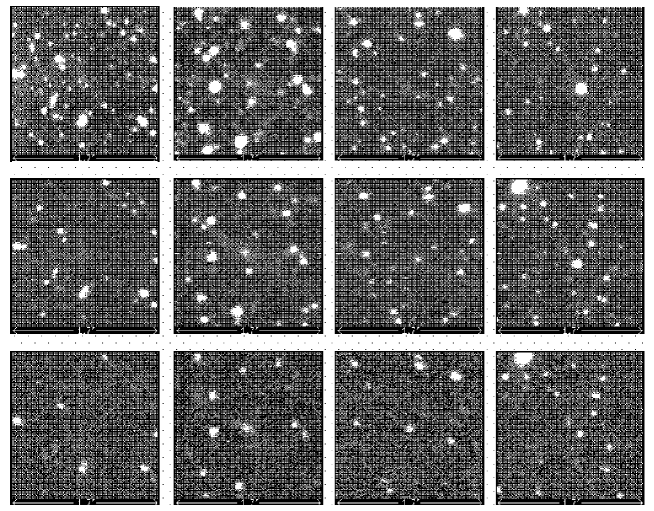
Figure 7 shows a few characteristic examples of highly obscured galaxies found in the DENIS blind search. band images are at the top, in the middle and at the bottom. The first galaxy located at ) is viewed through an extinction layer of according to the DIRBE extinction maps (Schlegel et al. 1998). It is barely visible in the band. The next galaxy at ) is subject to heavier extinction (), and indeed easier to recognize in the NIR. It is most distinct in the band. The third galaxy at even higher extinction ) is – in agreement with the prediction of Fig. 6 – not visible in the band. Neither is the fourth galaxy at and : this galaxy can not be seen in band either and is very faint only in and .
The conclusions from this pilot study are that at intermediate latitudes and extinction (, ) optical surveys are superior for identifying galaxies. But despite the extinction and the star crowding at these latitudes, , and photometry from the survey data could be performed successfully at these low latitudes. The NIR data (magnitudes, colors) of these galaxies can therefore add important data in the analysis of these obscured galaxies. They led, for instance, to the preliminary , and galaxy luminosity functions in A3627 (Fig. 2 in Kraan-Korteweg et al. 1998a).
At the lowest latitudes and at high extinction ( and ), the search for ‘invisible’ obscured galaxies on existing DENIS-images imply that NIR-surveys can trace galaxies down to about . The band was found to be optimal for identifying galaxies up to . NIR surveys can hence further reduce the width of the ZOA.
6.3. Systematic exploitation of NIR surveys and redshift follow-ups
At the Observatoire de Lyon (France), DENIS images are being processed routinely as they come out of the pipeline (cf. Vauglin et al. 1999 for a catalog of over 20000 galaxies found on the band images in 25% of the southern sky). Concerning the ZOA, and band DENIS images are systematically being inspected by eye for galaxies below since March 1997. This so far has led to the detection of 1500 extended objects most of which were unknown previously. For these galaxies, magnitudes, isophotal diameters, axis ratios, position angles and a rough estimate of the morphological type are recorded. This catalog will build the basis for systematic H I line redshift follow-ups with the goal of applying the Tully – Fisher relation to determine the peculiar velocity field. Using a morphological classification based upon a concentration parameter (Theureau et al. 1997), they want to obtain a complete sample of late-type inclined spirals within a volume of km s-1.
A similar project, but starting out from an H I-selected sample, is being pursued by cross-identifying all galaxies detected in the the systematic deep blind H I survey (Sect. 8.2.) in the ZOA () on NIR images (Schröder et al. in prep.) – also with the aim of determining the density field from the peculiar velocity field through the Tully – Fisher relation.
A collaboration involving UMASS, IPAC and the CfA is working on a redshift survey (the 2MASS Redshift Survey, 2MRS) of the whole sky that will contain galaxies to a limiting magnitude of . The first phase will be directed at galaxies with . This survey will include the ZOA and although the shallow redshift survey so far is only 25% complete, it already shows considerable structure through the Galactic Plane out to high velocities (http://cfa-www.harvard.edu/~huchra/2mass/).
Two spectroscopic follow-ups of DENIS and 2MASS galaxies are planned on the 6dF robotic multi-object spectroscopic unit, currently under construction at the AAO: a redshift survey of roughly 120000 NIR-selected galaxies for which a total of 300 nights are guaranteed between 2001 and 2003 and a peculiar velocity survey of roughly 12000 early-type galaxies. The latter will be complemented by an H I peculiar velocity survey of over 5000 inclined spirals (Mamon 1998, 1999). In this project, however, only selected areas in the ZOA will be probed.
6.4. Conclusions
First results from NIR data are very promising for ZOA research – and complementary to other approaches. NIR surveys become more efficient in revealing galaxies at extinction levels where deep optical searches become increasingly incomplete, i.e. at . It was found that galaxies can be traced to Galactic latitudes of .
A independent advantage of the NIR surveys is the fact that the NIR colors, in particular of early-type galaxies, might help in the calibration of the DIRBE extinction maps at low Galactic latitudes (see e.g. Fig. 5 in Schröder et al. 1997).
The NIR surveys are particularly useful for the mapping of massive early-type galaxies – tracers of density peaks in the mass distribution – as these can not be detected with any of the techniques that are efficient in tracing the spiral population in more opaque regions (Sect. 7. and 8.).
Nevertheless, NIR surveys are also important with regard to the blue and low surface-brightness spiral galaxies because a significant fraction of them are detectable in the near infrared. This is confirmed, for instance, with the serendipitous discovery in the ZOA of a large, nearby ( km s-1) edge-on spiral galaxy by 2MASS (Hurt et al. 1999): with an extension in the band of 5 arcmin, this large galaxy is – not unexpectedly for its extinction of at the position of – not seen in the optical (Saito et al. 1991). A more systematic analysis of low-latitude spiral galaxies in the NIR was undertaken by Schröder et al. (priv. comm): about 80% of the spiral galaxies detected in the shallow systematic H I survey performed with the Parkes Multibeam Receiver (Sect. 8.2.) could be reidentified on band DENIS images, a few more in and only. The above nearby NIR galaxy with a flux of 33.7 Jy km s-1 in the 21 cm line was discovered independently in this survey (HIZSS012, Henning et al. 2000).
The overlap of galaxies found in NIR and H I surveys is important. With the combination of H I data and NIR data one can study the peculiar velocity field via the NIR Tully – Fisher relation “in the ZOA” compared to earlier interpolations of data “adjacent to the ZOA”. This will provide important new input for density field reconstructions in the ZOA (Sect. 10.).
7. Far infrared surveys
In 1983, the Infrared Astronomical Satellite IRAS surveyed 96% of the whole sky in the far infrared bands at 12, 25, 60 and 100 m, resulting in a catalog of 250 000 point sources, i.e. the IRAS Point Source Catalogue (IRAS PSC; Joint IRAS Science Working Group 1988). The latter has been used extensively to quantify extragalactic large-scale structures. The identification of the galaxies from the IRAS data base is quite different compared to the optical: only the fluxes at the 4 far infrared (FIR) IRAS passbands are available but no images, and the identification of galaxies is strictly based on the flux ratios. For instance, Yamada et al. (1993) used the criteria: 1. Jy, 2. , 3. , to select galaxy candidates from the IRAS PSC.
With these flux and color criteria, mainly normal spiral galaxies and starburst galaxies are identified. Hardly any dwarf galaxies enter the IRAS galaxy sample, nor the dustless elliptical galaxies, as they do not radiate in the far infrared. The upper cut-off in the third criterion is imposed to minimize the contamination with cool cirrus sources and young stellar objects within our Galaxy. This, however, also makes the IRAS surveys less complete for nearby galaxies (e.g. Woudt 1998, Kraan-Korteweg 2000).
The advantage of using IRAS data for large-scale structure studies is its homogeneous sky coverage (all data from one instrument) and the negligible effect of the extinction on the flux at these long wavelengths. Even so, it remains difficult to probe the inner part of the ZOA with IRAS data because of cirrus, high source counts of Galactic objects in the Galaxy, and confusion with these objects – most of them have the same IRAS characteristics as external galaxies. The difficulty in obtaining unambiguous galaxy identifications at these latitudes was demonstrated by Lu et al. (1990), who found that the detection rate of IRAS galaxy candidates decreases strongly as a function of Galactic latitude (from to ). This can only be explained by the increase in faulty IRAS galaxy identifications. Yamada et al. (1993) also found a dramatic and unrealistic increase in possible galaxies close to the Galactic Plane in their systematic IRAS galaxy survey of the southern Milky Way ().
So, despite the various advantages given with IRAS data, the sky coverage in which reliable IRAS galaxy identifications can be made (84%) provides only a slight improvement over optical galaxy catalogs (compare e.g. the light-grey mask in Fig. 8 with the optical ZOA-contour as displayed in Fig. 1). In addition to that, the density enhancements are very weak in IRAS galaxy samples because (a) the IRAS luminosity function is very broad, which results in a more diluted distribution since a larger fraction of distant galaxies will enter a flux-limited sample compared to an optical galaxy sample, and (b) IRAS is insensitive to elliptical galaxies, which reside mainly in galaxy clusters, and mark the peaks in the mass density distribution of the Universe. This is quite apparent when comparing the IRAS galaxy distribution (Fig. 8) with the optical galaxy distribution (Fig. 1 and Fig. 4).
Nevertheless, dedicated searches for large-scale clustering within the whole ZOA () have been made by various Japanese collaborations (see Takata et al. 1996 for a summary). They used IRAS color criteria to select galaxy candidates which were subsequently verified through visual examination on sky surveys, such as the POSS for the northern hemisphere and the ESO/SRC for the southern sky. Because of their verification procedure, this data-set suffers, however, from the same limitations in highly obscured regions as optical surveys.
Based on redshift follow-ups of these ZOA IRAS galaxy samples, they established various filamentary features and connections across the ZOA. Most coincide with the structures uncovered in optical work. In the northern Milky Way, both crossings of the Perseus-Pisces arms into the ZOA are very prominent – considerably stronger in the FIR than at optical wavelengths – and they furthermore identified a new structure: the Cygnus-Lyra filament at ( km s-1). Across the southern Milky Way they confirmed the three general concentrations of galaxies around Puppis (), the Hydra–Antlia extension (; Kraan-Korteweg et al. 1995) and the Centauraus Wall (). However, the cluster A3627 is not seen, nor is the Great Attractor very prominent compared to the optical or to the POTENT reconstructions described in Sect. 10..
Besides the search for the continuity of structures across the Galactic Plane, the IRAS galaxy samples have been widely used for the determination of the peculiar motion of the Local Group, as well as the reconstructions of large-scale structure across the Galactic Plane (see Sect. 10.). These analyses have been performed on the two-dimensional IRAS galaxy distribution and, in recent years, as well as on their distribution in redshift space through the availability of redshift surveys for progressively deeper IRAS galaxy samples, i.e. 2658 galaxies to f Jy (Strauss et al. 1992), 5321 galaxies to f Jy (Fisher et al. 1995), and lately the PSCz catalog of 15411 galaxies complete to f Jy with 84% sky coverage and a depth of 20000 km s-1 (Saunders et al. 2000b).
The PSCz is deep enough to test the convergence of the dipole. The most recent analysis of the IRAS PSCz dipole (Schmoldt et al. 1999; see also Rowan-Robinson et al. 2000) finds that the acceleration vector points about away from the CMB dipole. Assuming full convergence at the sample boundary, about 2/3 of the measured acceleration is generated within 4000 km s-1. There is a non-negligible contribution out to 14000 km s-1, after which the acceleration amplitude seems to have converged.
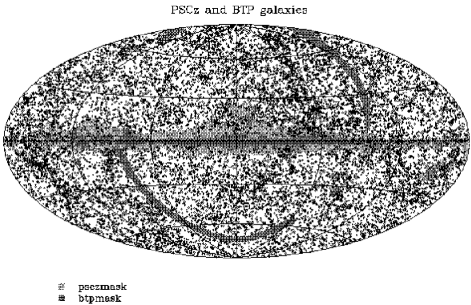
Saunders and collaborators realized, however, that the 16% of the sky missing from the survey causes significant uncertainty, particularly because of the location behind the Milky Way of many of the prominent large-scale structures (superclusters as well as voids). In 1994, they therefore started a longterm program to increase the sky coverage of the PSCz. Optimizing their color criteria to minimize contamination by Galactic sources (, , and ), they extracted a further 3500 IRAS galaxy candidates at lower Galactic latitudes (light-grey area of Fig. 8). Taking band snapshots of all the galaxy candidates of their ‘Behind The Plane’ [BTP] survey, they could add a thousand galaxies to the PSCz sample and reduce the coverage gap to a mere 7% (dark-grey area).
The resulting sky map of 16,400 galaxies (PSCz plus BTP) is shown in Fig. 8 (from Saunders et al. 2000a). The BTP survey has reduced the “IRAS ZOA” dramatically. Some incompleteness remains towards the Galactic Center, but large-scale structures can easily be identified across most of the Galactic Plane. In the Great Attractor region, the galaxies can be traced (for the first time with IRAS data) to the rich cluster A3627 – the suspected core of the GA (Kraan-Korteweg et al. 1996). The BTP collaboration is currently working hard on obtaining redshifts for these new and heavily obscured galaxies and exciting new results on large-scale structure across the Milky Way and dipole determinations can be expected in the near future.
8. HI surveys
In the regions of the highest obscuration and infrared confusion, the Galaxy is fully transparent to the 21cm line radiation of neutral hydrogen. H I-rich galaxies can readily be found at lowest latitudes through the detection of their redshifted 21cm emission, though early-type galaxies – tracers of massive groups and clusters – are gas-poor and will not be identified in these surveys. Furthermore, low-velocity extragalactic sources (blue- and red-shifted) within the strong Galactic H I emission will be missed, and galaxies close to radio continuum sources may also be missed because of baseline ripples.
The advantage of blind H I surveys in the Milky Way is not only the transparency of the 21cm radiation to the thickest dust layers: with the detection of an H I signal, the redshift and rotational properties of an external galaxy are immediately known, providing insight not only on its location in redshift space but also on the intrinsic properties of such obscured galaxies. The rotational velocity can furthermore be used in combination with e.g. NIR photometry (Sect. 6.3.) to determine the distribution in real space from Tully – Fisher relation distances and the density field independent of interpolations across the Milky Way from the peculiar velocity field.
Until recently, radio receivers were not sensitive and efficient enough to attempt large systematic surveys of the ZOA. But in a pilot survey, Kerr & Henning (1987) pointed the late 300-ft telescope of Green Bank to 1900 locations in the ZOA (1.5% coverage) and detected 19 previously unknown spiral galaxies, proving therewith the effectiveness of this approach.
Since then two systematic blind H I searches for galaxies behind the Milky Way were initiated. The first – the Dwingeloo Obscured Galaxies Survey (DOGS) – used the 25 m Dwingeloo radio to survey the whole northern Galactic Plane for galaxies out to 4000 km s-1 (cf. Kraan-Korteweg et al. 1994b, Henning et al. 1998, Rivers et al. 1999). Although the sensitivity was fairly low (40 mJy for a 1 hr integration), the advantage of the small telescope aperture is rapid areal coverage.
A more sensitive survey, probing a considerably larger volume (out to 12700 km s-1), is being performed for the southern Milky Way with the 64 m radio telescope of Parkes (Kraan-Korteweg et al. 1998a, Staveley-Smith et al. 1998, Henning et al. 1999, 2000). A Multibeam (MB) receiver with 13 beams in the focal plane array (Staveley-Smith 1996) was specifically constructed to efficiently search for galaxies not identified in optical surveys because of low optical surface brightness or high optical extinction.
In the following, the observing techniques of these two surveys as well as the first results will be discussed.
8.1. The Dwingeloo Obscured Galaxies Survey (DOGS)
Since 1994, the Dwingeloo 25 m radio telescope has been dedicated to a systematic search for galaxies in the northern Zone of Avoidance (, ). The last few patches of the survey were completed early 1999 using the Westerbork array in total power mode. The 20 MHz bandwidth was tuned to cover the velocity range km s-1. Negative velocities were excluded because the Leiden/Dwingeloo Galactic H I survey (Hartmann 1994, Hartmann & Burton 1997) had already covered the velocity range km s-1, albeit with higher rms.
The 25 m Dwingeloo telescope has a half-power-beamwidth (HPBW) of 36 arcmin. With a DAS-1000 channel autocorrelator spectrometer at the telescope backend, the coverage over the 20 MHz bandwidth resulted in a velocity resolution of 4 km s-1. With this resolution even the galaxies with the narrowest linewidth are covered by several channels. The 15000 survey points are ordered in a honeycomb pattern with a grid spacing of . Galaxies are generally detected in various adjacent pointings, facilitating a more accurate determination of their positions through interpolations. Each DOGS observation consisted of a sequence of 5 contiguous pointings at constant Galactic latitude. From this, 5 On-Off pairs were created in such a way that a real galaxy will appear once as a positive and once as a negative signal in two independent scans. The rms noise per channel typically was mJy for a 1 hr integration (12 x 5min).
Because of the duration of the project (15000 hours not including overhead and downtime) the strategy was to first conduct a fast search of 5min integrations ( mJy) to uncover possible massive nearby galaxies whose effect might yield important clues to the dynamics of the Local Group. In the following, the results from the Dwingeloo shallow and deep surveys are discussed.
The shallow Dwingeloo survey and the discovery of Dwingeloo 1
The shallow Dwingeloo search ( mJy) has been completed in 1996 yielding five objects (Henning et al. 1998), three of which were known previously. The most exciting discovery was the barred spiral galaxy Dwingeloo 1 (Kraan-Korteweg et al. 1994b).
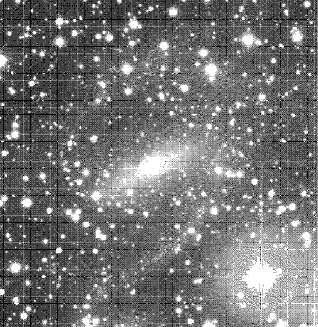
This galaxy candidate was detected early on in the survey through a strong signal (peak intensity of 1.4 Jy) at the very low redshift of km s-1 in the spectra of four neighbouring pointings, suggestive of a galaxy of large angular extent. The optimized position of coincided with a very low surface brightness feature on the Palomar Sky Survey plate of , detected earlier by Hau et al. (1995) in his optical galaxy search of the northern Galactic/Supergalactic Plane crossing (cf. Sect. 5.2.). Despite foreground obscuration of about 6m in the optical, follow-up observations in the , and band at the INT (La Palma) confirmed this galaxy candidate as a barred, possibly grand-design spiral galaxy of type SBb of 4.2 x 4.2 arcmin (cf. Fig. 9).
Dwingeloo 1 has been the subject of many follow-up observations (optical: Loan et al. 1996; Buta & McCall 1999; HI-synthesis: Burton et al. 1996; CO observations: Kuno et al. 1996; Li et al. 1996; Tilanus & Burton 1997; X-ray: Reynolds et al. 1997). To summarize, Dwingeloo 1 is a barred spiral, with a rotation velocity of 130 km s-1, implying a dynamical mass of roughly one-third the mass of the Milky Way (within the same fixed radius). Its approximate distance of 3 Mpc and angular location place it within the IC342/Maffei group of galaxies. The follow-up HI synthesis observations (Burton et al. 1996) furthermore revealed a counterrotating dwarf companion, Dwingeloo 2. Since then various further dwarf galaxies have been discovered in this nearby galaxy group (next section).
The deep Dwingeloo survey
Currently, 60% of the deeper Dwingeloo survey ( mJy) have been analyzed resulting in 36 detected galaxies, 23 of which were previously unknown (Rivers et al. 1999). Five of the 36 sources were originally identified in the shallow survey. Based on the survey sensitivity, the registered number of galaxies is in agreement with the Zwaan et al. (1997) HI mass function which predicts 50 to 100 detections for the full survey.
The distribution of the Dwingeloo galaxies is shown in Fig. 10 together with other known galaxies out to 4000 km s-1 for visualization of connectivity of structures across the Galactic Plane. Indeed, various known structures appear continuous across the GP, although two galaxies were also found in the Local Void (). The latter two were independently detected in the Parkes MB ZOA survey (Sect. 8.2., and Henning et al. 1999, 2000) and seem to be part of the by Roman et al. (1998) recently discovered clustering at 1500 km s-1(Sect. 5.4.).

11 galaxies were discovered in the Supergalactic Plane crossing region (), five of which in the nearby IC342/Maffei group: Dwingeloo 1, Maffei 2 from the shallow survey, plus three dwarf members. Further group members have been detected through infrared photometry (McCall & Buta 1995), and pointed observations with the 100 m radiotelescope at Effelsberg of optically identified dwarf candidates (Huchtmeier et al. 2000). The total number of obscured IC342/Maffei group members has meanwhile grown to 19 members (for recent updates on this group see Huchtmeier et al. 2000; Buta & McCall 1999). Photometric distances have been derived for 10 of these galaxies (Karachentsev & Tikhonov 1993, 1994; Karachentsev et al. 1997), putting the group at a mere distance of Mpc. At such a close distance, this group might have played a significant role in the dynamical history of the Local Group (McCall 1986, 1989; Zheng et al. 1991; Valtonen et al. 1993; Peebles 1994; see Sect. 3.3.).
Suprisingly three dwarf galaxies were detected close to the nearby isolated galaxy NGC 6946 at ( km s-1). One of these had earlier been cataloged as a compact high-velocity cloud (Wakker 1990). Burton et al. (1999), in their search for compact isolated high-velocity clouds in the Dwingeloo/Leiden Galactic H I survey, discovered a further member of this galaxy concentration. Now, seven galaxies with recessional velocities of km s-1 have been identified within of the galaxy NGC 6946. More might be discovered as the DOGS data in this region have not yet been fully analyzed (Fig. 10). The agglomeration of these various galaxies might indicate a group or cloud of galaxies in the nearby Universe. As such it would be the only galaxy group in the nearby Universe that is strongly offset (by ) from the Supergalactic Plane (Tammann & Kraan-Korteweg 1978, Kraan-Korteweg 1979).
The most significant nearby, previously unknown galaxy identified with DOGS was Dwingeloo 1. Given the 80% coverage of the survey region by the shallow survey (Henning et al. 1998), chances are low that a massive nearby spiral was missed, since nearby galaxies appear in many adjacent pointings, all of which would have to be missed for the galaxy to escape detection. Thus, it is fairly unlikely that there exists another previously unidentified massive spiral galaxy in the area covered by the survey.
8.2. The Parkes Multibeam ZOA blind HI survey
In March 1997, the systematic blind H I survey in the southern Milky Way (; ) began with the Multibeam receiver at the 64 m Parkes telescope. The instrument has 13 beams, each detecting orthogonal linear polarization. The beams of are arranged in a hexagonal grid in the focal plane (cf. Staveley-Smith et al. 1996), allowing rapid sampling of large areas. The average system temperature is about 20 K.
The observations are being performed in driftscan mode. 23 contiguous fields of length have been defined. Each field is being surveyed along constant Galactic latitudes with latitude offsets of 35 arcmin until the final width of has been attained (17 passages back and forth). The ultimate goal is to have 25 repetitions per field where each repetition will furthermore be offset in latitude by for homogeneous sampling. With an effective integration time of 25 min/beam, a 3 detection limit of 25 mJy is obtained. The survey covers the velocity range km s-1 with a channel spacing of 13.2 km s-1 per channel, and will be sensitive to normal spiral galaxies well beyond the Great Attractor region. As a byproduct, the survey will produce a high resolution integrated H I column density map of the southern Milky Way and a detailed catalog of high velocity clouds (cf. Putman et al. 1998).
So far, a shallow survey (next section) covering the whole southern Milky Way, based on 2 out of the 25 foreseen driftscan passages, has been analyzed (cf. Kraan-Korteweg et al. 1998a; Henning et al. 1999, 2000). A detailed study of the Great Attractor region () based on 4 scans has been made (Juraszek 1999; Juraszek et al. 2000). The first four full-sensitivity cubes are available for that region as well (Sect. 8.2.).
The Parkes ZOA MB shallow survey
In the shallow survey, 110 galaxies were cataloged with peak H I-flux densities of 80 mJy ( mJy after Hanning smoothing). The detections show no dependence on Galactic latitude, nor on the amount of foreground obscuration through which they have been detected. Though galaxies up to 6500 km s-1 were identified, most of the detected galaxies (80%) are quite local ( km s-1) due to the (yet) low sensitivity. About one third of the detected galaxies have a counterpart either in NED or in the deep optical surveys.
The distribution of the 110 H I-detected galaxies is displayed in the lower panel of Fig. 11. It demonstrates convincingly that galaxies can be traced through the thickest extinction layers of the Galactic Plane. The fact that hardly any galaxies are found behind the Galactic bulge ( to ) is due to local structure: this is the region of the Local Void (see discussion below and top panel of Fig. 12).
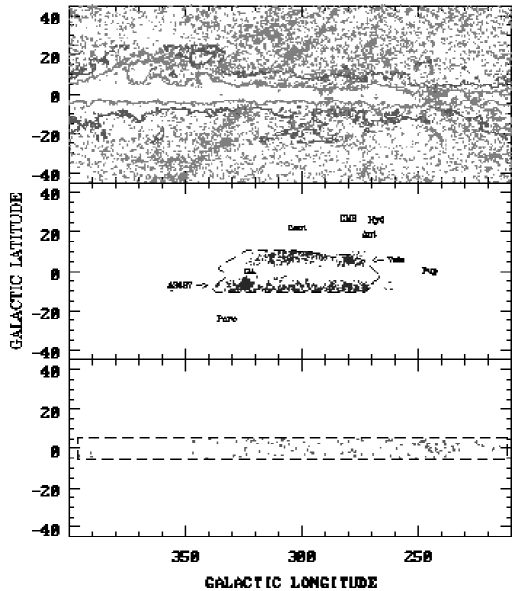
For comparative purposes, the top panel of Fig. 11 shows the distribution of all galaxies with known velocities v km s-1 to date (extracted from the LEDA database). Although this constitutes an uncontrolled sample it traces the main structures in the nearby Universe in a representative way. Note the increasing incompleteness for extinction levels of (outer contour) – reflecting the growing incompleteness of standard galaxy catalogs (see Sect. 5. and Fig. 1) – and the almost complete lack of galaxy data for extinction levels (inner contour). The middle panel shows galaxies with v10000 km s-1 from the follow-up observations of the deep optical galaxy search by Kraan-Korteweg and collaborators (Sect. 5.4.). Various new overdensities are apparent at low latitudes but the innermost part of our Galaxy remains obscured with this approach. Here, the blind H I data (lower panel) finally can provide the missing link for LSS studies.
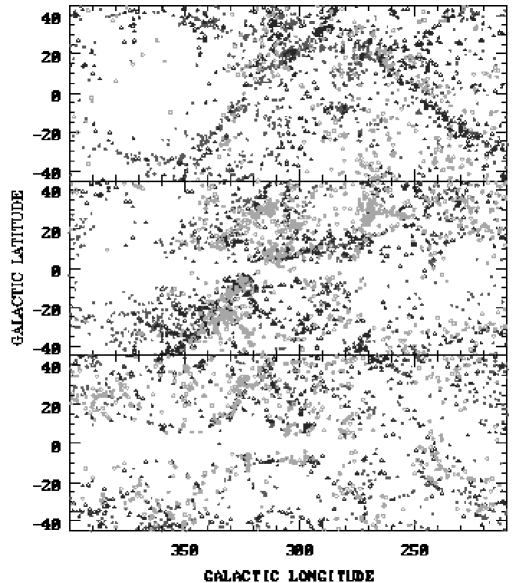
In Fig. 12, the data of Fig. 11 are combined in redshift slices. The achieved sensitivity of the shallow MB H I-survey fills in structures all the way across the ZOA for the upper panel ( 3500 km s-1) for the first time. Note the continuity of the thin filamentary sine-wave-like structure that dominates the whole southern sky and crosses the Galactic equator twice. This structure snakes over through the southern sky. Taking a mean distance of Mpc, this implies a linear size of Mpc, with thickness of ’only’ Mpc or less. Various other filaments spring forth from this dominant filament, always from a rich group or small cluster at the junction of these interleaving structures. This feature is very different from the thick, foamy Great Wall-like structure, the GA, in the middle panel.
Also note the prominence of the Local Void which is very well delineated in this presentation. No low redshift galaxies were found within the Local Void. But three newly identified galaxies at help to define the boundary of the Void.
The full-sensitivity ZOA MB-survey will fill in the LSS in the more distant panels of Fig. 12. First results of the full sensitivity survey have been obtained in the Great Attractor region (next section).
Three nearby, very extended ( to ) galaxies were discovered in the shallow survey. Being likely candidates of dynamically important galaxies, immediate follow-up observations were initiated at the ATCA. These objects did not turn out to be massive perturbing monsters, however. Two were seen to break up into H I complexes and have unprecedented low H I column densities (Staveley-Smith et al. 1998). Systematic synthesis observations are being performed to investigate the frequency of these interacting and/or low H I column density systems in this purely H I-selected sample.
The Parkes ZOA MB deep survey
Four cubes centered on the Great Attractor region (, ) of the full-sensitivity survey have been analyzed (Juraszek et al. 2000). 236 galaxies above the detection level of 25 mJy have been uncovered. 70% of the detections had no previous identification.
In the left panel of Fig. 13, a sky distribution centered on the GA region displays all galaxies with redshifts km s-1. Next to redshifts from the literature (LEDA), redshifts from the follow-up observations of Kraan-Korteweg and collaborators in the Hyd/Ant-Crux-GA ZOA surveys (dashed area) are plotted. They clearly reveal the prominence of the cluster A3627 at km s-1; Kraan-Korteweg et al. 1996) close to the core of the GA region at km s-1), (Kolatt et al. 1995). Adding now the new detections from the systematic blind H I MB-ZOA survey (box), structures can be traced all the way across the Milky Way. The new picture seems to support that the GA overdensity is a “great-wall” like structure starting close to the Pavo cluster, having its core at the A3627 cluster and then bending over towards shorter longitudes across the ZOA.
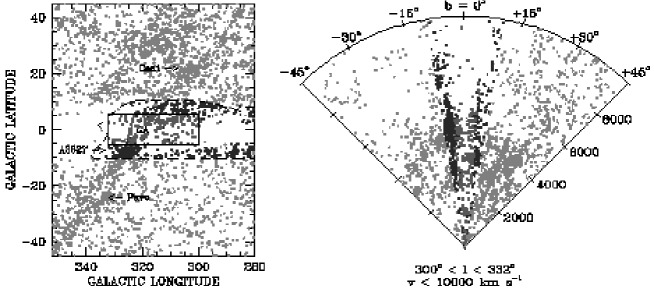
This becomes even clearer in the right panel of Fig. 13 where the galaxies are displayed in a redshift cone out to km s-1 for the longitude range analyzed so far of the MB full-sensitivity data. The A3627 cluster is clearly the most massive galaxy cluster uncovered by the combined surveys in the GA region and therefore the most likely candidate for the previously unidentified but predicted density-peak at the bottom of the potential well of the GA overdensity.
The new data do not unambigously confirm the existence of the suspected further cluster around the bright elliptical radio galaxy PKS1343601 (Sect. 5.4.). Although the MB data reveal an excess of galaxies at this position in velocity space ( km s-1) a “finger of God” is not seen. It could be that many central cluster galaxies are missed by the H I observations because spiral galaxies generally avoid the cores of clusters. The reality of this possible cluster still remains a mystery. A first glimpse of the -band images obtained by Woudt et al. (in progress) reveal various early-type galaxies. The forthcoming analysis should then unambiguously settle the question whether another cluster forms part of the GA overdensity.
8.3. Conclusions
The systematic probing of the galaxy distribution in the most opaque parts of the ZOA with H I surveys have proven very powerful. For the first time LSS could be mapped without hindrance across the Milky Way (Figs. 10, 12 and 13). This is the only approach that easily uncovers the galaxy distribution in the ZOA, allows the confirmation of implied connections and uncovers new connections behind the Milky Way.
From the analysis of the Dwingeloo survey and the shallow Parkes MB ZOA survey, it can be maintained that no Andromeda-like or other H I-rich galaxy is lurking undetected behind the deepest extinction layers of the Milky Way (although gas-poor, early-type galaxies might, of course, still remain hidden, like the recently discovered very local dwarf behind the Galactic bulge, Sect. 5.5.). The census of dynamically important, H I-rich nearby galaxies whose gravitational influence could significantly impact peculiar motion of the Local Group or its internal dynamics is now complete – at least for objects whose signal is not drowned within the strong Galactic H I emission. Simulations are currently being devised to investigate what kind of H I galaxies – whose signals lie within the frequency range of the Milky Way’s H I – could still have been missed.
9. X-ray surveys
The X-ray band potentially is an excellent window for studies of large-scale structure in the Zone of Avoidance, because the Milky Way is transparent to the hard X-ray emission above a few keV, and because rich clusters are strong X-ray emitters. Since the X-ray luminosity is roughly proportional to the cluster mass as or , depending on the still uncertain scaling law between the X-ray luminosity and temperature, massive clusters hidden by the Milky Way should be easily detectable through their X-ray emission.
This method is particularly attractive, because clusters are primarily composed of early-type galaxies which are not recovered by IRAS galaxy surveys (Sect. 7.) or by systematic H I surveys (Sect. 8.). Even in the NIR, the identification of early-type galaxies becomes difficult or impossible at the lowest Galactic latitudes because of the increasing extinction and crowding problems (Sect. 6.). Rich clusters, however, play an important role in tracing large-scale structures because they generally are located at the center of superclusters and Great Wall-like structures. They mark the density peaks in the galaxy distribution and – with the very high mass-to-light ratios of clusters – the deepest potential wells within these structures. Their location within these overdensities will help us understand the observed velocity flow fields induced by these overdensities.
The X-ray all-sky surveys carried out by Uhuru, Ariel V, HEAO-1 (in the keV band) and ROSAT ( keV) provide an optimal tool to search for clusters of galaxies at low Galactic latitude. However, confusion with Galactic sources such as X-ray binaries and Cataclysmic Variables may cause serious problems, especially in the earlier surveys (Uhuru, Ariel V and HEAO-1) which had quite low angular resolution. And although dust extinction and stellar confusion are unimportant in the X-ray band, photoelectric absorption by the Galactic hydrogen atoms – the X-ray absorbing equivalent hydrogen column density – does limit detections close to the Galactic Plane. The latter effect is particularly severe for the softest X-ray emission, as e.g. observed by ROSAT ( keV) compared to the earlier keV missions. On the other hand, the better resolution of the ROSAT All Sky Survey (RASS) compared to the HEAO-1 survey will reduce confusion problems with Galactic sources as happened, for example, in the case of the cluster A3627 (see below).
Until recently, the possibility of searching for galaxy clusters behind the Milky Way through their X-ray emission has not been pursued in a systematic way, even though a large number of X-ray bright clusters are located at low Galactic latitudes (Fabian 1994): for instance, four of the seven most X-ray luminous clusters in the 2–10 keV range, the Perseus, Ophiuchus, Triangulum Australis, and PKS 0745191 clusters ( erg s-1) lie at latitudes below (Edge et al. 1990).
A first attempt to identify galaxy clusters in the ZOA through their X-ray emission had been made by Jahoda and Mushotzky in 1989. They used the HEAO-1 all-sky data to search for X-ray-emission of a concentration of clusters or one enormous cluster that might help explain the shortly before discovered large-scale deviations from the Hubble flow that were associated with the Great Attractor. Unfortunately, this search missed the 6th brightest cluster A3627 in the ROSAT X-ray All Sky Survey (Böhringer et al. 1996, Tamura et al. 1998) which had been identified as the most likely candidate for the predicted but unidentified core of the Great Attractor (Kraan-Korteweg et al. 1996). A3627 was not seen in the HEAO-1 data because of the low angular resolution and the confusion with the neighbouring X-ray bright, Galactic X-ray binary 1H1556605 (see Fig. 8 and 9 in Böhringer et al. 1996).
9.1. CIZA: Clusters in the Zone of Avoidance
Since 1997, a group led by Ebeling (Ebeling et al. 1999, 2000) have systematically searched for bright X-ray clusters of galaxies at . Starting from the ROSAT Bright Source Catalog (BSC, Voges et al. 1999) which lists the 18811 X-ray brightest sources detected in the RASS, they apply the following criteria to search for clusters: (a) , (b) an X-ray flux above erg cm-2 s-1 (the flux limit of completeness of the ROSAT BCS), and (c) a spectral hardness ratio. Ebeling et al. demonstrated in 1998 that the X-ray hardness ratio is very effective in discriminating against softer, non-cluster X-ray sources. With these criteria they selected a candidate cluster sample which, although at this point still highly contaminated by non-cluster sources, contains the final CIZA cluster sample.
They first cross-identified their 520 cluster candidates against NED and SIMBAD, and checked unknown ones on the Digitized Sky Survey. The new cluster candidates, including known Abell clusters without photometric and spectroscopic data, were imaged in the band, respectively in the band in regions of high extinctions. With the subsequent spectroscopy of galaxies around the X-ray position, the real clusters could be confirmed.
Time and funding permitting, the CIZA team plans to extend their cluster survey to lower X-ray fluxes ( erg cm-2 s-1), the aim being a total sample of 200 X-ray selected clusters at .
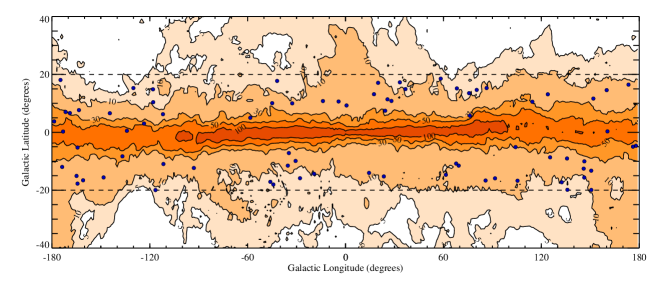
So far, 76 galaxy clusters were identified within of which 80% were not known before. Their distribution is displayed in Fig. 14 (reproduced from Ebeling et al. 2000). 14 of these clusters are relatively nearby (), and one was uncovered within the Perseus-Pisces chain at a latitude of only .
9.2. Conclusions
With the discovery of 76 clusters so far, of which only 20% were known before, Ebeling et al. (2000) have proven the strength of the method to use X-ray criteria to search for galaxy clusters in the ZOA. As mentioned in the introduction to this section, this approach is complementary to searches at other wavelengths which all fail to uncover galaxy clusters at very low Galactic latitudes.
Having used the ROSAT BSC to select their cluster candidates, the CIZA collaboration wants to combine their final cluster sample with other X-ray selected cluster samples from the RASS, such as the ROSAT Brightest Cluster Sample at and (Ebeling et al. 1998) and the REFLEX sample at and (Böhringer et al. in prep.). The resulting, all-sky cluster list will be ideally suited to study large-scale structure and the connectivity of clusters across the Galactic Plane.
10. Statistical reconstructions
Where the Zone of Avoidance cannot be observed directly, the alternative is to reconstruct the structure in a statistical way. Corrections for unobserved regions in catalogs were done, somewhat ad-hoc, by populating the ZOA uniformly according to the mean density, or by interpolating the structure below and above the Galactic Plane (e.g. Lynden-Bell et al. 1989; Yahil et al. 1991; Strauss et al. 1992; Hudson 1992). Other authors utilized statistical methods such as Wiener filtering (see below) to recover an all-sky density field (Lahav et al. 1994; Hoffman 1994; Fisher et al. 1995; Zaroubi et al. 1995). The recovery of a signal from noisy and incomplete data is a classic problem of inversion, common in problems of image processing. A straightforward inversion is often unstable, and a regularization scheme of some sort is essential in order to interpolate where data are missing or noisy. In the Bayesian spirit, one can use raw data and a prior model to produce an “optimal reconstruction”. Using the above principle, one can derive the Wiener filter (the ratio of signal to signal+noise), which also follows from requiring minimum variance (e.g. Rybicki & Press 1992). The formalism of Wiener filtering is given in Appendix A.
10.1. Mask inversion using Wiener filtering in spherical harmonic analysis
It is convenient to expand the galaxy distribution in a nearly whole-sky survey in spherical harmonics. This was applied to 2-D (i.e. projected on the sky) samples (e.g. Peebles 1973; Scharf et al. 1992) and to redshift and peculiar velocity surveys (e.g. Regös & Szalay 1989; Scharf & Lahav 1993; Lahav et al. 1994; Fisher et al. 1994; Nusser & Davis 1994; Fisher et al. 1995; Heavens & Taylor 1995). In projection, the density field over is expanded as a sum:
where the ’s are the orthonormal set of spherical harmonics and and are the spherical polar angles.
The problem of reconstructing large-scale structure behind the ZOA can be formulated as follows: what are the full-sky, noise-free harmonic coefficients given the observed harmonics, the mask describing the unobserved region, and a prior model for the power-spectrum of fluctuations? In a projected catalog the observed harmonics (with the masked regions filled in uniformly according to the mean) are related to the underlying ‘true’ whole-sky harmonics by (see Peebles 1980)
where the monopole term () is excluded. The Poisson shot-noise is added to the number-weighted harmonics ’s. The noise variance is estimated as (the mean number of galaxies per steradian, independent of ) The harmonic transform of the mask, , introduces ‘cross-talk’ between the different harmonics.
It can be shown (Lahav et al. 1994; Zaroubi et al. 1995) that the solution of this inversion problem is
where the vectors and represent the sets of harmonics and , with the diagonal Wiener matrix
Here is the cosmic variance in the harmonics, which depends on the power-spectrum. In the special case of an underlying Gaussian field the most probable field, the mean field, and the minimum variance Wiener filter all are identical. The scatter in the reconstruction can be written analytically for Gaussian random fields.
Even if the sky coverage is (), the Wiener filter is essential to reveal the optimal underlying continuous density field, cleaned of noise. In the absence of other prior information on the location of clusters and voids, the correction factor is ‘isotropic’ per , i.e. independent of . So, in the case of full sky coverage, only the amplitudes are affected by the correction, but not the relative phases. For example, the dipole direction is not affected by the shot-noise, only its amplitude. But if the sky coverage is incomplete, both the amplitudes and the phases are corrected. The reconstruction also depends on number of observed and desired harmonics. Note also that the Wiener method is non-iterative.
10.2. Reconstruction of the projected IRAS 1.2 Jy galaxy distribution
Lahav et al. (1994) applied the method to the sample of IRAS galaxies brighter than 1.2 Jy which includes 5313 galaxies, and covers 88% of the sky. This incomplete sky coverage is mainly due to the Zone of Avoidance, which they modelled as a ‘sharp mask’ at Galactic latitude . The mean number of galaxies is per steradian, which sets the shot-noise, . As the model for the cosmic scatter , they adopted a fit to the observed power spectrum of IRAS galaxies.
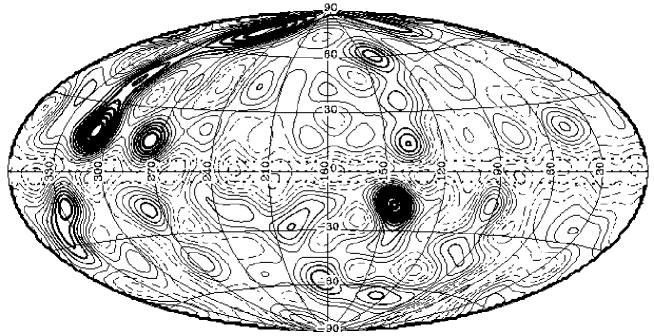
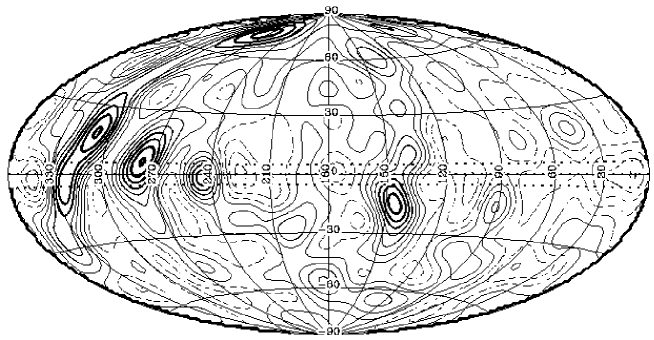
Fig. 16 shows the reconstruction of the projected IRAS 1.2 Jy sample. The ZOA was left empty, and it clearly ‘breaks’ the possible chain of the Supergalactic Plane and other structures. Fig. 16 shows our optimal reconstruction for . Now the structure is seen to be connected across the ZOA, in particular in the regions of Centaurus/Great Attractor (), Hydra () and Perseus-Pisces (), confirming the connectivity of the Supergalactic Plane. Note that Figs. 16 and 16 are shifted by compared to the earlier sky projections. We also see the Puppis cluster () recovered behind the Galactic Plane. This cluster was noticed in earlier harmonic expansion (Scharf et al. 1992) and further studies (Lahav et al. 1993). The other important feature of this reconstruction is the suppression of shot noise all over the sky. This is particularly important for judging the reality of clusters and voids.
Comparison of this Wiener reconstruction with the one applied (using a Wiener filter) to the IRAS sample, in which the ZOA was filled in ‘by hand’ across the Galactic Plane (Yahil et al. 1991), shows good agreement. By testing the method on -body simulations (where the whole ‘sky’ true harmonics are known) it was found, that for masks larger than , it is difficult to recover the unobserved structure. In this case extra-regularization was required. The success of the method depends on the interplay of three angular scales: the width of the mask, the desired resolution () and the physical correlation of structure. It is important to note that, as opposed to ad-hoc smoothing schemes, the smoothing due to a Wiener filter is determined by the sparseness of data relative to the expected signal.
10.3. 3-D reconstruction
Fisher et al. (1995) generalized the 2-D Wiener reconstruction to 3-D (i.e. for redshift catalogs) by expanding the density field in redshift-space in terms of spherical harmonics, , and radial Bessel functions :
The discrete ’s are chosen according to the boundary conditions, so as to make the set orthogonal. This process is analogous to Fourier decomposition, but uses instead a set of spherical basis functions. The data from a redshift catalog can be seen as a set of discrete points, , each giving the direction and redshift of a galaxy. These are used to estimate the underlying density field in redshift space, , expanded as in the above equation. Here, are normalization constants, while the harmonic coefficients are given by
where is the spherical selection function of the survey, evaluated at the radius of the galaxy. The real-space density, velocity and potential fields are then reconstructed using linear theory and a Wiener filter.
In analogy with the 2-D case, a mask (e.g. to describe the ZOA) can be formulated in the 3-D harmonic formalism (Heavens & Taylor 1995; Schmoldt et al. 2000). However, for the simplicity of the analysis, Fisher et al. (1995) first populated the ZOA with mock galaxies according to the procedure of Yahil et al. (1991), and then applied the reconstruction over the full sky. Webster et al. (1997) and Schmoldt et al. (2000) extended this analysis and presented detailed maps of the reconstructed fields, as well as optimal determinations of the Local Group dipole and bulk flows. Lahav et al. (2000) used Wiener filtering to study the the extent of the Supergalactic Plane. Bistolas (1998) has done a similar Wiener reconstruction in Cartesian coordinates (see discussion below). Saunders et al. (2000a) have extended the spherical harmonics and Wiener approach to represent non-linear clustering by describing the density field as drawn from a log-normal probability distribution function. They recently applied it to the PSCz IRAS catalog (taking into account the detailed IRAS mask, see Fig. 8). This type of analysis, when applied to other surveys at low latitude, can potentially provide the most detailed and self-consistent map of the ZOA.
10.4. POTENT reconstruction of the ZOA
The POTENT method (Bertschinger & Dekel 1989; Dekel 1994) recovers the smoothed fluctuations field of potential, velocity and mass density from observed radial peculiar velocities of galaxies. The velocity field is recovered under the assumption of potential flow, . The potential can thus be calculated by integrating the radial velocity along radial rays. Differentiating in the transverse directions recovers the two missing velocity components. The underlying mass-density fluctuation is then derived in linear theory from (or from non-linear extensions). This method is very useful for exploring the ZOA as the peculiar velocity field responds to the entire mass distribution, regardless of the ‘unseen’ distribution of light. However, due to the heavy smoothing required by this method, only structures on large scales (e.g. superclusters) can be mapped. Individual (massive) nearby galaxies that may perturb the dynamics in the vicinity of the Local Group cannot be uncovered in this manner. Kolatt et al. (1995) used the POTENT method to specifically predict the mass distribution behind the ZOA (see Fig. 18). Some of their predictions are summarized below.
Zaroubi et al. (1999) analyzed the peculiar velocity field using Wiener filtering. The reconstructed structures are consistent with those extracted by the POTENT method. A comparison with the structures in the distribution of IRAS 1.2 Jy galaxies yields a general agreement.
Figure 17 shows an Aitoff projection in Galactic coordinates of reconstrucion at Mpc from the three velocity catalogs: Mark III (Willick et al. 1997), SFI (Survey of Field Spirals in the I-band; da Costa et al. 1996; Giovanelli et al. 1998) and ENEAR (the ESO Nearby Early-type Galaxies Survey; da Costa et al. 2000a, 2000b). For further discussion of the Wiener reconstruction of the ZOA from velocities see Hoffman (2000).
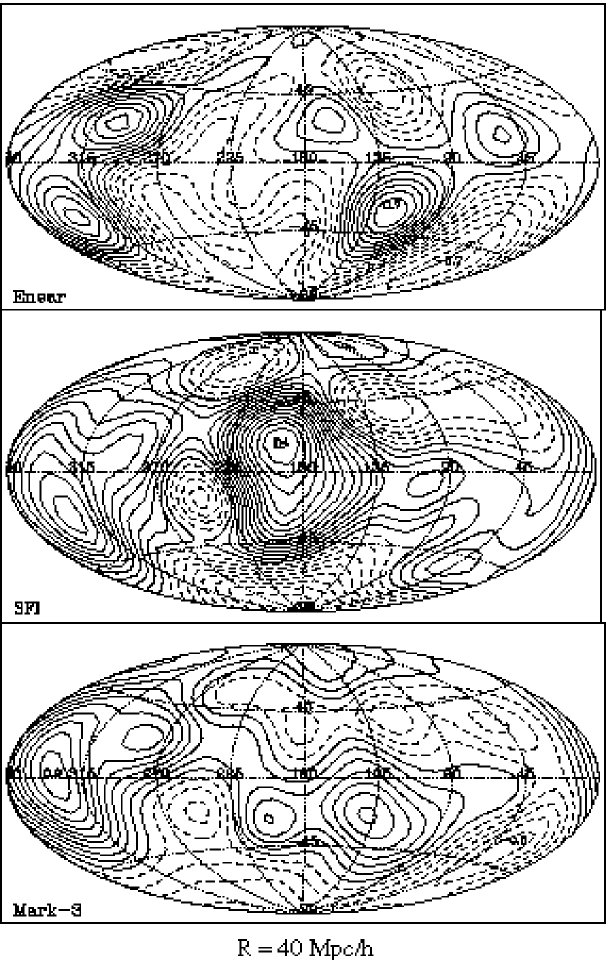
10.5. Predicted structures behind the ZOA
Early reconstructions on relatively sparse data galaxy catalogs have been performed within volumes out to 5000 km s-1. Despite heavy smoothing, they have been quite successful in pinpointing a number of important features.
Scharf et al. (1992) applied spherical harmonics to the 2-dimensional IRAS PSC and noted a prominent cluster behind the ZOA in Puppis () which was simultanously discovered as a nearby cluster through H I-observations of obscured galaxies in that region by Kraan-Korteweg & Huchtmeier (1992). It was analyzed further by Lahav et al. (1993).
Hoffman (1994) predicted the Vela supercluster at ( km s-1), using 3-dimensional Wiener filter reconstructions on the IRAS 1.9 Jy redshift catalog (Strauss et al. 1992). It was discovered observationally just a bit earlier by Kraan-Korteweg & Woudt (1993).
Using POTENT analysis, Kolatt et al. (1995) predicted the center of the Great Attractor overdensity – its density peak – to lie behind the ZOA at ( km s-1; see Fig. 18). Shortly thereafter, Kraan-Korteweg et al. (1996) unveiled the cluster A3627 as being very rich and massive and at the correct distance. It hence is the most likely candidate for the central density peak of the GA.
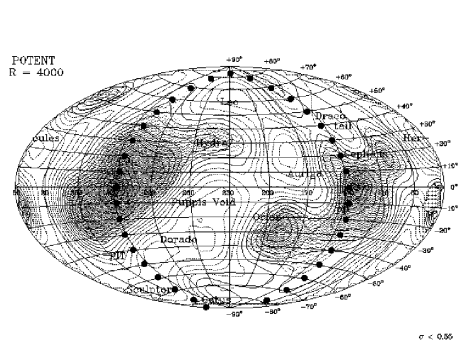
POTENT reconstructions have been applied to denser galaxy samples covering larger volumes (8-10000 km s-1) with smoothing scales of the order of 500 km s-1 (compared to 1200 km s-1). It therefore seemed of interest to see whether these reconstructions find evidence for unknown major galaxy structures in the ZOA at higher redshifts.
The currently most densely-sampled, well-defined galaxy redshift catalog is the Optical Redshift Survey (Santiago et al. 1995). However, this catalog is limited to and the reconstructions (see Baker et al. 1998) within the ZOA are strongly influenced by 1.2 Jy IRAS Redshift Survey data and a mock galaxy distribution in the inner ZOA. We will therefore concentrate on reconstructions based on the 1.2 Jy IRAS Redshift Survey only.
In the following, the structures identified in the ZOA by (a) Webster et al. (1997) using Wiener filter plus spherical harmonics and linear theory and (b) Bistolas (1998), who applied a Wiener filter plus linear theory and constrained realizations, will be discussed and compared to observational data. Figure 2 in Webster et al. displays the reconstructed density fields on shells of 2000, 4000, 6000 and 8000 km s-1; Fig. 5.2 in Bistolas displays the density fields in the ZOA from 1500 to 8000 km s-1 in steps of 500 km s-1.
The reconstructions by Webster et al. 1997 clearly show the recently identified nearby cluster at (,1500 km s-1; see Sect. 5.4.), whereas Bistolas reveals no clustering in the region of the Local Void out to 4000 km s-1. At the same longitudes, the clustering at 7500 km s-1 is seen by Bistolas, but not by Webster et al. The Perseus-Pisces chain is strong in both reconstructions, and the second Perseus-Pisces arm – which folds back at – is clearly confirmed. Both reconstructions find the Perseus-Pisces complex to be very extended in space, i.e. from 3500 km s-1 out to 9000 km s-1. Whereas the GA region is more prominent compared to Perseus-Pisces in the Webster et al. reconstructions, the signal of the Perseus-Pisces complex is considerably stronger than the GA in Bistolas, where it does not even reveal a well-defined central density peak. Both reconstructions find no evidence for the suspected cluster around PKS1343601, but its signal could be hidden in the central (A3627) density peak due to the smoothing. While the Cygnus-Lyra complex ( km s-1) discovered by Takata et al. (1996) stands out clearly in Bistolas, it is not evident in Webster et al. Both reconstructions find a strong signal for the Vela SCL ( km s-1), labelled as HYD in Webster et al. 1997. The Cen-Crux cluster identified by Woudt (1998) is evident in Bistolas though less distinct in Webster et al. A suspected connection at ( km s-1; see middle panel of Fig. 12) is supported by both methods. The Ophiuchus cluster just becomes visible in the most distant reconstruction shells (8000 km s-1).
10.6. Conclusions
Not all reconstructions find the same features, and when they do, the prominence of the density peaks as well as their locations in space do vary considerably. At velocities of km s-1 most of the dominant structures happen to lie close to or within the ZOA while at larger distances, clusters and voids seem to be more homogeneously distributed over the whole sky. Out to 8000 km s-1 none of the reconstructions predict any major structures which are not mapped or suggested from observational data. Thus, no major surprises seem to remain hidden in the ZOA. The various multi-wavelength explorations of the Milky Way will soon be able to verify this. Still, the combination of both the reconstructed potential fields and the observationally mapped galaxy distribution will lead to estimates of the cosmological parameters and .
11. Discussion
In the last decade, enormous progress has been made in unveiling the extragalactic sky behind the Milky Way. At optical wavebands, the entire ZOA has been systematically surveyed. It has been shown that these surveys are complete for galaxies larger than (corrected for absorption) down to extinction levels of . Combining these data with previous “whole-sky” maps reduces the “optical ZOA” by a factor of about 2 - 2.5, which allows an improved understanding of the velocity flow fields and the total gravitational attraction on the Local Group. Various previously unknown structures in the nearby Universe could be mapped in this way.
At higher extinction levels, other windows to the ZOA become more efficient in tracing the large-scale structures. Very promising in this respect are the current near-infrared surveys which find galaxies down to latitudes of . Source confusion will remain a problem at low Galactic latitude which may be overcome by introducing novel statistical methods such as Artificial Neural Networks. The systematic H I surveys detect gas-rich spiral galaxies all the way across the Galactic Plane – slightly hampered only at very low latitudes () because of the numerous continuum sources. These studies have already shown that no unknown dynamically important, H I-rich nearby galaxies whose gravitational influence could significantly impact the internal dynamics and the peculiar motion of the Local Group are hidden by the Milky Way. In addition, the deep ZOA H I surveys can be merged with the lower-sensitivity whole-sky H I-surveys currently in progress. The “Behind the Plane” survey resulted in a reduction from 16% to 7% of the “FIR ZOA” which soon should provide improved values of the dipole direction and convergence from IRAS data. In addition, new indications of possible hidden massive clusters behind the Miky Way are now forthcoming from the CIZA project – although again an “X-ray ZOA” will remain due to the absorption of X-ray radiation by the thick gas layer close to the Galactic Plane.
A difficult task is still awaiting us, i.e. to obtain a detailed understanding of the selection effects inherent to the various methods. Quantifying the selection effects is crucial for any optimal reconstruction method (e.g. Wiener) which attempts to merge the different data sets in an unbiased way. This is extremely important if we want to use these data for quantitative cosmography. Moreover, we need a better understanding of the effects of obscuration on the observed properties of galaxies identified through the dust layer (at all wavelengths), in addition to an accurate high-resolution, well-calibrated map of the Galactic extinction.
Despite the fact that our knowledge about the above issues is as yet limited, a lot can and has been learned from ZOA research. This is evident, for instance, from the detailed and varied investigations of the Great Attractor region. Mapping the GA and understanding the massive overdensity inferred from peculiar velocity fields had remained an enigma due the fact that the major and central part of this extended density enhancement was largely hidden by the obscuring veil of the Milky Way. The results from the various ZOA surveys now clearly imply that the Great Attractor is, in fact, a nearby “Great-Wall” like supercluster, starting at the nearby Pavo cluster below the GP, moving across the massive galaxy cluster A3627 toward the shallow overdensity in Vela at 6000 km s-1. The cluster A3627 is the dominant central component of this structure, similar to the Coma cluster in the (northern) Great Wall. Whether a second massive cluster around PKS1343601 is part of the core of the GA remains uncertain.
Acknowledgments.
The enthusiastic collaborations of our colleagues in the exploration of the galaxy distribution behind the Milky Way is greatly appreciated. These are P.A. Woudt, C. Salem and A.P. Fairall with deep optical searches, C. Balkowski, V. Cayatte, A.P. Fairall, P.A. Henning with redshift follow-ups of optically identified galaxies, A. Schröder and G.A. Mamon in the exploration of DENIS images at low Galactic latitude, W.B. Burton, P.A. Henning, and A. Rivers in the northern ZOA HI-survey (DOGS) and the HIPASS ZOA team members L. Staveley-Smith , R.D. Ekers, A.J. Green, R.F. Haynes, P.A. Henning, S. Juraszek, M. J. Kesteven, B. Koribalski, R.M. Price, E. Sadler and A. Schröder in the southern ZOA survey.
Particular thanks go to P.A. Woudt for his valuable suggestions, to W. Saunders for preparing Fig. 8, to A. Schröder and G. Mamon for their comments on the NIR section, and to H. Ebeling for his input with regard to the X-ray section and Fig. 14.
This research has made use of the NASA/IPAC Extragalactic Database (NED) which is operated by the Jet Propulsion Laboratory, Caltech, under contract with the National Aeronautics and Space Administration, as well as the Lyon-Meudon Extragalactic Database (LEDA), supplied by the LEDA team at the Centre de Recherche Astronomique de Lyon, Observatoire de Lyon.
References
Baker J.E., Davis M., Strauss M.A., Lahav O., Santiago B.X.: 1998, ApJ 508, 6
Bertschinger E., Dekel A.: 1989, ApJ 336, 5
Balkowski C., Kraan-Korteweg R.C. (eds.): 1994, Unveiling Large-Scale Structures behind the Milky Way, ASP Conf. Ser. 67, ASP, San Francisco
Bistolas V.: 1998, Ph.D. thesis, Hebrew University, Jerusalem
Böhm-Vitense E.: 1956, PASP 68, 430
Böhringer H., Neumann D.M., Schindler S., Kraan-Korteweg R.C.: 1996, ApJ 467, 168
Burstein D., Heiles C.: 1978, ApJ 225, 40
Burstein D., Heiles C.: 1982, AJ 87, 1165
Burstein D., Davies R.L., Dressler A., Faber S.M., Stone R.P.S., Lynden-Bell D., Terlevich R.J. Wegner G.: 1987, ApJS 64, 601
Burton W.B., Braun R., Walterbos R.A.M., Hoopes C.G.: 1999, AJ 117, 194
Burton W.B., Verheijen M.A.W., Kraan-Korteweg R.C., Henning P.A.: 1996, A&A 309, 687
Buta R.J., McCall M.L.: 1999, ApJS 124, 33
Cameron L.M.: 1990, A&A 233, 16
Cardelli J.A., Clayton G.C., Mathis J.S.: 1989, ApJ 345, 245
Chamaraux P., Cayatte V., Balkowski C., Fontanelli P.: 1990, A&A 229, 340
Chamaraux P., Masnou J.-L., Kazés I., Saito M., Takata T., Yamada T.: 1999, MNRAS 307, 263
Charlier C.V.L.: 1922, Arkiv för Mat. Astron. Fys. 16, 1
da Costa L.N., Freudling W., Wegner G., Giovanelli R., Haynes M.P., Salzer J.J.: 1996, ApJ 468, L5
da Costa L.N., Bernardi M., Alonso M.V., Wegner G., Willmer C.N.A., Pellegrini P.S., Rité C., Maia M.A.G.: 2000a, AJ, in press
da Costa L.N, Bernardi M., Alonso M.V., Wegner G., Willmer C.N.A., Pellegrini P.S., Maia M.A.G., Zaroubi S., 2000b: ApJ Letters submitted
Dame T.M., Ungerechts H., Cohen R.S., de Geus E.J., Grenier I.A., May J., Murphy D.C., Nyman L.-A., Thaddeus P.: 1987, ApJ 322, 706
Dekel A.: 1994, ARAA, 32, 371
Dickey J.M., Lockman F.J.: 1990, ARA&A 28, 215
Djorgovski S., Thompson D.J., de Carvalho R.R., Mould J.R.: 1990, AJ 100, 599
Dodd R.J., Brand P.W.J.L.: 1976, A&AS 25, 519
Dressler A., Faber S.M., Burstein D., Davies, R.L., Lynden-Bell D., Terlevich R.J., Wegner G.: 1987, ApJ 313, 37
Dreyer J.L.E.: 1888, Mem.R.A.S. XLIX, Part 1, ”A New General Catalogue of Nebulae and Clusters of Stars, being the catalogue of the late Sir John F.W. Herschel, revised, corrected and enlarged”
Dreyer J.L.E.: 1895, Mem.R.A.S. LI, ”Index Catalogue of Nebulae found in the Years 1888 to 1894, with Notes and Corrections”
Drinkwater M.J., Barnes D.G., Ellison S.L.: 1995, PASA 12, 248
Dunn A.M., Laflamme R.: 1995, ApJ 443, L1
Ebeling H., Edge A.C., Böhringer H., Allen S.W., Crawford C.S., Fabian A.C., Voges W., Huchra J.P.: 1998, MNRAS 301, 881
Ebeling H., Mullis C.R., Tully B.R.: 1999, BAAS 31 (HEAD meeting), 699
Ebeling H., Mullis C.R., Tully B.R.: 2000, submitted to ApJ
Edge A.C., Stewart G.C., Fabian A.C., Arnaud K.A.: 1990, MNRAS 245, 559
Epchtein N.: 1997, in The Impact of Large Scale Near-Infrared Surveys, eds. F. Garzón et al., Kluwer, Dordrecht, 15
Epchtein N.: 1998, in The Impact of Near-Infrared Sky Surveys on Galactic and Extragalactic Astronomy, ed. N. Epchtein, Kluwer, Dordrecht, 3
Fabian A.C.: 1994, in Unveiling Large-Scale Structures behind the Milky Way, eds. C. Balkowski & R.C. Kraan-Korteweg, ASP Conf. Ser. 67, 76
Fairall A.P., Kraan-Korteweg R.C.: 2000, in Mapping the Hidden Universe: The Universe Behind the Milky Way – The Universe in HI, eds. R.C. Kraan-Korteweg, P.A. Henning & H. Andernach, ASP Conf. Ser., in press
Fisher K.B., Scharf C.A. Lahav, O.: 1994, MNRAS 266, 219
Fisher K.B., Huchra J., Davis M., Strauss M.A., Yahil A., Schlegel D.: 1995, ApJS 100, 69
Fisher K.B., Lahav O., Hoffman Y., Lynden-Bell D., Zaroubi, S.: 1995, MNRAS 272, 885
Fitzgerald M.P.: 1974, A&A 31, 467
Focardi P., Marano B., Vettolani G.: 1984, A&A 136, 178
Fouqué P., Paturel G.: 1985, A&A 150, 192
Gardner J.P., Sharples R.M., Carrasco B.E., Frenk C.S.: 1996, MNRAS 282, L1
Giovanelli R., Haynes M.P.: 1982, AJ 87, 1355
Giovanelli R., Haynes M.P., Herter T., Vogt N.P., Wegner G., Salzer J.J., da Costa L.N., Freudling W.: 1997, AJ 113, 22
Giovanelli R., Haynes M.P., Freudling W., da Costa L.N., Salzer J.J., Wegner G.: 1998, ApJ 505, L91
Han M.-S.: 1992, ApJS 81, 35
Hartmann D.: 1994, Ph.D. thesis, Univ. of Leiden
Hartmann D., Burton W.B.: 1997, Atlas of Galactic Neutral Hydrogen, Cambridge University Press
Hasegawa T., Wakamatsu K., Malkan M., Sekiguchi K., Menzies J.W., Parker Q.A., Jugaku J., Karoji H., Okamura S.: 2000, MNRAS, in press
Hau G.K.T., Ferguson H.C., Lahav O., Lynden-Bell D.: 1995, MNRAS 277, 125
Hauschildt M.: 1987, A&A 184, 43
Heavens A.F., Taylor A.N.: 1995, MNRAS 275, 483
Henning P.A., Kraan-Korteweg R.C., Rivers A.J., Loan, A.J., Lahav O., Burton W.B.: 1998, AJ 115, 584
Henning P.A., Staveley-Smith L., Kraan-Korteweg R.C., Sadler E.M.: 1999, PASA 16, 35
Henning P.A., Staveley-Smith L., Ekers R.D., Green A.J., Haynes R.F., Juraszek S., Kesteven M.J., Koribalski B., Kraan-Korteweg R.C., Price R.M., Sadler E.M., Schröder A.: 2000, AJ, in press
Herschel, J.: 1864, Philosophical Transactions
Hoffman Y.: 1994, in Unveiling Large-Scale Structures behind the Milky Way, eds. C. Balkowski & R.C. Kraan-Korteweg, ASP Conf. Ser. 67, 185
Hoffman Y., Ribak E.: 1991, ApJ 415, L5
Hoffman, Y.: 2000, in Mapping the Hidden Universe: The Universe Behind the Milky Way – The Universe in HI, eds. R.C. Kraan-Korteweg, P.A. Henning & H. Andernach, ASP Conf. Ser., in press
Huchra J., Hoessel J., Elias J.: 1977 AJ 82, 674
Huchtmeier W.K., Karachentsev I.D., Karachentseva V.E.: 1997, A&A, 322, 375
Huchtmeier W.K., Karachentsev I.D., Karachentseva V.E.: 2000, IAU Coll. 174 “Small Galaxy Groups”, eds. M. Valtonen & C. Flynn, A.S.P. Conf. Ser., in press
Hudson M.J.: 1992, PhD thesis, Cambridge University
Hudson M.J.: 1994, MNRAS 266, 475
Hudson M.J., Lynden-Bell D.: 1991, MNRAS 252, 219
Hurt R.L., Jarrett T., Cutri R., Skrutskie M., Schneider S., van Driel W.: 1999, BAAS 194, 832
Ibata R.A., Gilmore G., Irwin M.J.: 1994, Nature 370, 194
Joint IRAS Science Working Group: 1988, IRAS Point Source Catalog, Version 2 (Washington: US Govt. Printing Office) (IRAS PSC)
Jahoda K., Mushotzky R.F.: 1989, ApJ 346, 638
Johnston M.D., Bradt H.V., Doxsey R.E., Marschall F.E., Schwartz D.A., Margon B.: 1981, ApJ 245, 799
Juraszek S.: 1999, PASA 16, 38
Juraszek S., Staveley-Smith L., Kraan-Korteweg R.C., Green A.J., Ekers R.D., Henning P.A., Kesteven M.J., Koribalksi B., Sadler E.M., Schröder A.C.: 2000, AJ 119, 1627
Kahn F.D., Woltjer L.: 1959, ApJ 130, 705
Karachentsev I. D., Tikhonov N. A.: 1994, A&A 286, 718
Karachentsev I. D., Tikhonov N. A.: 1993, A&AS 100, 227
Kerr F.J., Henning P.A.: 1987, ApJ 320, L99
Kerr F.J., Bowers P.F., Jackson P.D., Kerr M.: 1986, A&AS 66, 373
Kogut A., Lineweaver C., Smoot G.F., Bennett C. L., Banday A., Boggess N.W., Cheng E.S., de Amici, G., Fixsen D.J., Hinshaw G., Jackson P.D., Janssen M., Keegstra P., Loewenstein K., Lubin P., Mather J.C., Tenorio L., Weiss R., Wilkinson D.T., Wright E.: 1993, ApJ 419, 1
Kolatt T., Dekel A., Lahav O.: 1995, MNRAS 275, 797
Kraan-Korteweg R.C.: 1979, AN 300, 181
Kraan-Korteweg R.C.: 1992, in The Distribution of Matter in the Universe, eds. G.A.Mamon & D. Gerbal, Observatoire de Paris: Paris, 202
Kraan-Korteweg R.C.: 1999, in The Low Surface Brightness Universe, IAU Coll 171, eds. J.I. Davies, C. Impey & S. Philipps, A.S.P. Conf. Ser. 170, 103
Kraan-Korteweg R.C.: 2000, A&AS, 141, 123
Kraan-Korteweg R.C., Huchtmeier W.K.: 1992, A&A 266, 150
Kraan-Korteweg R.C., Woudt P.A.: 1993, in Cosmic Velocity Fields, eds. F. Bouchet & M. Lachièze-Rey, Editions Frontières, Gif-sur-Yvette, 557
Kraan-Korteweg R.C., Woudt P.A.: 1999, PASA 16, 53
Kraan-Korteweg R.C., Cayatte V., Fairall A.P., Balkowksi C., Fairall A.P., Henning P.A.: 1994a, in Unveiling Large-Scale Structures behind the Milky Way, eds. C. Balkowski & R.C. Kraan-Korteweg, ASP Conf. Ser. 67, 99
Kraan-Korteweg R.C., Loan A.J., Burton W.B., Lahav O., Ferguson H.C., Henning P.A., Lynden-Bell D.: 1994b, Nature, 372, 77
Kraan-Korteweg R.C., Fairall A.P., Balkowski C.: 1995, A&A 297, 617
Kraan-Korteweg R.C., Woudt P.A., Cayatte V., Fairall A.P., Balkowski C., Henning P.A.: 1996, Nature 379, 519
Kraan-Korteweg R.C., Koribalski B., Juraszek S.: 1998a, in Looking Deep in the Southern Sky, eds. R. Morganti & W. Couch, Springer, 23
Kraan-Korteweg R.C., Schröder A., Mamon G., Ruphy S.: 1998b, in The Impact of Near-Infrared Surveys on Galactic and Extragalactic Astronomy, 205, ed. N. Epchtein, Kluwer, Dordrecht
Kraan-Korteweg R.C., Henning P.A., Andernach H. (eds.): 2000, in Mapping the Hidden Universe: The Universe Behind the Milky Way – The Universe in HI, ASP Conf. Ser., in press, ASP, San Francisco
Kuno N., Vila-Vilaro B., Nishiyama K.: 1996, PASJ 48, 19
Lahav O.: 1994, in Unveiling Large-Scale Structures behind the Milky Way, eds. C. Balkowski & R.C. Kraan-Korteweg, ASP Conf. Ser. 67, 171
Lahav O.: 1987, MNRAS 225, 213
Lahav O., Yamada T., Scharf C.A., Kraan-Korteweg R.C.: 1993, MNRAS 262, 711
Lahav O., Brosh N., Goldberg E., Hau G.K.T., Kraan-Korteweg R.C., Loan A.J.:1998, MNRAS 299, 24
Lahav O., Santiago B.X., Webster A.M., Strauss A.M., Davis M., Dressler A., Huchra J.P.: 2000, MNRAS, 312, 166
Lauberts A.: 1982, The ESO/Uppsala Survey of the ESO (B) Atlas, ESO, Garching
Lercher G., Kerber F., Weinberger R.: 1996, A&AS 117, 369 [B1]
Lewis G., Irwin M.: 1996, Spectrum, Newsletter of the Royal Observatories 12, 22
Li J.G., Zhao J.H., Ho P.T.P., Sage L.J.: 1996, A&A, 307, 424
Loan A.J., Maddox S.J., Lahav O., Balcells M., Kraan-Korteweg R.C., Assendorp R., Almoznino E., Brosch N., Goldberg E., Ofek E.O.: 1996, MNRAS 280, 537
Lu N.Y., Dow M.W., Houck J.R., Salpeter E.E., Lewis B.M.: 1990, ApJ 357, 388
Lynden-Bell D.: 1982, Observatory 102, 7
Lynden-Bell D.: 1991, in Observational Test of Cosmological Inflation, eds. Shanks, T. et al., Kluwer, Dordrecht, 337
Lynden-Bell D., Faber S.M., Burstein D., Davies R.L., Dressler A., Terlevich R.J., Wegner G.: 1988, ApJ 326, 19
Lynden-Bell D., Lahav O., Burstein D.: 1989, MNRAS 241, 325
McAdam W.B.: 1991, PASA 9, 255
McCall M. L.: 1986, JRASC 80, 271
McCall M. L.: 1989, AJ 97, 1341
McCall M.L, Armour M.-H.: 2000, in Mapping the Hidden Universe: The Universe Behind the Milky Way – The Universe in HI, eds. R.C. Kraan-Korteweg, P.A. Henning & H. Andernach, ASP Conf. Ser., in press
McCall M.L, Buta R.J.: 1995, AJ, 109, 2460
McCall M.L, Buta R.J.: 1996, BAAS 189, 8005M
McCall M.L, Buta R.J.: 1997, AJ 113, 981
McCall M.L, Buta R.J.: 1999, ApJS 124, 33
Mamon G.A.: 1994, in Unveiling Large-Scale Structures Behind the Milky Way, eds. C. Balkowski & R.C. Kraan-Korteweg, ASP Conf. Ser. 67, 53
Mamon G.A.: 1998, in Wide Field Surveys in Cosmology, eds. Y. Mellier & S. Colombi Editions Frontières, Gif-sur-Yvette, 323
Mamon G.A.: 1999, in Workshop on Cosmic Flows, eds. S. Courteau, M. Strauss & J. Willick, ASP Conf. Ser. 201, in press
Mathis J.S.: 1990, ARA&A 28, 37
Nilson P.: 1973, Uppsala General Catalog of Galaxies, Uppsala, University of Uppsala
Nusser A., Davis M.: 1994, ApJL 421, L1
Marchiotto W., Wildauer H., Weinberger R.: 1999, in progress [B2]
Marzke R.O., Huchra J.P., Geller M.J.: 1996, AJ 112, 1803
Mathewson D.S., Ford V.L., Buchhorn M.: 1992, ApJS 81, 413
Mould J.R., Han M.S., Roth J., Staveley-Smith L., Schommer R.A., Bothun G.D., Hall P.J., Huchra J.P., Walsh W., Wright A.E.: 1991, ApJ 383, 467
Naim A.: 1995 Ph.D. thesis, Univ. of Cambridge
Pantoja C.A., Altschuler D.R., Giovanardi C., Giovanelli R.: 1994, in Unveiling Large-Scale Structures Behind the Milky Way, eds. C. Balkowski, R.C. Kraan-Korteweg, ASP Conf. Ser. 67, 143
Pantoja C.A., Altschuler D.R., Giovanardi C., Giovanelli R.: 1997, AJ 113, 905
Peebles P.J.E.: 1973, ApJ 185, 413
Peebles P.J.E.: 1980, The Large Scale Structure of the Universe, Princeton University Press, Princeton
Peebles P.J.E.: 1990, ApJ 362, 1
Peebles P. J. E.: 1994, ApJ 429, 43
Proctor, R.: 1878, The Universe of Stars, Longmans, Green and Co., London, 41
Putman M.E., Gibson B.K., Staveley-Smith L, Banks G., Barnes D.G., Bhatal R., Disney M.J., Ekers R.D., Freeman K.C., Haynes R.F., Henning P., Jerjen H., Kilborn V., Koribalski B., Knezek P., Malin D.F., Mould J.R., Oosterloo T., Price R.M., Ryder S.D., Sadler E.M., Stewart I., Stootman F., Vaile R.A., Webster R.L., Wright A.E.: 1998, Nature 394, 752
Regös E., Szalay, A.S.: 1989, ApJ 345, 627
Reynolds C.S., Loan A.J., Fabian A.C., Makishima K., Brandt W.N., Mizuno T.: 1997, MNRAS 286, 349
Rivers A.J., Henning P.A., Kraan-Korteweg R.C.: 1999, PASA 16, 48
Roman A.T., Nakanishi K., Tomita A., Saito M.: 1996, PASJ 48, 679
Roman A.T., Takeuchi T.T., Nakanishi K., Saito M.: 1998, PASJ 50, 47
Rowan-Robinson M., Sharpe J., Oliver S.J., Keeble O., Canavezes A., Saunders W., Taylor A.N., Valentine H., Frenk C.S., Efstathiou G.P., McMahon R.G., White S.D.M., Sutherland W., Tadros H., Maddox S.: 2000, MNRAS 314, 375
Rybicki G.B., Press W.H.: 1992, ApJ 398, 169
Saito M., Ohtani A., Asomuna A., Kashikawa N., Maki T., Nishida S., Watanabe T.: 1990, PASJ 42, 603
Saito M., Ohtani A., Baba A., Hotta N., Kameno S., Kurosu S., Nakada K., Takata T.: 1991, PASJ 43, 449
Saito M., Iwata I., Roman A.T.: 2000, in Mapping the Hidden Universe: The Universe Behind the Milky Way – The Universe in HI, eds. R.C. Kraan-Korteweg, P.A. Henning & H. Andernach, ASP Conf. Ser., in press
Salem C., Kraan-Korteweg R.C.: in prep., [D1]
Santiago B.X., Strauss M.A., Lahav O., Davis M., Dressler A., Huchra J.: 1995, ApJ 446, 457
Saunders W., D’Mellow K.J., Tully R.B., Mobasher B., Maddox S.J., Sutherland W.J., Carrasco B.E., Hau G., Clements D.L., Staveley-Smith L.: 2000a, in Towards an Understanding of Cosmic Flows of Large-Scale Structure, eds. Courteau S., Strauss M. & Willick J., ASP Conf. Ser. 201, in press (astro-ph/9909174)
Saunders W., Sutherland W.J., Maddox S.J., Keeble O., Oliver S.J., Rowan-Robinson M., Efstathiou G.P., Tadros H., White S.D.M., Frenk C.S., Carramiñana A., Hawkins M.R.S.: 2000b, MNRAS, in press (astro-ph/0001117)
Saurer W., Seeberger R., Weinberger R.: 1997 A&AS 126, 247 [B1]
Scharf C., Hoffman Y., Lahav O., Lynden-Bell D.: 1992, MNRAS 256, 229
Schlegel D.J., Finkbeiner D.P., Davis M.: 1998, ApJ 500, 525
Schmoldt I., Branchini E., Teodoro L., Efstathiou G., Frenk C., Keeble O., Maddox S., Oliver S., Rowan-Robinson, M., Saunders W., Sutherland W., Tadros H., White S.D.M.: 1999, MNRAS 304, 893
Schmoldt I., Saar V., Saha P., Branchini E., Efstathiou G.P., Frenk C.S., Keeble O., Maddox S., McMahon R., Oliver S., Rowan-Robinson M., Saunders W., W.J. Sutherland W.J., Tadros H., White S.D.M.: 2000, AJ 118, 1146
Schröder A., Kraan-Korteweg R.C., Mamon G.A. Ruphy S.: 1997, in Extragalactic Astronomy in the Infrared, eds. G.A. Mamon, T.X. Thuan & J. Tran Thanh Van, Editions Frontières, Gif-sur-Yvette, 381
Schröder A., Kraan-Korteweg R.C., Mamon G.A.: 1999, PASA 16, 42
Seeberger R., Saurer W.: 1998, A&AS 127, 101 [B1]
Seeberger R., Saurer W., Weinberger R., Lercher G.: 1994, in Unveiling Large-Scale Structures Behind the Milky Way, eds. C. Balkowski & R.C. Kraan-Korteweg, ASP Conf. Ser. 67, 81 [B1]
Seeberger R., Saurer W., Weinberger R.: 1996, A&AS 117, 1 [B1]]
Shane C.D., Wirtanen C.A.: 1954, AJ 59, 285
Shane C.D., Wirtanen C.A.: 1967, Publ. Lick Obs. XXII, Pt. I
Shapley, H.: 1961, in Galaxies, Cambridge: Harvard University Press, 159
Scharf C., Hoffman Y., Lahav O., Lynden-Bell D.: 1992, MNRAS 256, 229
Scharf C.A., Lahav, O.: 1993, MNRAS 264, 439
Sheth R.K.: 1995, MNRAS 277, 933
Skrutskie M.F.: 1998, in The Impact of Near-Infrared Sky Surveys on Galactic and Extragalactic Astronomy, ed. N. Epchtein, Kluwer, Dordrecht, 11
Skrutskie M.F. Schneider S.E., Stiening R., Strom S.E., Weinberg M.D., Beichmann C., Chester T., Cutri R., Lonsdale C., Elias J., Elston R., Capps R., Carpentie J., Juchra J., Liebert J., Monet D., Price S., Seitzer P.: 1997, in The Impact of Large Scale Near-Infrared Surveys, eds. F. Garzón et al. , Kluwer, Dordrecht, 25
Staveley-Smith L.: 1997, PASA 14, 111
Staveley-Smith L., Wilson W.E., Bird T.S., Disney M.J., Ekers R.D., Freeman K.C., Haynes R.F., Sinclair M.W., Vaile R.A., Webster R.L., Wright A.E.: 1996, PASA 13, 243
Staveley-Smith L., Juraszek S., Koribalski B.S. Ekers R.D., Green A.J., Haynes R.F., Henning P.A., Kesteven M.J., Kraan-Korteweg R.C., Price R.M., Sadler E.M.: 1998, AJ 116, 2717
Strauss M.A., Willick J.A.: 1995, Phys. Rep. 26, 27
Strauss M.A., Huchra J.P., Davis M., Yahil A., Fisher K.B., Tonry J.: 1992, ApJS 82, 29
Takata T., Yamada T., Saito M.: 1996, ApJ 457, 693
Tammann G.A., Kraan-Korteweg R.C.: 1978, in The Large Scale Structure of the Universe; IAU Symp. 79, eds. M.S. Longair & J. Einasto, Reidel: Dordrecht, 71
Tamura T., Fukazawa Y., Kaneda H., Makishima K., Tashiro M., Tanaka Y., Böhringer H.: 1998, PASJ 50, 195
Tashiro M., Kaneda H., Makishima K., Iyomoto N., Idesawa E., Ishisaki Y., Kotani T., Takahashi T., Yamashita A: 1998, ApJ 499, 713
Temporin S., Weinberger R., Gajdosik M.: 2000, in Mapping the Hidden Universe: The Universe Behind the Milky Way – The Universe in HI, eds. R.C. Kraan-Korteweg, P.A. Henning & H. Andernach, ASP Conf. Ser., in press
Theureau G., Paturel G., Vauglin I.: 1997, in Extragalactic Astronomy in the Infrared, eds. G.A. Mamon, T.X. Thuan & J. Tran Thanh Van, Editions Frontières, Gif-sur-Yvette, 393
Tilanus R.P.J., Burton W.B.: 1997, A&A 324, 899
Tully R.B., Fisher J.R.: 1977, A&A 54, 66
Valtonen M. J., Byrd G.G., McCall M. L., Innanen K. A.: 1993, AJ 105, 886
Vauglin I., Paturel G., Borsenberger J., Fouqué P., Epchtein N., Kimeswenger S., Tiphène D., Lanoix P., Courtois H.: 1999, A&AS 135, 133
Voges W., Aschenbach B., Boller T., Bäuninger H., Briel U., Burkert W., Dennerl K., Englhauser J., Gruber R., Haberl F., Hartner G., Hasinger G., Kürster M., Pfeffermann E., Pietsch W., Predehl P., Rosso, C., Schmitt J.H.M.M., Trümper J., Zimmermann H.-U.: 1999, A&A 349, 389
Vorontsov-Velyaminov B., Archipova V.: 1963-74, Morphological Catalog of Galaxies, Parts 2 to 5, Moscow, Moscow University
Wakamatsu K., Malkan M.: 1981, PASJ 33, 57
Wakamatsu K., Hasegawa T., Karoji H., Sekiguchi K., Menzies J.W., Malkan M.: 1994, in Unveiling Large-Scale Structures Behind the Milky Way, eds. C. Balkowski & R.C. Kraan-Korteweg, ASP Conf. Ser. 67, 131
Wakamatsu K., Parker Q.E., Malkan M., Karoji H.: 2000, in Mapping the Hidden Universe: The Universe Behind the Milky Way – The Universe in HI, eds. R.C. Kraan-Korteweg, P.A. Henning & H. Andernach, ASP Conf. Ser., in press
Wakker B.P.: 1990, Ph.D. thesis, Univ. of Groningen
Webster M., Lahav O., Fisher K.: 1997, MNRAS 287, 425
Weinberger R., 1980: A&AS 40, 123
Weinberger R., Elsässer H., Beetz M., Birkle K.: 1976, A&A 48, 327
Weinberger R., Gajdosik M., Zanin C.: 1999, A&AS 137, 293 [B5]
West R.M., Tarenghi M.: 1989, A&A 223, 61
Wiener N.: 1949, Extrapolation and Smoothing of Stationary Time Series, New York, Wiley
Willick J.A., Courteau S., Faber S.M., Burstein D., Dekel A., Strauss M.A.: 1997, ApJS 109, 333
Woudt P.A.: 1998, Ph.D. thesis, Univ. of Cape Town
Woudt P.A., Kraan-Korteweg R.C.: 2000a, A&AS, in prep.
Woudt P.A., Kraan-Korteweg R.C.: 2000b, A&AS, in prep.
Yamada T., Takata T., Djamaluddin T., Tomita A., Kentaro T., Saito M.: 1993, ApJS 89, 57
Zaroubi S.: 2000, in Mapping the Hidden Universe: The Universe Behind the Milky Way – The Universe in HI, eds. R.C. Kraan-Korteweg, P.A. Henning & H. Andernach, ASP Conf. Ser., in press
Zaroubi S., Hoffman Y., Fisher K.B., Lahav O.: 1995, ApJ 449, 446
Zaroubi S., Hoffman Y., Dekel, A.: 1999, ApJ, 520, 413
Zaroubi S., et al.: 2000, in preparation
Zwaan M., Briggs F., Sprayberry D.: 1997, PASA, 14, 126
Appendix A: Wiener Filtering
Here we give a brief review of the Wiener (1949) filter (WF) technique; the reader is referred to Lahav etal. (1994), Zaroubi et al. (1995) and Rybicki & Press (1992) for further details. Let us assume that we have a set of measurements, which are a linear convolution of the true underlying signal, , plus a contribution from statistical noise, , such that
where is the response or “point spread” function (summation convention assumed). Notice that we have assumed that the statistical noise is present in the underlying field and therefore is convolved by the response function.
The WF is the linear combination of the observed data which is closest to the true signal in a minimum variance sense. More explicitly, the WF estimate is given by where the filter is chosen to minimize . It is straightforward to show that the WF is given by
where
In the above equations, we have assumed that the signal and noise are uncorrelated. From equation A4, it is clear that, in order to implement the WF, one must construct a prior which depends on the variance of the signal and noise.
The dependence of the WF on the prior can be made clear by defining signal and noise matrices given by and . With this notation, we can rewrite equation A4 as
Formulated in this way, we see that the purpose of the WF is to attenuate the contribution of low signal-to-noise ratio data and therefore regularize the inversion of the response function. The derivation of the WF given above follows from the sole requirement of minimum variance and requires only a model for the variance of the signal and noise. The WF can also be derived using the laws of conditional probability if the underlying distribution functions for the signal and noise are assumed to be Gaussian; in this more restrictive case, the WF estimate is, in addition to being the minimum variance estimate, also both the maximum a posterior estimate and the mean field. For Gaussian fields, the mean WF field can be supplemented with a realization of the expected scatter about the mean field to create a realization of the field; this is the heart of the “constrained realization” approach described in Hoffman & Ribak (1991). A generalization to non-Gaussian fields is given in Sheth (1995).