Observations of Type I Bursts from Neutron Stars
Abstract
Observations of Type I X-ray bursts have long been taken as evidence that the sources are neutron stars. Black body models approximate the spectral data and imply a suddenly heated neutron star cooling over characteristic times of seconds to minutes. The phenomena are convincingly explained in terms of nuclear burning of accreted gas on neutron stars with low mass companion stars. Prospects are promising that detailed theory and data from RXTE and future missions will lead to better determinations of important physical parameters (neutron star mass and radius, composition of the accreting gas, distance of the source). Among the variety of bursts observed, there are probably representatives of different kinds of explosive burning. RXTE’s discovery of a 2.5 ms persistent coherent period from one Type I burster has now linked bursters indisputably to the epitome of a neutron star, a fast spinning magnetic compact object. Oscillations in some bursts had already been thought to arise from the neutron stars’ rotations. Detailed observations of these oscillations are touchstones of how the explosive bursts originate and progress, as well as independent measures of the neutron star parameters.
Introduction
Bursts represent the nuclear burning energy of material accreted on neutron stars, which is only about 7% of the gravitational energy irradiated. But, concentrating many hours worth in 10 seconds, they are impressive in making the neutron star glow as brightly as the Crab Nebula for a few seconds. During those seconds it dominates the scene and we can get a good look. The scene is changing rapidly, so only observations with large area and high time resolution have a hope of detecting the kind of dynamical phenomena that could occur. Now that neutron stars are being studied with these capabilities, we are both confirming speculations and seeing new aspects we did not envision. I will briefly summarize the kind of data that have substantiated our current picture and how the new observations compare. In this, I will concentrate on the spectral measurements, since the questions of the burst energy output, the durations, and the correlations with the persistent flux are well covered in Bildsten’s paper in this volume. Then I will discuss the new results about the spins of the neutron stars in low-mass X-ray binaries. Fuller details of both the earlier and the recent work may be found in recent reviews LvPT95 ; Bildsten9698 ; Stroh98 ; Stroh00 .
Brief Update on the Spectral Observations
Burst Spectra
A key indicator that bursters are neutron stars was the nature of the energy spectra. Of the three limiting types of X-ray spectra, non-thermal, optically thin high temperature gas, and high temperature optically thick surface, the spectra of bursts were a good match to the last of these and the parameters made good sense. Projected areas were within a factor of two of the canonical neutron star and peak luminosities were within factors of 2 of the Eddington limit for hydrogen or perhaps helium, for sources concentrated within the galactic bulge vP78 . At first, only for long bursts and slow evolution (100–1000 s), was it possible to say that the black body model was definitely a better fit than other simple models Swank77 . Now it is possible for short (10 s) bursts. It still remains true that for spectra of intervals of only a few tenths of a second, the black body model gives a good fit to the data.
Theoretically, modifications of the spectrum due to scattering and to temperature distribution in the neutron star atmosphere are expected to change the spectrum, but while the color temperature is strongly affected, the shape of the spectrum is not usually very different from the black body distribution. The spectra obtained by OSO–8, SAS–3, EXOSAT, TENMA, and Ginga, time resolved to various extents, depending on the data modes and the detector area, fit black body distributions and corrected spectral forms equally well. Conceptually, the fit temperatures are higher than expected because the emissivity is less than unity.
The predicted differences are excesses at low energies, below about 2 keV, and at high energies, above about 15 keV. London, Taam, and Howard LTH84 first included all the most important effects, the radiative transfer, the competition of scattering and absorption, and inelastic scattering and coined the phrase ”hardening factor”. Comparisons of burst spectra with absorbed black body spectra have shown deviations suggestive of these effects, although usually with detectors where the response is more uncertain in those ranges, and often when fast changes in the burst made it possible that the spectrum changed during the interval.
A potentially very informative deviation from the black body form was the dip seen in TENMA selected burst spectra of 4U 1636–536 Waki84 , 4U 1608–522, and 4U 1746–217, at 4.1 keV (in most cases). If the energy were redshifted Fe , it implies a very large redshift and puts a strain on the interpretation. That the energy is close to detector features makes it more difficult to study. It has also been suggested that the cross-over between a low temperature spectral component and a higher temperature one, could cause an apparent dip. Of the current missions, those with modest spectral resolution instruments () have low enough area to limit their constraints and the CCDs have pile-up problems with intense bursts. RXTE has the requisite area, but is a xenon detector again. It is not yet clear whether Chandra, XMM, or Astro-E can address this feature in bursts.
Typical RXTE PCA spectra for a few tenths of a second, with some exceptions, are still good fits to black body spectra, as shown in Figure 1. Additions of spectra to test for theoretical spectral differences have not been reported.

Color Temperatures and Apparent Radii
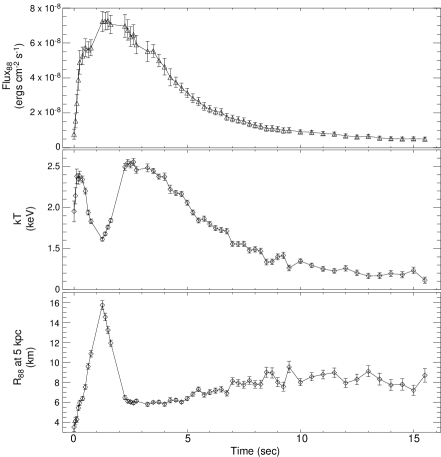
The parameters for flux, temperature, and apparent radius of these solutions are well determined (except when the color temperature puts the flux below the low energy threshold of the detectors), as shown for the example in Figure 2 for a burst with moderate radius expansion. The temperature starts down after the initial rise, the radius continues to increase, and the flux has a plateau. These are consistent with the scenario of the flux rising to the Eddington limit and lifting surface layers, such that the photosphere still emits the Eddington limit of radiation while expanding beyond the neutron star. Some bursts show evidence for both the Eddington limits of cosmic abundance gas and of hydrogen-poor/helium-rich gas. Early in the decay the photosphere contracts and the radius is approximately asymptotically consistent with that of the neutron star. The asymptotic apparent radius is not exactly constant, but slowly climbs as the flux and the temperature go down, possibly as flux dependent corrections change. The radius expands to around 16 km, less than a factor of two. This may be enough, however, for the photosphere to run into the inner part of the accretion disk, unless the inner part has been dispersed by the burst already. For other bursts the radius can be followed out to 100 km. Even greater expansions have been seen in rare long superbursts for which the average photon energy goes below the range of the detector and the rise looks like a precursor.
Atmospheric Models and Neutron Star Parameters
It was soon recognized that, in the rather high temperature atmosphere, scattering would dominate over free-free absorption and the emissivity would be energy and temperature dependent. The results of assuming a non-relativistic spherically symmetric neutron star led to results unlikely to be exactly correct, radii too small, luminosities exceeding the Eddington limit for He, and radius variations during bursts decays. The gravitational redshift effects are straight forward, at least if the star is not rotating near breakup. Successive calculations of the theoretical spectra increased in sophistication and applicability. Ebisuzaki87 ; Titarchuk88 . They still depend on the assumptions that the spectrum is formed in an atmosphere in radiative and hydrostatic equilibrium.
Ebisuzaki and Nakamura EN88 used the fact that the spectra calculated for a given luminosity and the spectra observed at a given luminosity fit a black body distribution for the “color” temperature), with the effective temperature a lower value. The dependence of the hardening factor () on the ratio of the luminosity to the Eddington luminosity, was mapped empirically, for various atmospheric constituents and burning scenarios. In practice it was possible, in the case of radius expansion bursts, to identify the point in the decay at which for radius expansion bursts, the crust settled back onto the neutron star. That flux should correspond to the Eddington limit. Further, the observational information of the fluxes as a function of time, together with the fit color temperatures, allow determination of the temperature that the emission would have had on the surface at the touchdown moment. The latter should be a specific function of the mass and radius and provide one locus of acceptable values. For sources with known distance, the comparison of the observed flux and the theoretical Eddington limit luminosity give a second locus, to uniquely determine the mass and radius.
Efforts to fit EXOSAT data to this picture were plagued by statistical uncertainties in the determinations Damen90 . A long burst observed with Ginga, exhibited complications in the spectra vP90 . The RXTE PCA has now obtained data which is suitable to use for such determinations. However a strategy is needed to deal with the question of the fraction of the neutron star that is emitting and the asymmetry of the emission. The ideas discussed by Bildsten, and the evidence from the bursts oscillations (discussed below) that the neutron star is not uniformly emitting (although only sometimes), show that these effects need to be considered.
Directions of Current Explorations
There are clearly several regimes of Type I bursts. Differences in characteristic recurrence times, the ratio of the persistent to burst luminosity, and burst duration, are observed, not just between sources, but for a given source. Theoretically, as Bildsten has discussed, these imply different fuel during the bursts and for accretion of given abundances close to cosmic, depend on the mass accretion rate per unit area. While the main differences are between sources with 5–10 s bursts, separated by 3–5 hours, versus 100 s bursts separated by 12 or more hours, there are two less common types of bursts. Some anomalous faint bursts have now been confirmed Gotthelf97 ; Tomsick99 . In addition, long duration bursts are seen which last 100–1000 s and have long, but unknown, recurrence times.
The observations are not consistent if the accretion rate is the only independent parameter. Bildsten proposes that the reason for correlations opposite those expected for a spherically symmetric distribution of the burning fuel on a neutron star, may be that the fuel is not distributed uniformly and the distribution is different for different states. Taam proposes hysteresis effects due to changes in internal temperature for changes of accretion conditions.
For the spectra, persistent flux contributions during the bursts need to be resolved. Radii of expansion put the photosphere outside where the kilohertz quasi-periodic oscillations (kHz QPO) indicate the inner disk can be (for the atoll bursters at least). Contributions of reflection, which must exist as counterparts to corresponding optical bursts, need to be taken into account.
New Information about the Bursters
A Pulsing Type I Burster
The Wide Field Camera Experiment on BeppoSAX has identified at least 16 new bursters, most in the galactic center region. Most were also transient persistent sources with peak luminosities less than 100 mCrab. SAX J1808.5-3658 was one of these Zand99 . The RXTE ASM could see the transient flux during the 2 week interval that it is was above 20 mCrab.
In May 1998, the RXTE PCA, in slewing between two targets, crossed the source and flagged that SAX J1808.5-365 was again brightMarshall98 . This time the RXTE PCA observed, Wijnands Wijnands98 immediately found the signal had 401 Hz coherent pulsations and Chakrabarty and Morgan CM98 found it had a 2 hour binary Doppler modulation with a tiny mass function (). Consideration of possible orbits and companions suggested the companion could be several times less than and the orbit possibly viewed nearly face-on.
Although the flux after 2 weeks dropped within 2 days by a factor of 5 the energy spectrum did not change and pulsations continued to be observed. Naively at least, accretion onto the neutron star was able to occur through the observed range of accretion rate. Quantitative limits with various assumptions about the laws describing the gas in the accretion disk (e.g. cold gas pressure or radiation pressure supported) led to estimates of the magnetic field within a factor of two of GaussPsaltis99 . The X-ray pulsar’s period of 2.5 ms is in the middle of the periods of a half dozen low-mass binary radio pulsars (1.6–7.5 ms) and a magnetic field is proximate to the magnetic fields of the radio pulsars. It appears likely that such a pulsar source could evolve to a similar radio pulsar.
Flux Oscillations during Bursts
The dynamical power spectrum of a burst from 4U 1728–34 is shown in Figure 3. Strohmayer discovered both the kHz QPO and the burst oscillations in the first observations of this source.

The number of sources for which oscillations have been seen during some bursts is still six, as it was by the end of the first year of RXTE operations Stroh98 . KHz QPO in the persistent flux have been seen in a dozen atoll bursters at frequencies of 300-1200 Hz. There are twice as many bursters with weak persistent flux. A small number of these have exhibited the QPO, but for many of these the flux is very weak and the limits are not very constraining. Bursts have also been seen from them. In some cases it is known that no oscillations were seen in the bursts. But in others the results are still pending. No oscillations have been seen in bursts that have been observed from the Z-sources, GX 17+2 and Cyg X–2.
Which bursts exhibit oscillations? Some interesting correlations have been noted, but the question has not yet been addressed systematically. Definitely some bursts with strong radius expansion do not exhibit oscillations. On the other hand for bursts with mild radius expansion, there may be oscillations before the expansion starts and after it has subsided. This is in agreement with the oscillations being associated with the neutron star surface.
For the atoll bursters the position in the color-color diagram for the persistent flux has long been argued to be response to the accretion rate vdK90 , exactly because burst properties correlated with the position. One of the properties that could be correlated is the inhomogeneity that shows up in oscillations.
KiloHertz Quasi-periodic Oscillations in Persistent Flux
The characteristic pattern of kiloHertz oscillations is two frequencies 250-350 Hz apart, where the difference stays approximately constant, while the frequencies can change by a factor of two. Figure 4 compares the distribution of the differences with the frequencies of oscillations seen in the bursts. Of the four sources for which the burst frequency is above 500 Hz, two have the pair of kHz QPO and the burst frequency is approximately twice the difference frequency. For the two with the lowest burst frequencies, these are very close to their difference frequencies.

Models with one of these frequencies being a beat with a lower frequency would provide a natural explanation. If the burst oscillations are the neutron star’s spin, it provides an obvious candidate to beat with one of the QPO. In this case, complications have to explain discrepancies of about 5%. Miller shows that the physical mechanisms in the “sonic-point model” can accommodate them Miller00 .
If the difference has nothing to do with the spin, but instead reflects frequencies entirely in the inner accretion disk, some effect of these during the burst has to explain the burst oscillations. Otherwise the closeness of the numbers seems an unlikely coincidence. The spins could be deduced from more subtle effects on the Kepler and apsidal motion to make the data fit Stella99 .
If the differences are the spins, the spins have a narrow distribution (257-358 Hz, corresponding to 2.8-3.8 ms). The sources have widely differing accretion rates (currently). Bildsten has explained this pile-up of the spins as due to the equilibrium between spin-up torque and gravitational radiation of the neutron star angular momentum Bildsten98 . This avoids a conspiracy between the luminosity and the magnetic field that is implied for equilibrium accretion at a magnetosphere.
If the differences do represent the spins, then the bursts in some cases show the fundamental and in others the signal is dominated by the first harmonic. For at least 4U 1636-53, a weak amplitude at the fundamental appears at the beginning of some bursts, as would be the case if the burning starts at one magnetic pole and very quickly spreads to the optical pole.
Neutron Star Spin Periods
Strohmayer has led investigation of several predictions of the model in which a hot spot on the neutron star surface causes the flux oscillations as the star rotatesStroh00 ; Strohb00 . They have appeared to confirm the interpretation in terms of the rotation period of the neutron star.
(1) In the bursts in which oscillations appear near the beginning of bursts and then die out, the amplitude of the oscillations can reach as high as 70 %. The amplitude dies down as the burst progresses in a way consistent with the spread of a hot spot. This increase in the burning area agrees with the spectral analysis.
(2) The asymptotic oscillations during the declining phase of the burst are usually well defined, suggesting a frequency characteristic of the neutron star (although the cause of asymmetry in this phase is not known). For some sources the asymptotic values vary little from burst to burst, even from year to year, independent of differences in the bursts. This seemed to have the promise of being a way to discover the binary motion, because differences corresponded to Doppler motions of 20 km s-1 which would be reasonable for binary motion. However, as the number of bursts studied has increased, evidence has appeared for larger differences.
(3) The oscillations in the burst tails are consistent with being coherent. There is a characteristic exponential approach to the asymptote , with the frequency being a function of time: Stroh99 . With the frequency variation taken into account, the coherence is consistent with the duration of the signal.
The change in frequency as a function of the decay cries out for a theory, if the spin of the neutron star is being deduced from it. It has been pointed out that if the heated crust is lifted enough by the radiation to be released from viscous drag, so that it can rotate freely and conserve its own angular momentum, only 10-20 M of lift is required to explain the 0.3-1 % change in frequency as the burst cools and the crust presumably subsides. Bildsten calculated such a lift in the development of bursts Bildsten95 . From this point of view it appears physically reasonable. However, the implied frequency difference between the neutron star’s interior and the crust, of 1-3 Hz, implies that in a few seconds the hot spot at the photosphere has rotated several times around a spot fixed on the neutron star, such as a magnetic pole. If the magnetic field and the crust material are coupled, the magnetic field would have been wound up several times, and be an important factor.
Conclusions
In Type I bursts, we can truly say that the explosion throws light on the objects and on the process causing the explosion. Limits on the neutron star masses, radii, and distances come from the spectra, and if oscillations are from a rotating hot spot, from the oscillation amplitudes. At least one burster definitely is a low magnetic field ( Gauss) fast rotating pulsar and the evidence is strong for millisecond periods in 6 other bursters. The spectral and timing data tell a story of the dynamics of the crust as it is lifted, expelled sometimes, and settles back down on the neutron star.
If oscillations are found in bursts from a pulsing burster like SAX J1808.4-3658, comparison to the pulse period would be very revealing. Finding kHz QPO in the persistent flux from such a source would also be revealing, allowing comparison of the difference frequency with the known pulse frequency. In both cases, it might be that the phenomenon does not occur under the conditions of field and accretion rate pertaining for the pulsar. It is clear that the phenomena depend on the accretion rate and on the magnetic field. More work is needed on whether more sources have burst and persistent flux oscillations and possibly coherent pulsations at some level.
The newly found phenomena have the potential for clarifying the geometry and flow patterns of the accretion and independently constraining the neutron star parameters. Definitive conclusions about the burster neutron stars based on the spectra and luminosities have been hampered by statistical as well as possible systematic errors and by evidence that over determined results were not consistent. Now that new degrees of freedom are known (fast spin, asymmetrical temperature distribution, disk very close to the neutron star), a verifiable corrected picture should be pursued.
I greatly appreciated the in-depth discussions at the 1999 Aspen Summer workshop “X-Ray Probes of Relativistic Effects near Neutron Stars and Black Holes.”
References
- (1) X-Ray Binaries, New York: Cambridge Univ. Press, 1995, Chapt. 2, pp 58-125.
- (2) Bildsten, L. The Many Faces of Neutron Stars, Dordrecht: Kluwer, 1998, Chapt. 4, pp 419-449.
- (3) Strohmayer, T. E., Swank, J. H., and Zhang, W., The Active X-ray Sky: Results from BeppoSAX and RXTE, 1998, New York:Elsevier, pp 129-134.
- (4) Strohmayer, T. E., X-ray Astronomy ’99: Stellar Endpoints, AGN and the Diffuse X-ray Background, 2000, Bologna, in press.
- (5) van Paradijs, J.,Nature. 274, 650–653 (1998).
- (6) Swank, J. H. Becker, R. H., Boldt, E. A., Holt, S. S., Pravdo, S. H., and Serlemitsos, P. J., ApJ. 212, L73 (1977).
- (7) Waki et al., Publ. Astron. Soc. Japan. 36, 819-830 (1984).
- (8) London, R. A., Taam, R. E., and Howard, W. M. , Ap. J. 287, L27–30 (1984).
- (9) Ebisuzaki, T., Publ. Astron. Soc. Japan. 39, 287–308 (1987).
- (10) Titarchuk, L. , Soviet Astr. Lett. 14, 229 (1988).
- (11) Ebisuzaki, T., and Nakamura, N., Ap.J. 328, 251–255 (1988).
- (12) Ebisuzaki, T., and Nakamura, N., Ap. J. 328, 251–255 (1988).
- (13) van Paradijs, J., Dotani, T., Tanaka, Y., and Tsuru, T., Publ. Astron. Soc. Japan. 42, 633–660 (1990).
- (14) Goffhelf, E., and Kulkarni, S. R., Ap. J. 490, L161–164 (1997).
- (15) Tomsick, J., Halpern, J. P., Kemp, J. Kaaret, P., Ap. J. 521, 341–350 (1988).
- (16) Chakrabarty, D., & Morgan, E. H., Nature. 394, 346 (1998).
- (17) in’t Zand, J. J. M., Heise, J., Muller, J. M., Bazzano, A., Cocchi, M., Natalucci, L., and Ubertini, P., Astron. and Astrophys.. 331, L25–2, (1998).
- (18) Marshall, F. E., Wijnands, R., and van der Klis, M. ., IAUC. 6876 (1998).
- (19) Wijnands, R., and van der Klis, M., Nature. 394, 344 (1998.)
- (20) Chakrabarty, D., & Morgan, E. H., Nature. 394, 346 (1998).
- (21) Psaltis, D., and Chakrabarty, D., Ap. J. 521, 332-340 (1999).
- (22) van der Klis, M., Hasinger, G., Da,en, E., Penninx, W., van Paradijs, J., and Lewin, W. H. G. , Ap. J. 360, L19-22 (1990).
- (23) Miller, C., X-ray Astronomy ’99: Stellar Endpoints, AGN and the Diffuse X-ray Background., 2000, Bologna, in press.
- (24) Stella, L., Vietri, M., and Morsink, S. M., Ap. J. 524, L63–66 (1999).
- (25) Strohmayer, T. E., this volume, 2000, in press.
- (26) Bildsten, L., Ap. J. 501, L89–93 (1998).
- (27) Strohmayer, T. E., and Markwardt, C. B., Ap. J. 516, L81–85 (1999).
- (28) Bildsten, L., Ap. J. 438, 852–875 (1995).