Discovery of Recurring Soft to Hard State Transitions in LMC X-3
Abstract
We present the analysis of an approximately 3 year long Rossi X-ray Timing Explorer (RXTE) monitoring campaign of the canonical soft state black hole candidates LMC X-1 and LMC X-3. In agreement with previous observations, we find that the spectra of both sources can be well-described by the sum of a multi-temperature disk blackbody and a power law. In contrast to LMC X-1, which does not exhibit any periodic spectral changes, we find that LMC X-3 exhibits strong spectral variability on time scales of days to weeks. The variability pattern observed with the RXTE All Sky Monitor reveals that the variability is more complicated than the 99 d or 198 d periodicity discussed by Cowley et al. [Cowley et al. 1991]. For typical ASM count rates, the luminosity variations of LMC X-3 are due to changes of the phenomenological disk blackbody temperature, , between keV to keV. During episodes of especially low luminosity (ASM count rates ; four such periods are discussed here), strongly decreases until the disk component is undetectable, and the power law significantly hardens to a photon index of . These changes are consistent with state changes of LMC X-3 from the soft state to the canonical hard state of galactic black holes. We argue that the long term variability of LMC X-3 might be due to a wind-driven limit cycle, such as that discussed by Shields et al. [Shields et al. 1986].
keywords:
accretion – black hole physics – Stars: binaries – X-rays: Stars – Stars: LMC X-1, LMC X-31 Introduction
Long term variability on time scales of months to years is seen in many galactic black hole candidates. In analogy to the 35 d cycle of Her X-1, the long term variability of some objects has been identified with the precession of a warped accretion disk. Possible driving mechanisms for a warp include radiation pressure due to the luminous central X-ray source [Pringle 1996, Maloney et al. 1996, Maloney & Begelman 1997, Maloney et al. 1998], torques exerted by an accretion disk wind [Schandl & Meyer 1994, Schandl 1996], or tidal forces (Larwood 1998, and references therein).
In some sources, the long term changes in the X-ray luminosity have been associated with state changes of the accretion disk. At low luminosities, these sources are usually observed in the hard state, in which the X-ray spectrum is dominated by a hard power-law component with a photon index of and an exponential rollover at keV. The hard state spectrum is usually described in terms of thermal Comptonization (Sunyaev & Trümper 1979; Dove et al. 1997; and references therein). At higher luminosities, black hole candidates exhibit a soft spectrum that can be characterized by a (multi-temperature) blackbody with a peak temperature of keV. In addition, a power law with a photon index of or softer is present. Changes between the spectral states are typical for black holes as is evidenced by the 1996 soft state of Cygnus X-1 [Cui et al. 1997, Cui et al. 1998], and the frequent transitions seen in GX 3394 [Makishima et al. 1986, Bouchet et al. 1993, Wilms et al. 1999a, Corbel et al. 2000]. See Tanaka & Lewin [Tanaka & Lewin 1995], Nowak [Nowak 1995], and references therein for further details.
Prior to the observations discussed here, LMC X-1 and LMC X-3 were the only black hole candidates that had always been seen in the soft state. Thus, both were ideal candidates for a systematic study of the properties of the soft state. Although both sources were otherwise thought to be spectrally very similar, LMC X-1 had not shown signs of any periodic long term variability, while LMC X-3 was known to be variable on a 100 d time scale [Cowley et al. 1991, Cowley et al. 1994]. We therefore initiated a two resp. three year long campaign to observe LMC X-1 and LMC X-3 with the Rossi X-ray Timing Explorer (RXTE). During the campaign we performed X-ray observations of roughly 10 ksec length at approximately three week intervals. The spacing and exposure time of the observations were chosen such that they would enable us to track spectral changes of the sources over any long term variability pattern. The campaign was started in 1996 December with two long () observations of the sources. The analysis of these observations is presented in a companion paper (Nowak et al., 2000, henceforth paper I). Preliminary results from the first year of this campaign, using earlier versions of the response matrix and background models, have been presented elsewhere [Wilms et al. 1999b, Wilms et al. 1999c], this paper is devoted to a discussion of the first two years of the campaign.
The remainder of this paper is structured as follows. In Section 2 we present the details of our data analysis procedure. Section 3 is devoted to the study of LMC X-3. Section 4 contrasts these observations with those from LMC X-1. In Section 5 we interpret our results in the context of current models for the soft state of galactic black hole candidates, and in the context for models of the long term variability of X-ray binaries. We summarize our results in Section 6. Throughout this paper we assume a distance to the LMC of 50 kpc.
2 Data Analysis
Onboard RXTE are two pointed instruments— the Proportional Counter Array (PCA) and the High Energy X-ray Timing Experiment (HEXTE)— as well as the All Sky Monitor (ASM). We used the standard RXTE data analysis software, ftools 4.2, to examine the PCA and HEXTE data. Spectral modeling was done using xspec, version 10.00ab [Arnaud 1996]. Due to the short duration of the pointed observations we use only the PCA data for this analysis. We used essentially the same data screening and analysis strategy as in paper I, i.e., we used PCA top xenon layer data only and ignored data taken within 30 minutes after passages through the south Atlantic anomaly and where the background count rate, as measured by the “electron ratio”, was comparatively large (see paper I for details). Data from all PCUs was combined for the final analysis. Contrary to paper I, the observations presented here are so short that the Poisson error dominates the uncertainty of the spectrum; therefore, no systematic error was applied to the data. For some of the observations, only part of the PCA detectors were turned on. These intervals were extracted separately and then combined. Response matrices were generated for each of these intervals. The response matrix for the final analysis was obtained from these individual matrices by adding the matrices weighted by the fraction of photons coming from each of the intervals. We analyzed data taken in the energy band from 2.5 keV to 20 keV.
Since our data are background dominated above 5 keV, good background modeling is essential for our analysis. Background subtraction of the PCA data was performed using a model taking into account sky pointings of the PCA, and modeling the background variability using data from the Very Large Event (VLE) counter of the PCA or using the so-called “Faint model”, depending on the source count rate. To estimate the uncertainty of the background model we compared the count rate measured in the PCA channels above 30 keV, where no source photons are detected, with the background model flux at these energies. In all cases the agreement between the background model and the measured background was within 2%. We accounted for this fluctuation by renormalizing the background model flux, using the xspec corrfile facility, such that was minimized in our spectral fits. Note that this introduces a “hidden” fitting parameter to the data analysis. This parameter was not taken into account in the number of degrees of freedom since we assume that it converges to the correct normalization of the background model, and therefore does not introduce an uncertainty into the spectral fitting process.
We used data from the ASM in order to be able to place our observations in the context of the long term variability of the sources. This instrument, an array of shadow cameras scanning the whole sky visible from the spacecraft for five to ten times per day [Remillard & Levine 1997, Levine et al. 1996], provides almost uninterrupted information about the long term behaviour of bright X-ray sources. We used the “definitive one-dwell” data available from the Goddard Space Flight Center (GSFC) and only used flux solutions for which .
3 LMC X-3: Long Time Scale Spectral Variability
3.1 Introduction
The black hole candidate LMC X-3 was discovered during UHURU observations of the Large Magellanic Cloud [Leong et al. 1971]. A summary of the early observational history has been given by Treves et al. [Treves et al. 1988]. Interest in LMC X-3 was heightened when it was realized that its X-ray spectrum is very similar to that of Cyg X-1 in the high state. White & Marshall [White & Marshall 1984] therefore established the source as a potential black hole candidate. Subsequent radial velocity measurements, resulting in a mass function of 2.3 [Cowley et al. 1983], as well as optical photometry (van der Klis et al. 1983; Kuiper et al. 1988; and references therein) of the B3V companion lead to a minimum mass of 4 [Mazeh et al. 1986], with a most probable mass of 9–10 [Cowley et al. 1983, Paczyński 1983] for the compact object. LMC X-3 thus almost certainly contains a black hole.
The luminosity of LMC X-3 can be as much as 30% of the Eddington luminosity of a 9 black hole. The source has been known to be strongly variable since Ariel V and the High Energy Astrophysics Observatory 1 (HEAO 1) discovered large () intensity changes on time scales of weeks to months [Griffiths & Seward 1977, Johnston et al. 1979]. A first systematic study of its long term periodicity was performed by Cowley et al. [Cowley et al. 1991], who, based on Ginga and HEAO 1 data, found a long term period of 98.9 d or 197.8 d. In addition, optical photometry indicated a lag of d between the optical and the X-rays (the optical leading the X-rays; Cowley et al. 1991). Later Hubble Space Telescope (HST) investigations revealed the presence of the periodicity also in the ultraviolet [Cowley et al. 1994], albeit the long term trends were not as clear as in the earlier data. These HST observations and the shape of the X-ray lightcurve led Cowley et al. [Cowley et al. 1994] to prefer the d period and to postulate that LMC X-3 might have gone through a low-luminosity state similar to the “extended low” states that are seen in Her X-1 [Parmar et al. 1985].
Detailed spectral studies of the long term variability were first performed by Ebisawa et al. [Ebisawa et al. 1993], who used data from Ginga LAC pointings, taken over a period of three years, that covered a large range of source luminosities. Ebisawa et al. showed that the X-ray spectra could be well-described with a multi-temperature disk blackbody model plus a power-law spectrum. Alternatively, optically thick () Comptonization could be used (see also Treves et al. 1988), but is not preferred due to the unphysical parameters resulting from the spectral fitting. In accordance with Cowley et al. [Cowley et al. 1991], Ebisawa et al. [Ebisawa et al. 1993] found that the soft spectral component hardens with increasing source luminosity (i.e., its temperature inceases), while the power-law tail was found to be independent of the luminosity. One possible interpretation of this result is a varying mass accretion rate .
A major shortcoming of the earlier spectral observations is that it was impossible to put the observations in the context of the overall long term variability of the source due to the lack of a real all-sky monitoring instrument. Furthermore, the relative inflexibility of the early X-ray satellites made it impossible to obtain an even sampling of X-ray spectra over the long time scale changes observed. A satellite such as RXTE, which combines a broad spectral coverage with very flexible scheduling and an all-sky monitoring instrument, is therefore ideal to systematically study the long term behaviour of sources such as LMC X-3. In the remainder of this section we discuss the RXTE-ASM soft X-ray lightcurve (§3.2), describe our analysis of the pointed data (§3.3), and present the results of our campaign (§3.4).
3.2 Long Term Variability of LMC X-3
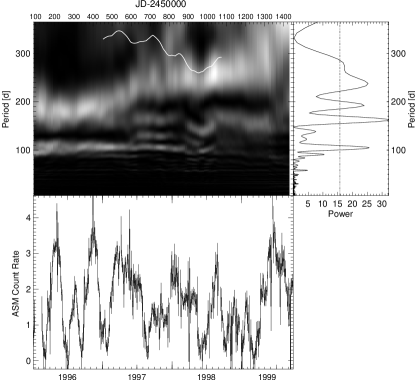
In Fig. 1c we display the long term light curve of the object as observed with the ASM, binned to a resolution of 3 d. Note the strong variability on time scales of and d, which is well sampled by our monitoring (see Fig. 3). This variability had already been noted during the first year of ASM operations [Levine et al. 1996].
The variability pattern itself is very complicated. The analysis of the ASM light curve using the generalized periodogram of Lomb [Lomb 1976] and Scargle [Scargle 1982] reveals significant periodicities on long time scales of , , , and days (Fig. 1b). Epoch folding analysis [Leahy et al. 1983, Schwarzenberg-Czerny 1989, Davies 1990] independently verifies this result. No significant variability (using the full temporal resolution ASM lightcurve) is detected by these methods on the 1.7 d orbital time scale of the system. This is consistent with earlier results [Weisskopf et al. 1983, Cowley et al. 1983, van Paradijs et al. 1987], but contrary to other high mass X-ray binaries, such as Cyg X-1 or Vela X-1, where a clear orbital modulation of the X-ray flux is detected in the ASM. For these latter sources, this variation is most probably due to photoelectric absorption in the stellar wind [Wen et al. 1999]. The lack of orbital variability in LMC X-3 can therefore be interpreted as a lack of a strong stellar wind from the companion star. This is not very surprising, considering that the companion is a B3 V star [Warren & Penfold 1975, Cowley et al. 1994].
Compared to sources with clear perioditicies such as Her X-1, the peaks in the Lomb-Scargle periodogram of Fig. 1b are quite broad. This can be a sign that the periods detected by this method are only quasi-periodic, i.e., they change with time or are not present during the whole time span covered. We therefore computed a dynamical Lomb-Scargle periodogram by taking slices of the ASM light curve (binned to a resolution of 3 d) with a length of 730 d each, and shifting these slices with a step size of 9 d over the whole ASM data range111In order to extend the dynamical periodogram to the full length of time covered by the ASM data, we added gaussianly distributed random data spanning one year before and after the ASM light curve. Each fake data set was chosen to have the same mean and variance of the first and last year, respectively, of the actual measured data set.. For each of these slices the Lomb-Scargle periodogram was computed for the period range from 6 d to 365 d. To ensure that the periodograms are comparable, we normalized them such that
| (1) |
where and are the minimum and maximum frequency for which the Lomb-Scargle periodogram is computed, and where is the variance and the mean ASM count rate of the 730 d lightcurve. The resulting periodogram was then gray scale coded and is displayed in Fig. 1a, with each periodogram being displayed at the mid-time of the light curve for which it was computed.
Although the individual Lomb-Scargle periodograms are obviously not statistically independent, our approach is useful in revealing the long term trends of the light curve. Fig. 1a shows clearly the origin of the individual peaks in the total periodogram of the source. Albeit with varying significance, the dynamical periodogram shows that a d periodicity is present in all data segments analyzed through the middle of 1998, confirming the periodicity discussed by Cowley et al. [Cowley et al. 1994]. The d periodicity is mainly attributable to the times of low ( ASM cps) source luminosity, that are, e.g., seen in 1996 July, 1997 January, and 1997 August (Fig. 1c). After mid 1998, the amplitude of the 100 d periodicity is seen to decrease; however, some of this reduction in amplitude can be attributed to the increasing inclusion of fake data in a given two year periodogram. A possible shift in the distance between the light curve minima during mid 1998 through 1999 may lead to the additional time scale of d present in Fig. 1b (although see the discussion below). The ASM lightcurve for 1996 looks similar to the folded HEAO 1 and Ginga lightcurve presented by Cowley et al. [Cowley et al. 1991]. This might be an indication that the “quasi-sinusoidial” variability of 1996 is not just a random event, but occurs frequently.
The peaks at lower frequency in the total Lomb-Scargle periodogram are due to long term periodicities that are not fixed in period. The dynamical Lomb-Scargle periodogram shows a dominant periodicity on a time scale of d in 1996, which increases to d for the 730 d light curve centered on 1997 December. These shifts in period can be attributed to the maxima of the ASM light curve, which behave quasi-sinusoidally in 1996 and then show an increase in period in 1997 and the first half of 1998, before (possibly) returning to a more periodic behaviour222Note that the determination of periods d in the dynamical Lomb-Scargle periodogram is difficult since it is based on segments of 730 d length only. Since the long period shows up in the total periodogram of Fig. 1b, however, we believe the dynamical periodogram to represent at least the general trends in the period shifting behaviour.. The strength of the individual peaks in the total periodogram (Fig. 1b) can thus be seen as partly depending on the duration of the intervals in which each period dominated. It is also possible that the d peak seen in the periodogram is the continuation of the d period seen at the start of 1996, while the d peak is due to the formation of a new periodicity beginning in late 1996 or early 1997. It is also interesting to note that the d and d periodicities that exist at the beginning of the ASM light curve have approximately the same period separation as the and day periods that exist at the end of the ASM light curve.
Although the ASM does in principle provide X-ray colour information, LMC X-3 is too weak to enable us to detect any statistically significant changes in the spectral shape during the three years of ASM coverage. Usable X-ray colours can only be computed after rebinning the data on d intervals. These data indicate that the source might harden during lower ASM count rates. With the ASM, however, it is not possible to characterize these changes in greater detail. We therefore turn to our pointed monitoring observations to further describe these spectral trends.
| Obs. | Date | Exposure | Count Rate |
|---|---|---|---|
| ymd | sec | counts s-1 | |
| 01 | 1996.12.05 | 139800 | |
| 02 | 1996.12.29 | 7800 | |
| 03 | 1997.01.16 | 7600 | |
| 04 | 1997.02.07 | 9300 | |
| 05 | 1997.03.09 | 8000 | |
| 06 | 1997.03.21 | 7200 | |
| 07 | 1997.04.17 | 8500 | |
| 08 | 1997.05.05 | 5200 | |
| 09 | 1997.05.27 | 8400 | |
| 10 | 1997.06.18 | 8100 | |
| 11 | 1997.07.04 | 6200 | |
| 12 | 1997.08.03 | 5900 | |
| 13 | 1997.08.19 | 8100 | |
| 14 | 1997.09.09 | 9400 | |
| 15 | 1997.09.12 | 7900 | |
| 16 | 1997.09.19 | 8500 | |
| 17 | 1997.09.23 | 10300 | |
| 18 | 1997.10.11 | 7300 | |
| 19 | 1997.11.02 | 8400 | |
| 20 | 1997.11.23 | 8900 | |
| 21 | 1997.12.12 | 3300 | |
| 22 | 1998.01.06 | 8200 | |
| 23 | 1998.01.24 | 6100 | |
| 24 | 1998.02.20 | 9100 | |
| 25 | 1998.03.12 | 6600 | |
| 26 | 1998.04.06 | 9200 | |
| 27 | 1998.05.07 | 7600 | |
| 28 | 1998.05.29 | 9400 | |
| 29 | 1998.06.29 | 3400 | |
| 30 | 1998.07.20 | 9800 | |
| 31 | 1998.08.12 | 7700 | |
| 32 | 1998.09.02 | 4200 | |
| 33 | 1998.09.30 | 7600 |
Exposure times shown are rounded to the closest 100 sec. The count rate is background subtracted
3.3 Spectral Modeling of LMC X-3 PCA Data
Using the screening criteria of section 2, we extracted the data from our 1997 and 1998 observations. A log of the observations is given in Table 1. Our conservative screening criteria reduce the effective usable exposure times from the scheduled 10 ksec to the times shown in the Table.

We modeled the RXTE spectra using the standard multi-temperature disk model [Mitsuda et al. 1984, Makishima et al. 1986] plus an additional power law component. This is the traditional spectral model for describing the X-ray continuum of the soft state. We further discuss below the interpretation and possible shortcomings of this model (§5, see also paper I). Our fits generally gave acceptable results. Several observations, however, showed evidence for deviations of the residuals in the iron K band. Although these deviations are mainly in the 2 range, adding a narrow ( keV) iron line to the model improved our fits. We therefore added a narrow Gaussian line feature at 6.4 keV to all of our fits. Although the presence of a line is consistent with our analysis from paper I, we note that Fe line studies with the PCA are complicated by the presence of systematic features in the PCA response matrix [Wilms et al. 1999a] and by the fact that the power-law and the disk model have comparable flux in the Fe-line region. The line parameters that we found here, therefore, should be seen as consistent with an upper limit of 60 eV for the equivalent width. We took the absorption in the intervening interstellar medium into account by fixing the equivalent hydrogen column to the value found from radio and ASCA observations (Lister-Staveley, 1999, priv. comm.; see also paper I), using the cross sections of Bałucińska-Church & McCammon [Bałucińska-Church & McCammon 1992]. Using a fixed is justified since preliminary modeling showed that none of the observations had the large values that are detectable with the PCA energy range and spectral resolution (; Stelzer et al. 1999).
We list the results of our spectral modeling in Tab. 2, and a typical spectrum is shown in Fig. 2. Generally, the spectral model described the data satisfactorily with reduced values of . We note that especially for some brighter observations, the formal values are influenced by systematic features in the response matrix. This can be examined, e.g., by comparing the ratio between the data and the best fit model, with the ratio between an observation of the Crab pulsar and nebula and the best fit power law to that observation [Wilms et al. 1999a]. Visual inspection reveals that the deviations between the data and the model for all monitoring observations were comparable to or smaller than those seen in the Crab. Thus, although in these cases, adding additional spectral components to the model would only serve to model the response matrix features and not the observed spectrum. We are therefore confident that, given the spectral resolution of the PCA and the faint flux level of LMC X-3, we have found a satisfactory spectral description for all pointed observations.
We emphasize that the interpretation of the spectral components in terms of physical parameters, however, is hampered by the properties of the multi-temperature disk blackbody model. This discussion is necessitated by the result that the typical power law indices found in our data analysis are softer than those found by Ginga (; Ebisawa et al. 1993). A more detailed discussion can be found in paper I. A problem associated with using the multi-temperature disk blackbody plus a power law for modeling the soft state is that especially for large (i.e., soft power-law tail), the power law can have a non-negligible flux in the lowest pulse height analyzer (PHA) channels so that the fit parameters of the power law are almost completely determined by these low channels. This effect is present in most of our fits for which . We tried to limit the influence of the power law in the higher PHA channels with several other spectral models, e.g., by adding a heavily absorbed power-law to the disk blackbody, by using a modified multi-temperature disk blackbody which includes a high energy power law tail only above a given energy, or by applying thermal Comptonization models. None of these models resulted in acceptable values. In addition, using the multi-temperature disk blackbody and leaving the equivalent column a free fit parameter always resulted in .
The only model, apart from the one that we adopted here, which allowed us to describe the spectrum of LMC X-3 with similar or even better values was a multi-temperature disk blackbody to which a low energy blackbody spectrum was added. Such a model has been successfully applied, e.g., also to the 1997 RXTE observations of GRO J165540 [Rothschild et al. 1999]. Although such a model works for those observations of LMC X-3 where we find , the model fails to reproduce those observations where a harder power law component is clearly present in the data. We therefore decided to use the multi-temperature disk blackbody spectrum plus a power law in our analysis.
The significant contribution of the power law in the low-energy PHA channels has some effect on the determination of the characteristic disk temperature, . As we noted in paper I, the blackbody temperature obtained from ASCA data was systematically lower than the derived from the PCA data. We speculated that this was due to the significance of the power law in the low energy PHA channels and the differing low energy cutoffs between the two detectors. We further speculated that the ASCA fit temperature was more characteristic of the temperature for the “seed photons” that are Compton upscattered to become the high energy spectrum. As we further discuss below for our observations of LMC X-1 (§4.2), the presence of the power law may greatly affect the determination of the blackbody normalization, .
| Obs. | EW | ||||||
|---|---|---|---|---|---|---|---|
| keV | eV | ||||||
| 01 | |||||||
| 02 | |||||||
| 03 | |||||||
| 04 | |||||||
| 05 | |||||||
| 06 | |||||||
| 07 | |||||||
| 08 | |||||||
| 09 | |||||||
| 10 | |||||||
| 11 | |||||||
| 12 | |||||||
| 13 | |||||||
| 14 | |||||||
| 15 | |||||||
| 16 | |||||||
| 17 | |||||||
| 18 | |||||||
| 19 | |||||||
| 20 | |||||||
| 21 | |||||||
| 22 | |||||||
| 23 | |||||||
| 24 | |||||||
| 25 | |||||||
| 26 | |||||||
| 27 | |||||||
| 28 | |||||||
| 29 | |||||||
| 30 | |||||||
| 31 | |||||||
| 32 | |||||||
| 33 |
, : peak multi-temperature disk temperature and normalization. : photon index of the power law : Power law normalization (photons keV-1 cm-2 s-1 at 1 keV). : Line normalization (photons cm-2 s-1 in the line), the Gaussian line was fixed at 6.4 keV with a width of 0.1 keV. EW: line equivalent width. Uncertainties are at the 90% confidence level for one interesting parameter (), the interstellar equivalent column was fixed at .
3.4 Transitions between the Soft and Hard State
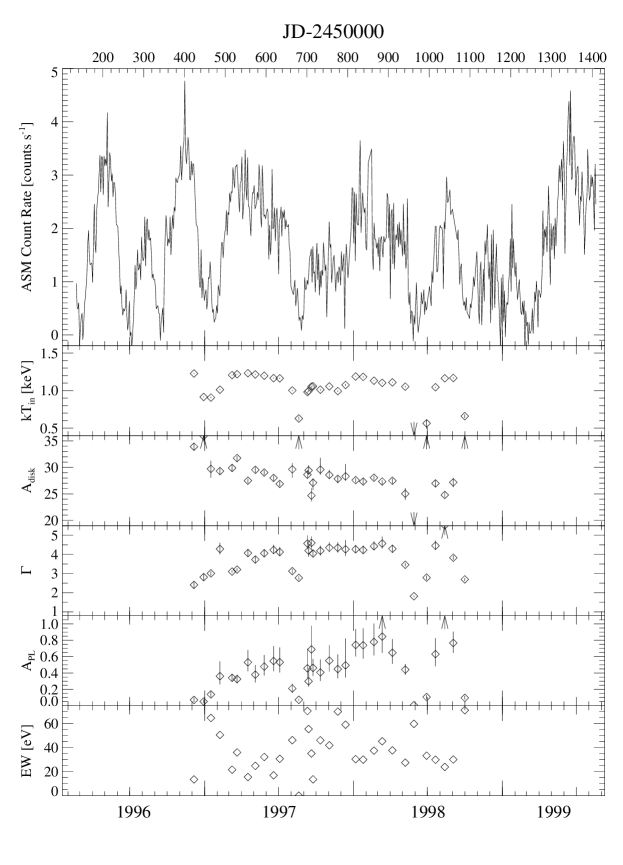
We now discuss the variations of the spectral parameters in terms of the long term variability of LMC X-3. In Fig. 3 we display the spectral variation of LMC X-3 in the context of its ASM long term light curve. The plot reveals a clear correlation between the total source luminosity, as expressed by the ASM count rate, and the parameters of the soft spectral component. During times of higher source luminosity, the temperature of the multi-temperature disk blackbody, , increases. At the same time, the normalization of the disk blackbody stays remarkably constant (see also Fig. 5d). This effect is similar to that found in the soft-state of other galactic black holes [Tanaka & Lewin 1995]. During episodes of comparably low ASM count rate, however, the spectrum shows clear deviations from the typical pure soft state behaviour. During our campaign, there were four of these events: in 1997 January, 1997 August, 1998 June, and 1998 October. During these times decreased to keV, while the photon index hardened (Fig. 5b). For the most extreme case, Obs28, no evidence for the soft component is seen, indicating that keV, and the photon index is . These values are remarkably similar to the typical hard state behaviour seen, e.g., in Cyg X-1. We interpret the decreases in the ASM countrate as evidence for transitions from the normal soft state into the hard state of LMC X-3.

In Fig. 4 we display the unfolded photon spectrum of Obs28, together with the spectra of the three subsequent monitoring observations, showing the transition from the pure hard state spectrum back to the soft state. Obs28 is the only observation of our campaign in which there is no detectable evidence for the soft component. The occurance of a pure hard state is thus either a very rare event for LMC X-3, or, if it is associated with each of the dips observed by the ASM, it is of relatively short duration. The data presented here represent the first observational detection of a pure hard state in LMC X-3. We speculate, however, that the data taken on HEAO 1 day 461 and mentioned by White & Marshall [White & Marshall 1984] might have been observed during one of the soft to hard state transitions. During this observation, however, the source was too faint for HEAO 1 to obtain even a reliable measurement of the hardness ratio. Furthermore, during 2000 April another hard state was seen [Boyd & Smale 2000], with the timing behavior being hard state like [Homan et al. 2000].


The hard state observation Obs28 is the observation with the lowest PCA count rate of our campaign, it was also performed close to one of the lowest ASM fluxes seen so far. In Fig. 6 we display as a function of the ASM countrate averaged over 1 d worth of ASM dwellings centered on the observation. In the figure we have identified spectra for which keV. All of these spectra also show a power law component which is relatively strong compared to the soft spectral component. These data indicate that for ASM count rates cps a transition to the hard state behaviour is probable. Therefore, it is possible to use the ASM count rate as a trigger for future systematic studies of the soft to hard transition in LMC X-3.
Our monitoring observations are too short to be able to characterize the variability of LMC X-3. We computed the average rms variability of the source from the background subtracted 16 s lightcurves. Although there is an apparent trend of the rms variability to increase with lower source flux, this trend is fully consistent with systematic variations due to PCA background model fluctuations at the 2% level. This level is consistent with the uncertainty of the background model found in the time series analysis presented in paper I, and also with the adjustments to the background flux found during the spectral modeling process. It is therefore impossible to check our interpretation of Obs28 being a hard state or an intermediate [Méndez & van der Klis 1997] state from its temporal characteristics. Much longer hard state observations ( ksec) are needed for this determination.
Outside of the hard states, LMC X-3 exhibits the standard behaviour of a classical soft state source. Fig. 5 displays several correlations between the spectral fit parameters. For power law indices there is a clear correlation between the power law flux and : the power law component hardens with decreasing power law flux (Fig. 5a). Such behaviour has been noted for GX 3394 [Wilms et al. 1999a] and the Seyfert 1 galaxy NGC 5548 [Chiang et al. 2000], albeit in their hard spectral states. Figs. 5b and c verify the results of Ebisawa et al. [Ebisawa et al. 1993] that during the soft state there is no strong correlation between the soft and the hard component. For , does not correlate with the accretion disk temperature, . There is a slight trend for the power law flux and to increase with ; however, the statistics of the data are not good enough to claim any firm correlation between these two parameters. In conjunction with the above spectral results for LMC X-3, in paper I we noted that the Fourier frequency-dependent coherence function indicated that the soft and hard X-ray components were uncorrelated with each other for LMC X-1 (the variability of LMC X-3 was too weak to perform such an analysis).

Finally, we consider the behaviour of the soft spectral component. The normalization of the multi-temperature disk blackbody, , is nearly constant throughout the monitoring observations (Fig. 5d), while strongly varies. A similar behaviour has been found in those soft state black hole candidates where the luminosity is dominated by the soft component [Tanaka & Lewin 1995]. If is interpreted literally, then , where is the innermost radius of the accretion disk, is the distance of the source, and is the disk inclination angle. In Fig. 5d we display the values of corresponding to our modeled values of on the upper -axis. The parameters for found here are typical for galactic black hole candidates [Yaqoob et al. 1993]. Interpreted in this framework, the constancy of for LMC X-3 could imply that the geometrical configuration of the accretion disk does not appreciably change during the soft state episodes of the object, and that all changes in the disk luminosity are accounted for via temperature changes. We also note that for disk blackbody temperatures keV, the data approximately agree with the proportionality of which is expected if and the inner disk radius moves outward, with relatively little bolometric luminosity change, during a soft-to-hard state transition (Fig. 5d, dashed line).
The literal interpretation of and , however, is not without problems [Merloni et al. 2000]. The innermost region of thin accretion disks is more complicated than assumed in the theory underlying the multi-temperature disk blackbody model. Even in simple accretion disk models [Shakura & Sunyaev 1973], the inner region of the accretion disk is dominated by electron scattering. Thus the emerging spectrum is slightly Comptonized. As a result, the observed does not correspond to the temperature of the inner edge of the disk, but rather equals the colour temperature of the disk [Ebisawa et al. 1991, Shimura & Takahara 1995]. Correcting for this effect is strongly model dependent, see, e.g., Shimura & Takahara [Shimura & Takahara 1995] and Merloni et al. [Merloni et al. 2000] for discussions. Furthermore, the presence of a hard spectral component can also influence , as we mentioned above (see also paper I and Sect. 4.2). We therefore consider it dangerous to use correlations between a (corrected) and fit parameters to draw firm conclusions on the geometry or physical environment of the observed system. The apparent independency of the disk normalization from its characteristic (colour) temperature , however, is striking in the case of LMC X-3. Any accretion disk theory attempting to model this object will have to explain this independency.
Finally, we note that no clear correlation is found between the equivalent width of the iron line and the other spectral parameters. This is consistent with our interpretation of the iron line parameters as upper limits.
4 LMC X-1: Long Time-Scale Spectral Variability
4.1 Introduction
Like LMC X-3, LMC X-1 was also discovered during the UHURU scans of the LMC. Its optical companion is a O(7–9)III star with a mass function of and an orbital period of 4.2 d (Cowley et al., 1995, Hutchings et al. 1987, Hutchings, Crampton & Cowley, 1983) in a photoionized He II nebula (Bianchi & Pakull 1985; Pakull & Angebault 1986). The luminosity of LMC X-1 is about erg/s [Long et al. 1981] and was found to be quite constant [Syunyaev et al. 1990].
The X-ray spectrum of LMC X-1 is similar to that of LMC X-3 (Ebisawa, Mitsuda & Inoue, 1989; paper I and references therein), although the relative flux of the disk black body with respect to the power law is smaller. There is again evidence for a weak Fe emission line.
The long term behavior of LMC X-1 during 1996 as seen by RXTE has been analyzed by Schmidtke, Ponder & Cowley [Schmidtke et al. 1999]. In agreement with previous observations these authors did not find evidence for any systematic variability on long timescales. We will, therefore, not re-analyse these data but concentrate in what follows on our monitoring data from 1997 and 1998.
4.2 Long Term Variability of LMC X-1
| Obs. | Date | Exposure | Count Rate |
|---|---|---|---|
| ymd | sec | counts s-1 | |
| 01 | 1996.12.06 | 128900 | |
| 02 | 1996.12.30 | 8600 | |
| 03 | 1997.01.18 | 8200 | |
| 04 | 1997.02.08 | 9300 | |
| 05 | 1997.03.09 | 3800 | |
| 06 | 1997.03.21 | 8200 | |
| 07 | 1997.04.16 | 10600 | |
| 08 | 1997.05.07 | 8600 | |
| 09 | 1997.05.28 | 7000 | |
| 10 | 1997.06.18 | 3600 | |
| 11 | 1997.07.04 | 3400 | |
| 12 | 1997.08.01 | 8500 | |
| 13 | 1997.08.20 | 7600 | |
| 14 | 1997.09.09 | 9600 | |
| 15 | 1997.09.12 | 8300 | |
| 16 | 1997.09.19 | 9100 | |
| 17 | 1997.10.10 | 9100 | |
| 18 | 1997.11.01 | 8800 | |
| 19 | 1997.11.23 | 6400 | |
| 20 | 1997.12.12 | 5100 | |
| 21 | 1998.01.04 | 8700 | |
| 22 | 1998.01.25 | 7100 | |
| 23 | 1998.02.20 | 9200 | |
| 24 | 1998.03.12 | 3300 | |
| 25 | 1998.04.07 | 9400 | |
| 26 | 1998.05.06 | 5500 | |
| 27 | 1998.05.28 | 8900 | |
| 28 | 1998.06.28 | 3700 | |
| 29 | 1998.07.19 | 9300 | |
| 30 | 1998.08.13 | 8000 | |
| 31 | 1998.09.02 | 5200 | |
| 32 | 1998.09.29 | 8600 |
Exposure times shown are rounded to the closest 100 sec. The count rate is background subtracted
| Obs. | EW | ||||||
|---|---|---|---|---|---|---|---|
| keV | eV | ||||||
| 01 | |||||||
| 02 | |||||||
| 03 | |||||||
| 04 | |||||||
| 05 | |||||||
| 06 | |||||||
| 07 | |||||||
| 08 | |||||||
| 09 | |||||||
| 10 | |||||||
| 11 | |||||||
| 12 | |||||||
| 13 | |||||||
| 14 | |||||||
| 15 | |||||||
| 16 | |||||||
| 17 | |||||||
| 18 | |||||||
| 19 | |||||||
| 20 | |||||||
| 21 | |||||||
| 22 | |||||||
| 23 | |||||||
| 24 | |||||||
| 25 | |||||||
| 26 | |||||||
| 27 | |||||||
| 28 | |||||||
| 29 | |||||||
| 30 | |||||||
| 31 | |||||||
| 32 |
See Tab. 2 for an explanation of the fit parameters. The interstellar equivalent column was fixed at .


The data of the monitoring observations of LMC X-1 were treated in the same way as those for LMC X-3. A log of the observations can be found in Tab. 3. During the campaign, the count rate of LMC X-1 was on average a factor of smaller than that of LMC X-3. Again, we modeled the PCA data using a multi-temperature disk blackbody plus a power law and an iron line. We assumed an equivalent hydrogen column of (Lister-Staveley, 1999, priv. comm., see also paper I), as is appropriate from the radio measurements. The results of the spectral modeling are shown in Tab. 4.
As for LMC X-3, the LMC X-1 spectra are well-described by a phenomenological model consisting of a disk blackbody (with –1 keV) and a soft () power law component. Fig. 7 displays the correlations among the fit parameters for LMC X-1. The most striking aspect of Fig. 7 is the apparent strong correlation between the phenomenological disk blackbody temperature, , and the disk blackbody normalization, . Furthermore, there is a weaker correlation between the disk temperature and the 2–20 keV power law flux. These correlations are such that the disk temperature decreases by while its normalization increases by a factor of . This yields an overall increase of the blackbody flux by a factor of . There is at the same time, however, a decrease by a factor of in the power law flux. In contrast to LMC X-3 the contribution of the power law makes up a greater fraction of the total 2–20 keV flux in LMC X-1; therefore, the decrease[increase] in disk temperature[normalization] corresponds to an overall decrease in 2–20 keV flux by only .

There are two possibilities to explain these spectral correlations. First, it is possible that, as in LMC X-3, the overall decrease in 2–20 keV flux corresponds to the beginnings of a transition to a low/hard state. Arguing against this notion, however, is that we do not see any corresponding hardening of the power law flux. Second, a more likely scenario is that we are seeing a complicated systematic interaction between the phenomenological disk component and power law component. For the soft photon indices seen in LMC X-1 there is a large contribution from the power law in the low-energy PHA channels. We therefore expect a strong systematic correlation between the power law flux, the disk temperature, and the disk normalization. In Fig. 8 we display the 99% error contours computed for all spectra from the monitoring campaign. A strong correlation between the parameters that is consistent with the general trend seen in Fig. 7d is apparent. This correlation within the individual datasets strongly points towards our second argument, that at least part of the correlation is due to systematic errors in our model. We note, however, that the total variation of the parameters is much larger than the uncertainty of the individual data points. It is possible, therefore, that at least part of the – correlation is indeed real. Observations with instruments with a lower energy boundary, however, are needed to verify this correlation.
Apart from a 50 d periodicity which is seen in many weak ASM sources (Benlloch-García et al. 2000, in preparation) and is likely due to the nodal precession of the RXTE orbit, no significant periodicity was found in the ASM data. The overall flux variability exhibited on the long time scales of the ASM and our monitoring observations is comparable to the variability observed on time scales of ksec, as discussed in paper I. In paper I we attributed the variability of LMC X-1 to accretion rate variations in a wind-fed accretion system.
5 The Superorbital Period of LMC X-3
The 100–250 day periodicities seen in the ASM lightcurve of LMC X-3 are significantly longer than the measured orbital period of 1.7 days. For the case of Her X-1, the 35 day super-orbital period (Giacconi et al., 1973 ) was interpreted almost immediately as the result of periodic obscuration by a precessing accretion disk which is tilted with respect to the plane of the binary system [Katz 1973]. The large amplitude of the X-ray flux (a factor of 30 between the ASM count rate during the “main on” and the “low state” is typical; see, e.g., Coburn et al., 1999), as well as numerous other observations (see Scott & Leahy 1999 and references therein), imply a near edge-on () disk. In addition, a fraction of the central X-ray flux of Her X-1 is likely scattered into our line of sight by an extended corona (Stelzer et al. 1999 and references therein). As discussed in the introduction, possible driving mechanisms for the disk-warp include radiation pressure due to the luminous central X-ray source [Pringle 1996, Maloney et al. 1996, Maloney & Begelman 1997, Maloney et al. 1998], torques exerted by an accretion disk wind [Schandl & Meyer 1994, Schandl 1996], or tidal forces (Larwood 1998, and references therein).
For the case of LMC X-3, if the super-orbital variability were also due to changes in the accretion disk geometry, we should be able to observe strong variations in as are observed for the turn-on of the Main-On state of Her X-1 [Kuster et al. 1999]. Were the large intensity drops in LMC X-3 by a factor of more than five at 5 keV seen solely due to variations in , we would expect columns on the order of blocking our line of sight. Although such columns are readily detectable with RXTE, they were not observed. Given the generally good model fits to the observed data and satisfactory residuals, only small changes of above the interstellar value appear to be allowed by the data. We conclude that the strong intensity variations of LMC X-3 are not due to the accretion disk blocking our line of sight.
LMC X-3 is spectrally similar to the X-ray binary V1408 Aql (=4U195711), which also shows evidence of long term (100–300 day) periodicities [Nowak & Wilms 1999]. Coupled with evidence from recent optical observations [Hakala et al. 1999], we have argued that V1408 Aql also exhibits evidence of a warped precessing disk [Nowak & Wilms 1999]. The ASM flux of V1408 Aql, however, varies only by a factor of (consistent with warp inclination angle changes of ; Nowak & Wilms 1999), which is far less than the factor of ASM flux variations seen for LMC X-3. Such large amplitude variations would be very difficult to achieve unless the inclination of the LMC X-3 system were comparable to that of Her X-1333Van der Klis et al. [van der Klis et al. 1983], however, argue for an inclination of LMC X-3 comparable to that which we inferred for V1408 Aql, i.e., . Recent X-ray observations of LMC X-3 (Boyd 1999, priv. comm.) show tentative evidence of an orbital modulation. This might indicate some warping of at least the outer disk edge (see, for example, Dubus et al. 1999), in conjunction with the other long term variability mechanisms discussed below.. Given the lack of any strongly detected variability on the orbital time scale in the ASM lightcurve of LMC X-3, this seems unlikely.
As discussed in §3.4, spectroscopy yields strong indications that LMC X-3 is periodically transitting into and out of the canonical low/hard X-ray spectral state of galactic black holes. Such transitions are typical for black holes as they drop below of their Eddington luminosity (Nowak 1995; and references therein). If the peak ASM flux corresponds to , then the observed transition flux threshhold of cps in the ASM is roughly consistent with 5% of the Eddington luminosity. The question then arises of why LMC X-3 apparently shows evidence for large accretion rate variations, whereas LMC X-1 does not and V1408 Aql might not444V1408 Aql historically has had far fewer X-ray observations than LMC X-3; therefore, the range of its X-ray spectral variations is far less certain..
One possible explanation for the periodic variability seen in LMC X-3 is a Compton heated accretion disk wind-driven limit cycle, as discussed by Shields et al. [Shields et al. 1986]. At large radii, in the optically thin upper atmosphere of the outer disk, the central X-ray source will heat the disk temperature to the inverse Compton temperature given by
| (2) |
where is the central source flux per unit frequency [Begelman et al. 1983, Begelman & McKee 1983, Shields et al. 1986, Schandl & Meyer 1994]. If the sound speed for the inverse Compton temperature exceeds the escape velocity in the outer disk, a coronal wind can be driven off of the disk. For this to occur, the outer disk must have a radius
| (3) |
LMC X-1, which is likely a wind-fed accretion system (paper I, and references therein), probably has a much smaller circularization radius than this value, perhaps substantially so, and therefore is not expected to be driving off a wind from its outer disk. V1408 Aql, assuming a primary and a companion, has a disk circularization radius of cm, and also is not expected to be driving off a substantial wind (although it may show signs of a photoionized atmosphere; Nowak & Wilms 1999). For the measured system parameters of LMC X-3, the disk circularization radius is cm, and therefore may be driving a substantial Compton-heated wind.
This opens up the possibility that the central X-ray source of LMC X-3 drives off a sufficiently strong wind such that it “starves” itself of fuel. The mass accretion rate deficit then will propagate inwards on a viscous time scale. The central source X-ray flux will decrease thereby shutting off the wind, and a limit-cycle can then occur on a viscous time scale. This time scale can be of order of 100 days if , the usual disk viscosity parameter, is [Shields et al. 1986]. One requirement of the instability discussed by Shields et al. is that at the peak mass flux of the wind, a large fraction, , of the total accretion flow is expelled from the system. This is consistent with the large amplitude variability exhibited by LMC X-3 in the ASM lightcurve. As one expects the optical flux to come from large radii and the accretion rate fluctuations to propagate inwards from the outer disk, this picture is also consistent with the 20 day optical lead observed by Cowley et al. [Cowley et al. 1991].
To verify a picture such as discussed by Shields et al. [Shields et al. 1986], one must verify that the low/hard flux periods of LMC X-3 truly correspond to a ‘canonical’ low/hard state. Additionally, one needs to search for signs of the X-ray heated wind. As regards the former possibility, sufficiently long RXTE observations during the hard state ( ksec) should be able to detect the characteristically large amplitude variability of this state. Furthermore, it recently has been noted that low/hard states of galactic black holes, as opposed to high/soft states, typically show strong radio emission (Fender et al. 1999, Corbel et al. 1998, Zhang et al. 1997 and references therein). A previous radio survey of LMC X-1 and LMC X-3 at 3.5 and 6.3 cm did not result in the detection of these objects. The upper limits for the flux is 1.5 mJy for LMC X-1. For LMC X-3, an upper limit of 0.12 mJy at 3.5 cm and 0.18 mJy at 6.3 cm has been reported [Fender et al. 1998]. These upper limits, however, were measured during the soft state of LMC X-3. The above flux limits do not apply during the recurring episodes of the hard state. Scaling from Cyg X-1, LMC X-3 should be observable at a flux of mJy with a sensitive radio telescope during these phases.
6 Summary
In this work, we have presented the analysis of an approximately two year long RXTE monitoring campaign of LMC X-3 and LMC X-1. The primary results of these analyses are as follows.
-
•
Both LMC X-1 and LMC X-3 can usually be well-described by a phenomenological model consisting of a disk blackbody with keV and a soft () power law extending down to the lowest PHA channels.
-
•
LMC X-1 shows 2–20 keV energy flux variations with root mean square (rms) variability of on time scales of weeks to months. This is comparable to the rms variability exhibited on time scales ksec, as discussed in paper I. As elaborated upon in paper I, we attributed the variability to accretion rate variations in a wind-fed accretion system.
-
•
Accompanying the flux variations in LMC X-1 are correlations among the phenomenological disk blackbody temperature, disk blackbody normalization, and power law flux. These correlations could be due to variations near a soft state/hard state transition region. A strong possibility, however, is that these correlations are due to a systematic dependence of the phenomenological fit components upon one another.
-
•
LMC X-3 shows far larger 2–20 keV flux variations than LMC X-1, i.e., a factor of luminosity variations on 100–200 day time scales. These fluctuations are quasi-periodic, albeit with time-varying periods. At the beginning of the timespan covered by the ASM lightcurve, and day periods are present, whereas at the end of the timespan covered by the ASM lightcurve, and day periods are present.
-
•
The flux variations in LMC X-3 are correlated with clear spectral variations. At high ASM count rates, the flux variations are predominantly associated with variations of the phenomenological disk blackbody temperature, , while maintaining a relatively constant disk blackbody normalization, . As the ASM count rate drops below cps, the disk blackbody temperature drops, the disk blackbody normalization increases, and the power law photon index hardens to .
-
•
The spectral variations in LMC X-3 are consistent with recurring state transitions between the canonical high/soft and low/hard X-ray states of galactic black holes. One possible mechanism for explaining the observed periodicities and spectral variations is a wind driven limit-cycle, as discussed by Shields et al. [Shields et al. 1986].
As discussed above, there are several ways of determining whether the low flux/hard spectral states do represent canonical low/hard states of galactic black holes. First, a relatively long ( ksec) RXTE observation can determine whether the fast time scale variability is that expected. Second, one can search for an increase of the radio flux concurrent with the transition to the low/hard state, as has been seen for GX 3394 (Fender et al., 1999) and Cyg X-1 (Zhang et al., 1997). Evidence of a Compton-heated wind should also be searched for in LMC X-3. Sufficiently long observations with a sensitive X-ray spectroscopy instrument may reveal spectral evidence for a wind (e.g., emission lines in the 1 keV region) that may be driving a limit cycle in the LMC X-3 system.
Acknowledgements
The research presented in this paper has been financed by NASA grants NAG5-3225, NAG5-4621, NAG5-4737, NSF grants AST95-29170, AST98-76887, DFG grant Sta 173/22, and a travel grant to J.W. and K.P. from the Deutscher Akademischer Austauschdienst. We thank Didier Barret, Omer Blaes, Włodzimierz Kluźniak, Phil Maloney, Chris Reynolds, Richard Rothschild, Greg Shields, and Ron Taam for helpful discussions. Lister Staveley-Smith provided us with the unpublished values for LMC X-1 and LMC X-3. MAN and JW acknowledge the hospitality of the Aspen Center for Physics and all participants of the Aspen 1999 summer workshop on “X-ray Probes of Relativistic Astrophysics” for discussions.
References
- [Arnaud 1996] Arnaud K.A., 1996, in Jacoby J.H., Barnes J., eds, Astronomical Data Analysis Software and Systems V. Astron. Soc. Pacific, Conf. Ser. 101 Astron. Soc. Pacific, San Francisco, p. 17
- [Bałucińska-Church & McCammon 1992] Bałucińska-Church M., McCammon D., 1992, ApJ, 400, 699
- [Begelman & McKee 1983] Begelman M.C., McKee C.F., 1983, ApJ, 271, 89
- [Begelman et al. 1983] Begelman M.C., McKee C.F., Shields G.A., 1983, ApJ, 271, 70
- [Bianchi & Pakull 1985] Bianchi L., Pakull M., 1985, A&A, 146, 242
- [Bouchet et al. 1993] Bouchet L., Jourdain E., Mandrou P., et al., 1993, ApJ, 407, 739
- [Boyd & Smale 2000] Boyd P., Smale A., 2000, IAU Circ. 7424
- [Chiang et al. 2000] Chiang J., Reynolds C.S., Blaes O.M., et al., 2000, ApJ, 528, 292
- [Coburn et al. 1999] Coburn W., Heindl W.A., Wilms J., et al., 1999, ApJ submitted
- [Corbel et al. 2000] Corbel S., Fender R., Tzioumis T., et al., 2000, A&A submitted
- [Corbel et al. 1997] Corbel S., Fender R.P., Durouchoux P., et al., 1997, in Dermer C.D., Strickman M.S., Kurfess J.D., (eds.), Proc. 4th Compton Symposium, AIP Conf. Proc. 410, AIP, Woodbury , p. 937
- [Cowley et al. 1983] Cowley A.P., Crampton D., Hutchings J.B., et al., 1983, ApJ, 272, 118
- [Cowley et al. 1995] Cowley A.P., Schmidtke P.C., Anderson A.L., McGrath T.K., 1995, PASP, 107, 145
- [Cowley et al. 1991] Cowley A.P., Schmidtke P.C., Ebisawa K., et al., 1991, ApJ, 381, 526
- [Cowley et al. 1994] Cowley A.P., Schmidtke P.C., Hutchings J.B., Crampton D., 1994, ApJ, 429, 826
- [Cui et al. 1998] Cui W., Ebisawa K., Dotani T., Kubota A., 1998, ApJ, 493, L75
- [Cui et al. 1997] Cui W., Heindl W.A., Rothschild R.E., et al., 1997, ApJ, 474, L57
- [Davies 1990] Davies S.R., 1990, MNRAS, 244, 93
- [Dove et al. 1998] Dove J.B., Wilms J., Nowak M.A., et al., 1998, MNRAS, 289, 729
- [Dubus et al. 1999] Dubus G., Lasota J., Hameury J., Charles P., 1999, MNRAS, 303, 139
- [Ebisawa et al. 1993] Ebisawa K., Makino F., Mitsuda K., et al., 1993, ApJ, 403, 684
- [Ebisawa et al. 1991] Ebisawa K., Mitsuda K., Hanawa T., 1991, ApJ, 367, 213
- [Ebisawa et al. 1989] Ebisawa K., Mitsuda K., Inoue H., 1989, PASJ, 41, 519
- [Fender et al. 1999] Fender R., Corbel S., Tzioumis T., et al., 1999, ApJ, 519, L165
- [Fender et al. 1998] Fender R.P., Southwell K., Tzioumis A.K., 1998, MNRAS, 298, 692
- [Giacconi et al. 1973] Giacconi R., Gursky H., Kellogg E., et al., 1973, ApJ, 184, 227
- [Griffiths & Seward 1977] Griffiths R.E., Seward F.D., 1977, MNRAS, 180, 75p
- [Hakala et al. 1999] Hakala P.J., Muhli P., Dubus G., 1999, MNRAS, 306, 701
- [Homan et al. 2000] Homan J., Jonker P.G., van der Klis M., Kuulkers E., 2000, IAU Circ. 2425
- [Hutchings et al. 1983] Hutchings J.B., Crampton D., Cowley A.P., 1983, ApJ, 275, L43
- [Hutchings et al. 1987] Hutchings J.B., Crampton D., Cowley A.P., et al., 1987, AJ, 94, 340
- [Johnston et al. 1979] Johnston M.D., Bradt H.V., Doxsey R.E., 1979, ApJ, 233, 514
- [Katz 1973] Katz J.I., 1973, Nature, 246, 87
- [Kuiper et al. 1988] Kuiper L., van Paradijs J., van der Klis M., 1988, A&A, 203, 79
- [Kuster et al. 1999] Kuster M., Wilms J., Blum S., et al., 1999, Astrophys. Lett. Commun., 38, 161
- [Larwood 1998] Larwood J., 1998, MNRAS, 299, L32
- [Leahy et al. 1983] Leahy D.A., Darbro W., Elsner R.F., et al., 1983, ApJ, 266, 160
- [Leong et al. 1971] Leong C., Kellogg K., Gursky H., et al., 1971, ApJ, 170, L67
- [Levine et al. 1996] Levine A.M., Bradt H., Cui W., et al., 1996, ApJ, 469, L33
- [Lomb 1976] Lomb N.R., 1976, Ap&SS, 39, 447
- [Long et al. 1981] Long K.S., Helfand D.J., Grabelsky D.A., 1981, ApJ, 248, 925
- [Makishima et al. 1986] Makishima K., Maejima Y., Mitsuda K., et al., 1986, ApJ, 308, 635
- [Maloney & Begelman 1997] Maloney P., Begelman M.C., 1997, ApJ, 491, L43
- [Maloney et al. 1998] Maloney P.R., Begelman M.C., Nowak M.A., 1998, ApJ, 504, 77
- [Maloney et al. 1996] Maloney P.R., Begelman M.C., Pringle J.E., 1996, ApJ, 472, 582
- [Mazeh et al. 1986] Mazeh T., van Paradijs J., van den Heuvel E.P.J., Savonije G.J., 1986, A&A, 157, 113
- [Méndez & van der Klis 1997] Méndez M., van der Klis M., 1997, ApJ, 479, 926
- [Merloni et al. 2000] Merloni A., Fabian A.C., Ross R.R., 2000, MNRAS, 313, 193
- [Mitsuda et al. 1984] Mitsuda K., Inoue H., Koyama K., et al., 1984, PASJ, 36, 741
- [Nowak 1995] Nowak M.A., 1995, PASP, 107, 1207
- [Nowak & Wilms 1999] Nowak M.A., Wilms J., 1999, ApJ, 522, 476
- [Nowak et al. 2000] Nowak M.A., Wilms J., Heindl W.A., et al., 2000, MNRAS submitted (paper I)
- [Paczyński 1983] Paczyński B., 1983, ApJ, 273, L81
- [Pakull & Angebault 1986] Pakull M.W., Angebault L.P., 1986, Nature, 322, 511
- [Parmar et al. 1985] Parmar A.N., Pietsch W., McKechnie S., et al., 1985, Nature, 313, 119
- [Pringle 1996] Pringle J.E., 1996, MNRAS, 281, 357
- [Remillard & Levine 1997] Remillard R.A., Levine A.M., 1997, in Matsuoka N., Kawai N., eds, All-Sky X-Ray Observations in the Next Decade. Riken, Tokyo, p. 29
- [Rothschild et al. 1999] Rothschild R.E., Heindl W.A., Wilms J., Staubert R., 1999, ApJ in preparation
- [Scargle 1982] Scargle J.D., 1982, ApJ, 263, 835
- [Schandl 1996] Schandl S., 1996, A&A, 307, 95
- [Schandl & Meyer 1994] Schandl S., Meyer F., 1994, A&A, 289, 149
- [Schmidtke et al. 1999] Schmidtke P.C., Ponder A.L., Cowley A.P., 1999, AJ, 117, 1292
- [Schwarzenberg-Czerny 1989] Schwarzenberg-Czerny A., 1989, MNRAS, 241, 153
- [Scott & Leahy 1999] Scott D.M., Leahy D.A., 1999, ApJ, 510, 974
- [Shakura & Sunyaev 1973] Shakura N.I., Sunyaev R., 1973, A&A, 24, 337
- [Shields et al. 1986] Shields G.A., McKee C.F., Lin D.N.C., Begelman M.C., 1986, ApJ, 306, 90
- [Shimura & Takahara 1995] Shimura T., Takahara F., 1995, ApJ, 445, 780
- [Stelzer et al. 1999] Stelzer B., Wilms J., Staubert R., et al., 1999, A&A, 342, 736
- [Sunyaev & Trümper 1979] Sunyaev R.A., Trümper J., 1979, Nature, 279, 506
- [Syunyaev et al. 1990] Syunyaev R.A., Gil’fanov M., Churazov E., et al., 1990, Sov. Astron. Lett., 16, 55
- [Tanaka & Lewin 1995] Tanaka Y., Lewin W.H.G., 1995, Black-hole binaries. in Lewin W.H.G., van Paradijs J., van den Heuvel E.P.J., eds, X-Ray Binaries. Cambridge Astrophysics Series 26 Cambridge Univ. Press, Cambridge, Ch. 3, p. 126
- [Treves et al. 1988] Treves A., Belloni T., Chiapetti L., et al., 1988, ApJ, 325, 119
- [van der Klis et al. 1983] van der Klis M., Tjemkes S., van Paradijs J., 1983, A&A, 126, 265
- [van Paradijs et al. 1987] van Paradijs J., van der Klis M., Augusteijn T., et al., 1987, A&A, 184, 201
- [Warren & Penfold 1975] Warren P.R., Penfold J.E., 1975, MNRAS, 172, 41p
- [Weisskopf et al. 1983] Weisskopf M.C., Kahn S.M., Darbro W.A., et al., 1983, ApJ, 274, L65
- [Wen et al. 1999] Wen L., Cui W., Levine A.M., Bradt H.V., 1999, ApJ, 525, 958
- [White & Marshall 1984] White N.E., Marshall F.E., 1984, ApJ, 281, 354
- [Wilms et al. 1999a] Wilms J., Nowak M.A., Dove J.B., et al., 1999a, ApJ, 522, 460
- [Wilms et al. 1999b] Wilms J., Nowak M.A., Dove J.B., et al., 1999b, in Aschenbach B., Freyberg M., eds, Highlights in X-ray Astronomy. MPE Report 272, p. 98
- [Wilms et al. 1999c] Wilms J., Nowak M.A., Dove J.B., et al., 1999c, Astrophys. Lett. Comm., 38, 273
- [Yaqoob et al. 1993] Yaqoob T., Ebisawa K., Mitsuda K., 1993, MNRAS, 264, 411
- [Zhang et al. 1997] Zhang S.N., Mirabel I.F., Harmon B.A., et al., 1997, in Dermer C.D., Strickman M.S., Kurfess J.D., (eds.), Proc. 4th Compton Symposium, AIP Conf. Proc. 410, AIP, Woodbury , p. 141