2 Max-Planck-Institut für extraterrestrische Physik, D–85740 Garching bei München, Germany
Probing the gas content of the dwarf galaxy NGC 3109 with background X-ray sources
Abstract
We established the catalog of X-ray point sources in the field of the Magellanic-type spiral galaxy NGC 3109 (DDO 236) from two ROSAT PSPC observations. Of the 91 X-ray sources 26 are contained within the Hi extent of NGC 3109 as derived by Jobin & Carignan (1990) with the VLA. For 10 of these we can determine accurate hardness ratios 0.2. We find 3 candidate AGN, 2 candidate X-ray binaries and one source which may belong to either class. We also find 2 candidate foreground stars. In a field of 8′ 8′ observed with the NTT in the I-band and centered on the nucleus of NGC 3109 we determine candidates for optical counterparts in the X-ray error circle of 7 ROSAT PSPC sources. We apply a spectral fit to the ROSAT spectrum of the X-ray brightest absorbed candidate AGN behind NGC 3109, RX J1003.2-2607. Assuming a galactic foreground hydrogen column density of we derive from the X-ray spectral fit, assuming reduced metallicities (0.2 solar), a hydrogen column density due to NGC 3109 of . This value is slightly larger than the hydrogen column density derived from the 21-cm observations of . We estimate that the molecular mass fraction of the gas is not larger than %.
Key Words.:
Catalogs – galaxies: individual: NGC 3109 (DDO 236) – galaxies: active – galaxies: ISM – radio continuum: galaxies – X-rays: galaxies1 Introduction
NGC 3109 (DDO 236), a late-type dwarf spiral galaxy, has been classified as Sm IV (Sandage & Tammann 1981) and is seen almost edge-on with an inclination close to 80∘ (Carignan 1985). Since this galaxy has no nucleus it has been assigned the morphological type Ir (van den Bergh 1999). It is a southern Magellanic dwarf galaxy well resolved into stars and is one of the largest Magellanic dwarfs close to the Local Group at a distance of 1.360.10 Mpc (Musella et al. 1997) with an apparent major-axis diameter of 30′ (12 kpc) and minor-axis diameter of 6′ (Demers et al. 1985).
NGC 3109 has a similar dimension as the LMC. With an absolute magnitude comparable to the SMC of mag it is rather underluminous. Estimates of the total mass run from 0.6 to . The galaxy is surrounded by a huge Hi envelope, quite larger than its optical size (Materne 1980; Huchtmeier et al. 1980; Jobin & Carignan 1990). Jobin & Carignan (1990) derive an Hi mass of . The rotation curve requires a large dark matter halo.
On deep exposures NGC 3109 exhibits spiral structure. Associations of knots of stars are visible along spiral arms. A globular cluster search revealed ten candidates. Bright blue stars are found evenly distributed over the face of the galaxy but particularly along the spiral arms, indicating that star formation is taking place on a galaxy-wide scale (Demers et al. 1985). The metallicity of NGC 3109 has been found to be low, similar to the SMC (Richer & McCall 1995). Minniti et al. (1999) establish the existence of an extended halo of old and metal-poor stars.
NGC 3109 belongs as most luminous member to a subgroup of the Local Group dwarfs which is relatively isolated (Mateo 1998). Another member of this group is the dwarf spheroidal galaxy Antila at a distance of only 1.∘2 from NGC 3109. From this apparent separation on the sky the lower limit to the distance between both galaxies is 26 kpc (Whiting et al. 1997).
In this article we derive the X-ray population in the field of NGC 3109 from ROSAT PSPC observations. We classify a few of the X-ray sources which coincide with the Hi extent of NGC 3109 from their X-ray spectral properties. We find two candidate AGN which we use to probe the gas content of NGC 3109.
2 Observations
The observations used were carried out with the PSPC detector of the ROSAT observatory during two pointed observations in May-June and November 1992. The satellite, X-ray telescope (XRT) and the focal plane detector (PSPC) are described in detail in Trümper (1983) and Pfeffermann et al. (1986). We note that no observations have been performed in the direction of NGC 3109 with the HRI detector of ROSAT.
| Sequence | RA | Dec | Time interval | Expos. |
|---|---|---|---|---|
| Number | (J2000.0) | (ksec) | ||
| 600174p | 10h3m7.s2 | -26∘936 | 26-May-92 10:14 – 10-Jun-92 17:27 | 18.5 |
| 600385p | 10h3m7.s2 | -26∘936 | 18-Nov-92 02:07 – 18-Nov-92 21:27 | 13.4 |
The data of the two pointings given in Table 1 have been retrieved from the public ROSAT archive. The data sets from the two observations have been merged to one data set using standard EXSAS procedures (Zimmermann et al. 1994).
3 The catalog of X-ray sources
Three detection procedures (local, map, and maximum likelihood) were applied to the merged pointings using EXSAS commands (Zimmermann et al. 1994). In the local and map detection a square shaped detection cell is slid over the image. Source counts are determined within the cell, background counts either from an area surrounding the cell (local background) or from a (smoothed) background image within the same cell. In the maximum likelihood detection the distribution of the detected photons above the background is compared in a maximum likelihood ratio test with the analytical point-spread function.
The analysis was performed in the five energy channel ranges Soft = (channel 11-41, 0.1-0.4 keV), Hard = (channel 52-201, 0.5-2.1 keV), Hard1 = (channel 52-90, 0.5-0.9 keV) and Hard2 = (channel 91-201, 0.9-2.0 keV) and broad (0.1-2.4 keV). The five source lists were merged to one final source list taking detections at off-axis angles 50′ into account. The maximum likelihood algorithm was used to determine the final source position, the counts in five energy bands and the source extent. A one-dimensional energy and position dependent Gaussian distribution was applied in order to obtain the source extent. The source extent () is given as the Gaussian
| (1) |
Hardness ratios and were calculated from the counts in the bands as and . The existence likelihood ratio and the extent likelihood ratio was calculated according to Cash (1979) and Cruddace et al. (1988). We selected for our final source catalog only detections with an existence likelihood ratio , which is equal to a probability of existence . We give the value for the extent only in case the extent likelihood ratio is . A source error radius was calculated, adding quadratically a systematic error of ″ (cf. Kürster 1993).
| (2) |
The positional error derived for large off-axis angles may be somewhat underestimated due to the asymmetry of the point-spread-function. But the positional error should not be larger than 1′.
We finally screened the catalog of ROSAT sources by displaying the positions of these sources on the hard, soft, and broad band ROSAT PSPC image. We could confirm 91 of the detected sources. This screened catalog of pointlike and moderately extended sources is given in Table 6. 111Table 6 will be made available on-line with the electronically published version. We give in the first column of the catalog for each confirmed source the sequence number and in the second column the source number (from the catalog of unscreened detections). We always refer to the source number in the text.
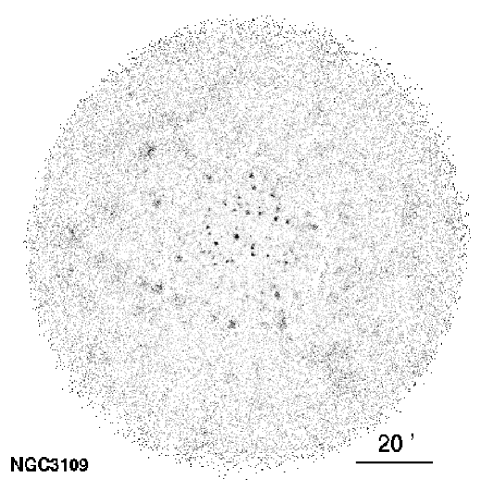
In Fig. 1 we show the ROSAT PSPC image of the NGC 3109 field in the hard band (0.5 – 2.0 keV). We note that the dwarf spheroidal galaxy Antila which is 1.∘2 to the south of NGC 3109 is outside of the observed field of view. In Fig. 2 we mark on the ROSAT PSPC image of the central 20′ of NGC 3109 the sources for with accurate hardness ratios 0.2 have been determined.
4 Classification of the X-ray sources
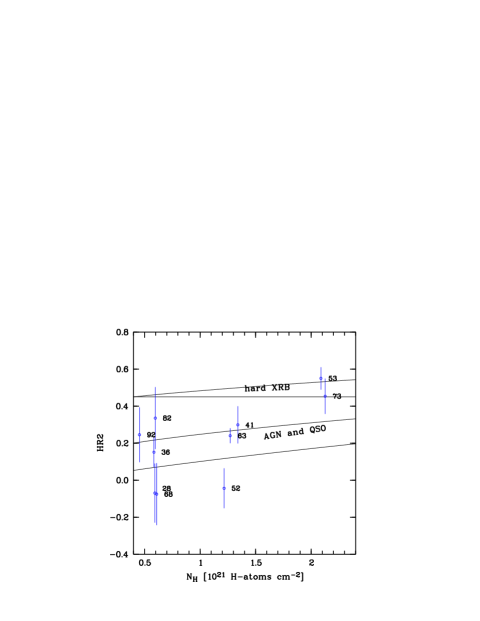
The X-ray colors (hardness ratios and ) as given in Table 6 can be used for a source classification. Kahabka et al. (1999, hereafter KPFH99) have made a classification of the ROSAT PSPC X-ray sources in the field of the Small Magellanic Cloud (SMC). X-ray binaries have on average harder X-ray spectra than supernova remnants and background AGN. The range of hardness ratios and is then different. In addition absorption due to intervening cold gas affects the X-ray colors. KPFH99 have derived the dependence of and on the absorbing column density for a low metallicity galaxy like the SMC. The hydrogen column density in the direction of the X-ray source has been derived from the high-resolution 21-cm map of Stanimirovic et al. (1999). Then from the measured X-ray color a classification could be obtained. The strength of this method is that X-ray binaries and AGN cover different parts of the diagram for intervening hydrogen columns . AGN are located in a band in this diagram with radio loud AGN populating the upper regime of the band while radio quiet AGN occupy the lower part of the band (cf. Laor et al. 1997; Brinkmann et al. 1997).
For radio loud AGN spectra (powerlaw photon index ) the dependence of the X-ray colors and on the hydrogen column density () for abundances 0.2 solar (SMC abundances) has been derived from simulations as
| (3) |
| (4) |
and for radio quiet AGN spectra (powerlaw photon index )
| (5) |
| (6) |
For X-ray binaries with powerlaw photon index spectra the dependence of the X-ray colors and on the hydrogen column density is
| (7) |
| (8) |
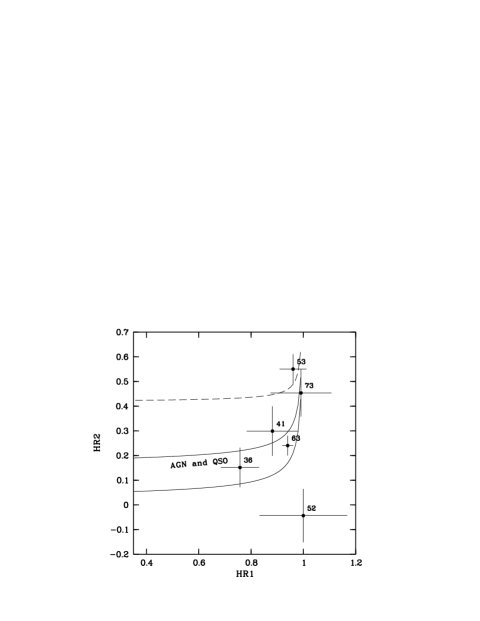
Equations 3 to 8 can be solved for the hydrogen column density . In combining the equations for and one can derive analytical solutions of X-ray binary and AGN tracks in the – plane.
For radio loud AGN (powerlaw photon index ) one derives the track
| (9) |
and for radio quiet AGN (powerlaw photon index ) the track
| (10) |
For X-ray binaries (powerlaw photon index ) we derive the track
| (11) |
These tracks allow a classification of a ROSAT source as an AGN (or an X-ray binary) without the requirement that the intervening hydrogen column density is known. It even is possible to constrain in the – plane the intervening hydrogen column density for the source. We note that X-ray binaries are not necessarily seen through the total gas column of the galaxy disk. With a galactic foreground column of towards NGC 3109 we derive with Equation 11 for X-ray binaries a lower bound on of .
The tracks given above have been derived for a metallicity 0.2 solar which is consistent with the metallicity derived for Hii regions in NGC 3109 (cf. Minniti et al. 1999). Higher metallicity tracks deviate somewhat from these tracks especially if one approaches the high column density regime .
5 The Hi extent of NGC 3109
Huchtmeier et al. (1980, hereafter HSM80) measured the Hi distribution across NGC 3109 with the Effelsberg radio telescope and a beam size of 9′. We apply the procedure used for the X-ray detections in the field of the SMC to the X-ray detections in the field of NGC 3109. First we make use of the Hi map of HSM80 which has an extent of 60′ 30′. We convert the Hi intensity into hydrogen column densities with the equation given in Dickey & Lockman (1990), cf. Kahabka (1999) and we derive a peak of . HSM80 have found that NGC 3109 has a large extent in Hi, with an extension (distortion) of the Hi in the SW. With our X-ray catalog we cover the whole extent of the Hi of NGC 3109. If we restrict the analysis to the inner 20′ of this field and to sources with well constrained hardness ratios 0.2 then we can classify 7 sources as AGN.
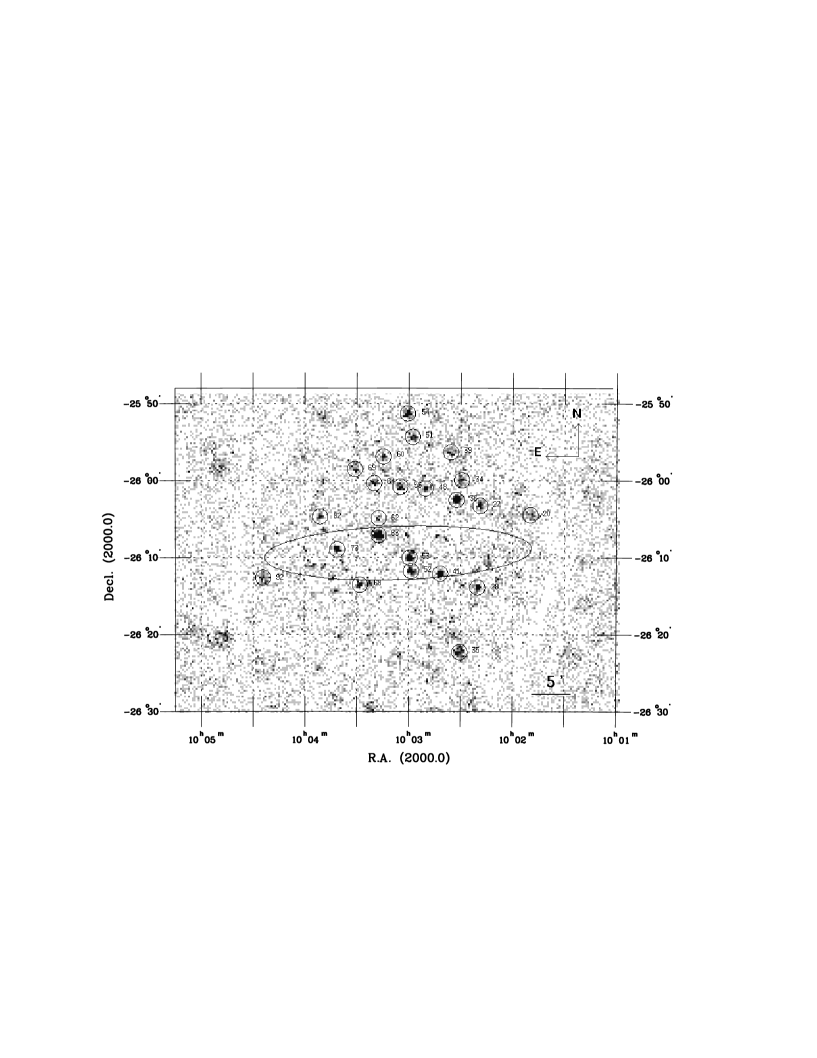
A much higher resolution Hi map of NGC 3109 with a beam size of 40″ has been derived by Jobin & Carignan (1990, hereafter JC90) with the VLA. We now make use of this high-resolution Hi image which we take from plate 67 of JC90. The Hi distribution of NGC 3109 has an extent of 40′ 12′. The peak hydrogen column density is , and the lowest column density is .
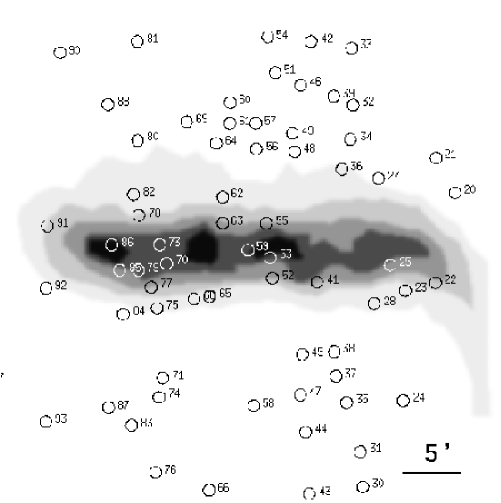
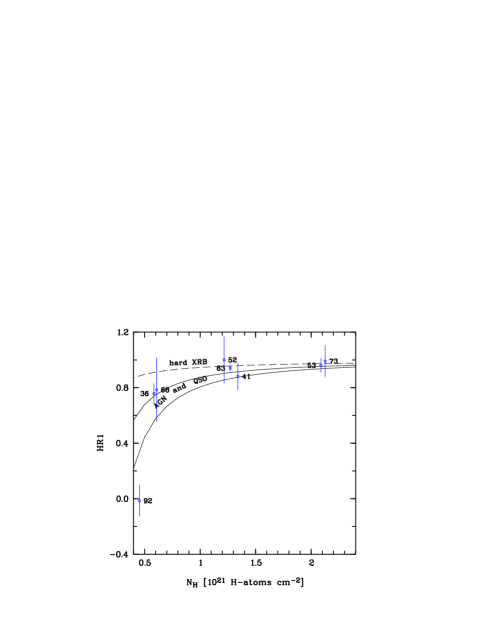
In Fig. 3 we show the positions of the cataloged ROSAT PSPC sources overlaid on the gray scale Hi image of NGC 3109 and taken from JC90. We find 26 ROSAT PSPC sources within the Hi contours of JC90. If we restrict the analysis to the inner 20′ of this field and to sources with well constrained hardness ratios 0.2, then we can classify 3 sources (number 36, 41 and 63) as AGN and 2 sources (number 53 and 73) as X-ray binaries. Source 53 may be seen through higher gas columns while source 73 is seen through lower gas columns (see Fig. 4 and Equation 11). One source (number 82) can be either class. The two sources 52 and 92 cannot be classified as AGN or X-ray binaries. Source 92 may be a foreground object (cf. Fig. 4, Fig. 5 and Table 2). Source 52 has similar hardness ratios as the LMC SNR 0548-70.4 (Haberl & Pietsch 1999). It could be a (young) SNR in NGC 3109.
| Source No. | Class |
|---|---|
| 36, 41, 63 | A |
| 53, 73 | B |
| 82 | AB |
| 28, 68, 92 | F |
NGC 3109 has a mass smaller than, or comparable to, the LMC and 2 X-ray binaries with luminosities above a few times would be in agreement with extrapolations from ROSAT findings for the LMC (cf. Haberl & Pietsch 1999).
There are 14 ROSAT PSPC sources which are projected onto NGC 3109 intrinsic hydrogen columns of (cf. Fig. 3). The largest column is derived for source 86 (). This source could be associated with a spiral arm or an Hii region of NGC 3109. Two further sources, 53 and 59, are close to another region of large column density and source 59 is also close to the optical center of NGC 3109.
We further test the correctness of the classification by constructing the distribution of the number of detected X-ray sources with fluxes in excess of a given flux , the (cf. Hasinger et al. 1993). We restrict the analysis to sources within the central 20′ of NGC 3109 which have been classified as AGN or X-ray binaries. We correct the X-ray fluxes for the intervening hydrogen columns by using for the galactic contribution a value of (Dickey & Lockman 1990) and for the contribution due to NGC 3109 the Hi model of JC90. We find that the observed is in excess of the of the soft extragalactic X-ray background (Hasinger et al. 1993). This can be accounted for if an additional less steep component (e.g. due to X-ray binaries) is added. If we only construct the of the candidate AGN, then the of the soft extragalactic X-ray background is reproduced. This would mean that no significant additional hydrogen is needed to explain the observed sources as background AGN and X-ray binaries although only a few candidate AGN are within the Hi extent of NGC 3109. The two brightest candidate AGN (source 36 and 63) could give an excess in the . We cannot exclude that they are at least in part related to NGC 3109.
6 Optical counterparts of the X-ray sources
We generated finding charts in the B-band COSMOS blue plates and in the I-band (NTT EMMI, cf. Fig. 6) to search for optical counterparts of the ROSAT sources. The B-band plates were used to classify the source using the flux ratio while the I-band image was used to determine the source morphologies from an analysis of their point spread function (see below).
6.1 Matches in the B-band
We produced finding charts of the ROSAT sources given in Table 6 using the COSMOS blue plates. We especially investigated the classified ROSAT sources given in Table 2.
We searched for the optical counterparts in the 90% confidence circle of the ROSAT source. We list the parameters of the matches in Table 3. For the two sources 28 and 92 we find bright (B=11.7 mag and B=12.1 mag) optical counterparts in the 90% confidence circle of these ROSAT sources. This indicates a galactic foreground nature of these sources. For the sources 36, 41, 52, 68 and 73 we find weak (B=20.4 mag to B=22.3 mag) unresolved optical counterparts. For source 73 there is also a galaxy (B=22.7 mag) in the error circle. For source 53 we cannot find an optical counterpart as it is in the crowded field of NGC 3109 and for 63 no optical counterpart exists within the ROSAT 90% confidence circle.
| Source | B-mag | Comment | |
|---|---|---|---|
| No. | |||
| 28 | 11.7 | –3.8 | foreground star |
| 36 | 20.4 | 0.33 | unresolved, AGN |
| 41 | 21.1 | 0.35 | unresolved, AGN |
| 52 | 20.4 | 0.01 | unresolved |
| 63 | no counterpart | ||
| 68 | 22.3 | 0.47 | unresolved |
| 24.4 | 1.3 | faint | |
| 73 | 21.7 | 0.56 | unresolved |
| 22.7 | 0.96 | galaxy | |
| 25.9 | 2.2 | faint | |
| 92 | 21.2 | 0.48 | unresolved |
| 12.1 | –3.2 | foreground star(a) | |
Note (a): 17″ distant from the ROSAT source
In addition we calculated the flux ratio with the equation given in Haberl & Pietsch (1999). We make use of the B-magnitude given in Table 3 and the PSPC countrate given in Table 6. We use the abbreviation and obtain the flux ratio from the equation:
| (12) |
Using the scheme given in Table 3 of Haberl & Pietsch (1999) we classify the sources 28 and 92 as candidate foreground stars and the sources 36 and 41 as candidate AGN (cf. Table 3).
6.2 Matches in the I-band
For the first run of optical matching of X-ray sources in the central part of NGC 3109 we obtained three optical I-band images (60.E-0818) from the ESO archive.222Based on observations made with ESO Telescopes at the La Silla or Paranal Observatories under programme ID 60.E-0818(A). All images were taken on 1998 February 2 with the red arm of the ESO Multi-Mode Instrument (EMMI) at the New Technology Telescope (NTT) with a total exposure time of 2700 s. The images were taken with the Tektronix 20482048 pix2 chip with a scale of 0.268″/pix. The resulting field of view covered by the stacked images is 8.8′ 8.8′ and the final image is centered on the galaxy nucleus. The seeing was measured to be ″ throughout all three exposures.
The data are used to identify optical couterparts within the region of highest Hi column density, which resides at the center of NGC 3109 (Jobin & Carignan 1990) and is best covered by the field of view of this particular dataset, and to support or reject the classification provided by the hardness-ratio estimate (see Sect. 5). Further photometric studies in optical passbands of ROSAT sources for most objects in the catalog in Table 6 with accurate positions will be given in a subsequent paper.
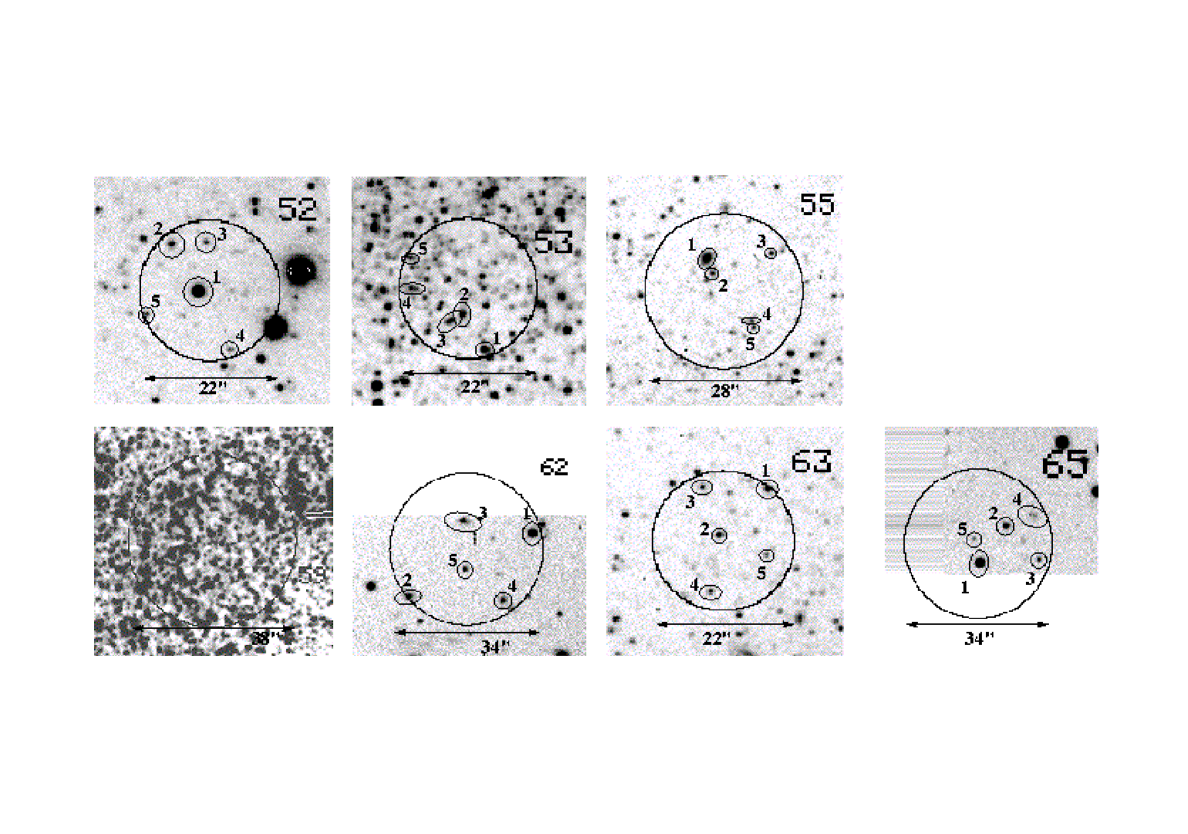
In order to obtain bona-fide optical counterparts we transformed the pixel coordinates of the I-band to new equatorial coordinates. We used positions of 43 stars out of the USNO Astrometric Catalog (Monet et al. 1998) which was obtained from Centre de Données de Astronomiques de Strasbourg (CDS). Using the task ccmap within the IRAF333IRAF is distributed by the National Optical Astronomy Observatories, which are operated by the Association of Universities for Research in Astronomy, Inc., under cooperative agreement with the National Science Foundation. environment (Tody et al. 1993) we find the mean rms uncertainty for all given optical coordinates being RA″ and Dec″. Applying the plate solution to coordinates provided by the ROSAT PSPC catalog (see Table 6) we find 7 optical matches within the field of view. The finding charts for all these regions are given in Fig. 6 with the appropriate scaling of the 90%-confidence circle as given in Table 6. The five brightest objects are encircled and labeled according to their luminosity (label 1 marks the brightest object).
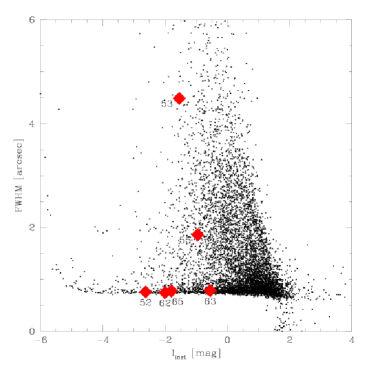
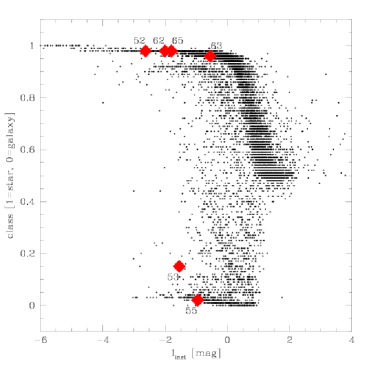
Subsequently, we perform an analysis of the shape parameters of the optical point spread function (PSF) for the 5 brightest objects within each of the 7 object’s finding circles. We used the source-extraction software SExtractor v2.1.4 (Bertin & Arnouts 1996) for determination of ellipticity , full width at half maximum (FWHM), and the star-galaxy-classification parameter CL (using a neural-network algorithm which was extensively trained, see Bertin & Arnouts for details). We compare our findings to all remaining optical objects most of which are assumed to be point-sources. The code yields 7500 detections for which we plot the three PSF-shape parameters (, FWHM, and CL) as a function of instrumental I-band magnitude. Fig. 7 shows the parameters of all detections together with the parameters for the brightest source within the finding circle (see Table 4). Note that the brightest object is not necessarily the optical counterpart of the ROSAT source.
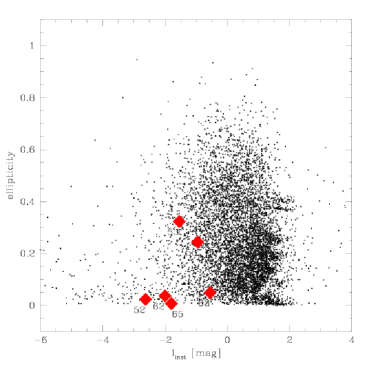
| Labela | I | I | FWHMc | elld | classe |
|---|---|---|---|---|---|
| source 52 | |||||
| 1 | 0.01 | 0.76 | 0.023 | 0.98 | |
| 2 | 0.01 | 0.03 | 0.90 | 0.076 | 0.96 |
| 3 | 0.80 | 0.05 | 0.81 | 0.024 | 0.84 |
| 4 | 0.83 | 0.06 | 0.93 | 0.089 | 0.77 |
| 5 | 0.93 | 0.06 | 0.79 | 0.065 | 0.66 |
| source 53 | |||||
| 1 | 0.01 | 4.52 | 0.323 | 0.15 | |
| 2 | 0.01 | 0.87 | 0.337 | 0.96 | |
| 3 | 0.01 | 1.36 | 0.229 | 0.97 | |
| 4 | 0.02 | 7.17 | 0.373 | 0.02 | |
| 5 | 0.02 | 5.69 | 0.622 | 0.01 | |
| source 55 | |||||
| 1 | 0.01 | 1.87 | 0.244 | 0.02 | |
| 2 | 0.05 | 0.03 | 2.68 | 0.448 | 0.17 |
| 3 | 0.39 | 0.04 | 0.75 | 0.065 | 0.88 |
| 4 | 0.60 | 0.05 | 1.42 | 0.301 | 0.81 |
| 5 | 0.79 | 0.05 | 0.87 | 0.231 | 0.73 |
| source 59 | |||||
| too crowded, no reliable parameters can be given | |||||
| source 62 | |||||
| 1 | 0.01 | 0.75 | 0.037 | 0.98 | |
| 2 | 0.02 | 0.95 | 0.066 | 0.81 | |
| 3 | 0.01 | 0.03 | 1.41 | 0.288 | 0.81 |
| 4 | 0.20 | 0.03 | 1.16 | 0.102 | 0.78 |
| 5 | 0.65 | 0.05 | 1.00 | 0.015 | 0.84 |
| source 63 | |||||
| 1 | 0.02 | 0.79 | 0.049 | 0.96 | |
| 2 | 0.02 | 0.73 | 0.059 | 0.96 | |
| 3 | 0.21 | 0.03 | 0.81 | 0.088 | 0.89 |
| 4 | 0.47 | 0.04 | 0.72 | 0.076 | 0.86 |
| 5 | 0.97 | 0.06 | 0.77 | 0.075 | 0.67 |
| source 65 | |||||
| 1 | 0.01 | 0.78 | 0.007 | 0.98 | |
| 2 | 0.02 | 0.80 | 0.033 | 0.96 | |
| 3 | 0.80 | 0.05 | 0.82 | 0.011 | 0.62 |
| 4 | 1.03 | 0.07 | 1.85 | 0.414 | 0.67 |
| 5 | 1.77 | 0.13 | 0.72 | 0.245 | 0.49 |
(a) Numbering in agreement with labels in Fig. 6 (b) Instrumental I magnitude and the photometric error in mag. (c) Full width at half maximum in arc seconds. (d) Ellipticity, i.e. 1–a/b. (e) star-galaxy-classification parameter of SExtractor; objects with CL are point sources while CL classifies objects as extended.
The brightest sources 52.1, 62.1 and 65.1 (the first number being the source number and the decimal the source label) in Fig. 6 are at least one magnitude brighter than the next fainter object within the finding circle (see Table 4). Object 63.1 has about the same magnitude as object 63.2. Therefore no clear preference can be given just from considering the I-band flux. The PSF-shape parameters of these 4 objects agree with those found for stars (see Fig. 7). The CL classification of SExtractor puts all 4 sources in the point-source regime. Yet, the optical findings are prone to mis-classification since not every brightest object is most central within the finding circle.
Although they are not the brightest, the sources 62.5 and 63.2 are the most likely candidate optical counterparts (infering from their most central position only). These were classified as slightly extended and slightly elliptical, respectively.
As can be seen from Fig. 6 there are 2 finding charts (i.e. charts 62 and 65) from the edge of the CCD image. Thus, we cannot exclude brighter objects within the area not covered by the exposure. Chart 59 is too crowded to give a reliable identification only on the basis of any photometric PSF-shape parameter. However, we note that the center of the ROSAT error circle coincides with the galaxy’s center. Thus, it is very likely that the ROSAT source is connected with a X-ray source which is located near the center of the galaxy.
7 Candidate AGN
In Sect.5 we have used the hardness ratios and to classify 3 ROSAT sources (with numbers 36, 41 and 63) and projected onto the Hi extent of NGC 3109 as candidate AGN.
We have searched in the optical B-band COSMOS finding charts of these sources for optical counterparts. In addition we have generated deep I-band finding charts for source 63 and other ROSAT sources and we have looked for faint unresolved and extended objects within the positional error circles of these ROSAT sources (cf. Fig. 6). We have found several optical candidates in the positional error circle of each ROSAT source. Therefore optical spectroscopy of all candidates is required to firmly identify the optical counterpart of these ROSAT sources.
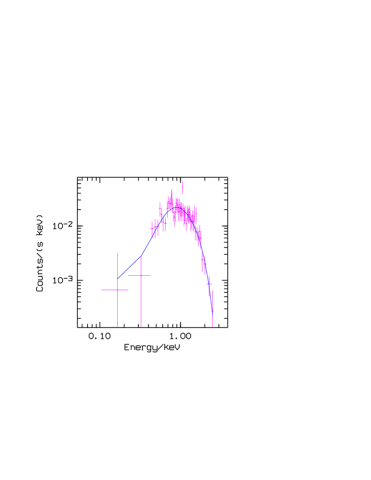
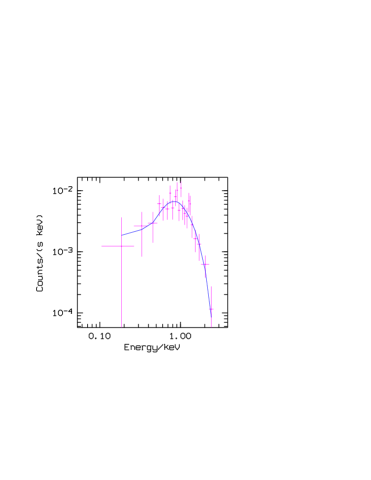
If the background nature of candidate AGN “close to” NGC 3109 is established then these AGN can be used to probe the gas column density of NGC 3109 in the direction of these AGN (taking the additional galactic gas column into account). For two sufficiently X-ray bright candidate AGN RX J1003.2-2607 (source 63) and RX J1002.5-2602 (source 36) we perform X-ray spectral fitting with the EXSAS spectral analysis task (Zimmermann et al. 1994). We assume a galactic foreground column density of and determine the additional hydrogen column density (due to NGC 3109) assuming reduced metallicities (0.2 solar). For both sources we find that the hydrogen column deduced from the X-ray spectral fit is consistent with the hydrogen column deduced from the 21-cm survey of HSM80 and JC90 (cf. Table 5 and Fig. 8).
| flux ( | hydrogen column | ||||
| ) | () | ||||
| X-ray | 21-cm | ||||
| (a) | (b) | (c) | (d) | ||
| RX J1003.2-2607 (source 63) | |||||
| -2.2 | 7.9 | 11 | 11 | 10 | 82 |
| RX J1002.5-2602 (source 36) | |||||
| -2.4 | 3.1 | 4.1 | 4.1 | 4 | 1 |
(a) No constraint on ; (b) constraint on powerlaw photon index: ; (c) Hi model of HSM80; (d) Hi model of JC90.
This result is also consistent with the location of these two sources in the – plane (cf. Fig. 5). We do not include in the spectral analysis source 53 which has been classified as a candidate X-ray binary in Sect.5.
8 Molecular content of NGC 3109
Assuming that both AGN have canonical powerlaw photon indices = (1.75 to 2.25), cf. Laor et al. (1997), we further tighten the constraints on the hydrogen column density. For RX J1003.2-2607 we find from the X-ray spectral fit and from the 21-map of JC90 . For RX J1002.5-2602 we constrain the hydrogen column density from the X-ray spectral fit to and from the 21-map of JC90 to . Both values are in agreement within the uncertainties.
The column densities of absorbing material from the X-ray data are slightly larger than those from the 21-cm line, but the uncertainty of the X-ray spectral fit leaves room for some additional hydrogen (e.g. molecular hydrogen) in the line of sight of the AGN. We assume that the photoionisation cross section is times larger for molecular hydrogen than for atomic hydrogen (cf. Cruddace et al. 1974; Yan et al. 1998). Then we determine the column density due to molecular hydrogen from the total hydrogen column density derived from the X-ray spectral fit and the atomic hydrogen column density derived from the 21-cm observations as
| (13) |
We so constrain the gas column due to molecular hydrogen in NGC 3109 from the X-ray spectral fit of RX J1003.2-2607 to .
Towards RX J1003.2-2607 the amount of is . Along this line of sight the molecular mass fraction, . This means % of the mass of the total gas is in molecular form. This result can be compared with CO observations of NGC 3109, from which the mass of molecular hydrogen has been determined to (Rowan-Robinson, Philips & White 1980). With a Hi mass of a molecular mass fraction of 10% is obtained.
Extraplanar absorbing clouds have been found in a high-resolution survey of a sample of 12 edge-on galaxies by Howk & Savage (1999) at distances of to kpc from the galaxy plane. For an inclination of 80∘ a radius of the galaxy disk of 12 kpc and a distance to the galaxy of 1.4 Mpc similar clouds would be projected in NGC 3109 1′ to 4′ from the galaxy plane. From these clouds dust absorption has been observed but the dust should coexist with gas in the molecular and atomic phase. Similar clouds may exist in NGC 3109 and the candidate AGN RX J1003.2-2607 would be seen through gas which is at a height 1 kpc above the galaxy plane while the candidate AGN RX J1002.5-2602 is seen through gas with 2.4 kpc.
9 Summary and conclusions
From ROSAT PSPC observations of the dwarf galaxy NGC 3109 we derive 10 X-ray sources which are contained within the Hi extent of this galaxy and which have accurate hardness ratios. We classify 2 of these sources as foreground stars, 2 as candidate X-ray binaries and 3 as candidate background AGN. From X-ray spectral fitting we derive for 2 of the AGN total hydrogen column densities which we compare with the Hi column densities inferred from 21-cm line measurements. We estimate that the molecular mass fraction of the gas is not larger than 60%. Upcoming spectroscopy of candidate optical counterparts will help to constrain the nature of these objects and help to understand the hydrogen content of NGC 3109. Furthermore, spectroscopy of globular clusters around NGC 3109 will help to trace the enrichment history (i.e. the major star formation episodes) and the kinematics (i.e. total mass) of NGC 3109.
Acknowledgements.
The ROSAT project is supported by the Max-Planck-Gesellschaft and the Bundesministerium für Forschung und Technologie (BMFT). This research made use of the COSMOS digitized optical survey of the southern sky, operated by the Royal Observatory Edinburgh and the Naval Research Laboratory, with support from NASA. This research has made use of the SIMBAD data base operated at CDS, Strasbourg, France. We thank K.S. de Boer and U. Klein for critically reading the manuscript. We thank an anonymous referee for useful comments.References
- (1) Bertin E, Arnouts, S., 1996, A&AS 117, 393
- (2) Brinkmann W., Yuan W., & Siebert J., 1997, A&A 319, 413
- (3) Carignan C., 1985, ApJ 299, 59
- (4) Cash W., 1979, ApJ 228, 939
- (5) Cruddace R., Paresce F., Bowyer S., & Lampton M., 1974, ApJ 187, 497
- (6) Cruddace R.G., Hasinger G., & Schmitt J.H.M.M., 1988, in: Astronomy from Large Databases, eds. Murtagh F., Heck A., p. 177
- (7) Demers S., Irwin M.J., & Kunkel W.E., 1985, AJ 90, 1967
- (8) Dickey J.M., & Lockman F.J., 1990, ARA&A 28, 215
- (9) Haberl F., & Pietsch W., 1999, A&AS 139, 277
- (10) Hasinger G., Burg R., Giacconi R., et al., 1993, A&A 275, 1
- (11) Howk J.C., & Savage B.D., 1999, AJ 117, 2077
- (12) Huchtmeier W.K., Seiradakis J.H., & Materne J., 1980, A&A 91, 341 [HSM80]
- (13) Jobin M., & Carignan C., 1990, AJ 100, 648 [JC90]
- (14) Kahabka P., 1999, A&A 344, 459
- (15) Kahabka P., Pietsch W., Filipovic M.D., & Haberl F., 1999, A&AS 136, 81 [KPFH99]
- (16) Kürster M., 1993, ROSAT Status Report No. 67
- (17) Laor A., Fiore F., Elvis M., et al., 1997, ApJ 477, 93
- (18) Mateo M., 1998, ARA&A 36, 1998
- (19) Materne J., 1990, ESO/ESA Workshop on Dwarf Galaxies, ed. M. Taringhi & K. Kjar, ESO Garching, p.67
- (20) Minniti D., Zulstra A.A., Alonso M.V., 1999, AJ 117, 881
- (21) Monet D., Bird A., Canzian B., Dahn C., Guetter H., Harris H., Henden A., Levine S., Luginbuhl C., Monet A.K.B., Rhodes A., Riepe B., Sell S., Stone R., Vrba F., Walker R., 1998, U.S. Naval Observatory Flagstaff Station (USNOFS) and Universities Space Research Association (USRA) stationed at USNOFS.
- (22) Musella I., Piotto G., & Capaccioli M., 1997, AJ 114, 976
- (23) Pfeffermann E., Briel U.G., Hippmann H., et al., 1986, Proc. SPIE 733, 519
- (24) Richer M.G., & McCall M.L., 1995, ApJ 445, 642
- (25) Rowan-Robinson M., Philips T.G., & White G., 1980, A&A 82, 381
- (26) Sandage A., & Tammann G.A., 1981, A Revised Shapley-Ames Catalogue of Bright Galaxies, Carnegie Institurion of Washington, Washington D.C.
- (27) Stanimirovic S., Staveley-Smith L., Dickey J.M., et al., 1999 MNRAS 302, 417
- (28) Tody, D. 1993, ”IRAF in the Nineties” in Astronomical Data Analysis Software and Systems II, A.S.P. Conference Ser., Vol 52, eds. R.J. Hanisch, R.J.V. Brissenden, & J. Barnes, 173.
- (29) Trümper J., 1983, Adv. Space Res. 2, No. 4, 241
- (30) van den Bergh S., 1999, ApJ 517, L97
- (31) Vennes S., 1999, ApJ 525, 995
- (32) Voges W., Aschenbach B., Boller T., et al., 1999, A&A 349, 389
- (33) Whiting A.B., Irwin M.J., & Hau G.K.T., 1997, AJ 114, 996
- (34) Yan M., Sadbeghpour H.R., & Dalgarno A., 1998, ApJ 496, 1044
- (35) Zimmermann H.U., Becker W., Belloni T., et al., 1994, MPE report 257