Neutrino, Neutron, and Cosmic Ray Production
in the External Shock Model of Gamma Ray Bursts
Abstract
The hypothesis that ultra-high energy ( eV) cosmic rays (UHECRs) are accelerated by gamma-ray burst (GRB) blast waves is assumed to be correct. Implications of this assumption are then derived for the external shock model of gamma-ray bursts. The evolving synchrotron radiation spectrum in GRB blast waves provides target photons for the photomeson production of neutrinos and neutrons. Decay characteristics and radiative efficiencies of the neutral particles that escape from the blast wave are calculated. The diffuse high-energy GRB neutrino background and the distribution of high-energy GRB neutrino events are calculated for specific parameter sets, and a scaling relation for the photomeson production efficiency in surroundings with different densities is derived.
GRBs provide an intense flux of high-energy neutrons, with neutron-production efficiencies exceeding % of the total energy release. The radiative characteristics of the neutron -decay electrons from the GRB “neutron bomb” are solved in a special case. Galaxies with GRB activity should be surrounded by radiation halos of kpc extent from the outflowing neutrons, consisting of a nonthermal optical/X-ray synchrotron component and a high-energy gamma-ray component from Compton-scattered microwave background radiation. The peak luminosity emitted by the diffuse -electron halo from a single GRB with ergs isotropic energy release is ergs s-1, with a potentially much brighter signal from the neutron-decay protons. The decay halo from a single GRB can persist for -1 Myr. Stronger neutrino fluxes and neutron decay halos can be produced by external shocks in clumpy external media and in scenarios involving internal shock scenarios, so detection of neutrinos associated with smooth-profile GRBs could rule out an implusive GRB central engine and an external shock model for the prompt phase.
The luminosity of sources of GRBs and relativistic outflows in L∗ galaxies such as the Milky Way is at the level of ergs s-1. This is sufficient to account for UHECR generation by GRBs. We briefly speculate on the possibility that hadronic cosmic rays originate from the subset of supernovae that collapse to form relativistic outflows and GRBs.
1 Introduction
The distance scale to the sources of gamma-ray bursts (GRBs) with durations s has been established as a consequence of observations made with the Beppo-SAX satellite (Costa et al., 1997; van Paradijs et al., 1997). The Beppo-SAX discovery of decaying X-ray afterglows permits follow-on optical observations that give redshift determinations from absorption and emission lines in optical transient counterparts or from directionally coincident host galaxies. Nearly 20 GRB sources have measured redshifts (for a recent review, see van Paradijs et al. (2000)), with a mean redshift for the sample. The distribution of redshifts is as yet poorly established, but ranges from for GRB 980425 to for GRB 000131. The redshift of GRB 980425 is based upon its temporal and spatial coincidence with SN 1998bw (Galama et al., 1998; Kulkarni et al., 1998; Pian, 2000), and points to a relationship between GRB sources and supernovae (SNe). A GRB/SN relationship is strengthened by the detection of highly reddened excesses in the optical afterglows of several GRBs, which would arise if supernova ejecta, powered by the decay of radioactive 56Ni (Bloom et al., 1999; Reichart, 1999; Galama et al., 2000), are formed in GRB explosions. Measured apparent isotropic -ray energy releases range from ergs for GRB 980425 to ergs for GRB 990123 at , with ergs in all cases except GRB 980425 (Frail et al., 2001). Achromatic temporal breaks in the optical light curves of GRB 990123 (Kulkarni et al., 1999) and GRB 990510 (Harrison et al., 1999) suggest, however, that the most luminous GRBs might be beamed, so that only directional energy releases are actually measured. In the case of GRB 990123 (Briggs et al., 1999), the directional -ray power and -ray energy release reach peak values ergs s-1 sr-1 and ergs sr-1, respectively.
Considerable evidence linking the sources of GRBs with star-forming regions in galaxies has recently been obtained (e.g., Lamb, 1999; Djorgovski et al., 2001). Optical transients associated with GRBs are superposed on the stellar fields of associated host galaxies in essentially all 14 cases of GRBs with deep follow-up optical observations (van Paradijs et al., 2000; Fruchter et al., 1999; Bloom et al., 1999a; Odewahn et al., 1998), rather than far outside the galaxies’ disks, as might be expected in a scenario of merging neutron stars and black holes (Narayan et al., 1992). Host galaxies that are directionally coincident with optical transients discovered within the field of GRB X-ray afterglows have blue colors, consistent with galaxy types that are undergoing active star formation (Fruchter et al., 1999; Castander and Lamb, 1999a, b). The host galaxy luminosities are consistent with a Schechter luminosity function (Schaefer, 2000), and span a wide range of extinction-corrected magnitudes from for the host galaxy of GRB 980425 associated with SN1998bw to for GRB 980326 (Schaefer, 2000; Hogg and Fruchter, 1999). Lack of optical counterparts in some GRBs such as GRB 970828 and GRB 991226, which have associated radio counterparts (Frail et al., 1999), could be due to extreme reddening from large quantities of gas and dust in the host galaxy (e.g., Owens et al., 1998). X-ray evidence (Piro et al., 2000) for Fe Kα-line signatures in GRB 991216, requiring large masses and column densities of nearby gas (Böttcher, 2000), also indicates that GRBs originate in regions with active star formation.
Knowledge of the distance scale to GRBs makes it possible to determine their effects on the surrounding environment. Some of the claimed effects of GRB explosions are the formation of HI shells and stellar arcs (Efremov et al., 1998; Loeb and Perna, 1998), the melting of dust grains by GRB UV radiation to produce flash-heated chondrules in the early Solar system (McBreen and Hanlon, 1999), and the formation of sites of enhanced annihilation radiation in the interstellar medium (ISM) originating from large numbers of mildly relativistic positrons produced by a GRB (Dermer and Böttcher, 2000; Furlanetto and Loeb, 2002). UV and X-rays from nearby GRBs could also have produced biologically significant dosages on Earth in the past (Scalo and Wheeler, 2002).
Another effect of GRBs, proposed prior to the Beppo-SAX discovery, is that GRB sources accelerate the highest energy cosmic rays. Milgrom and Usov (1995) argued for this connection on the basis of a directional association of two eV air shower events with earlier BATSE GRBs. Waxman and Coppi (1996) pointed out, however, that the intergalactic field must disperse the arrival time of the cosmic rays by yrs to be consistent with the detection rate of GRBs. Vietri (1995) noted that the isotropy of the UHECR arrival direction was consistent with the isotropic distribution of GRB sources, and that the extreme energies of UHECRs could be explained through first-order Fermi acceleration by a relativistic blast wave with Lorentz factor . At each shock crossing, a particle would increase its energy by a factor , so that only a few such cycles would suffice to produce UHECRs starting from low-energy particles. The efficiency to accelerate low-energy particles to ultra-high energies through relativistic shock acceleration has since been shown to be infeasible (Gallant and Achterberg, 1999; Gallant et al., 1999). Following the first shock crossing, the blast wave intercepts the particle before its angular deflection from the shock normal is much larger than ; thus subsequent cycles lead to energy increases by only factors of . Second-order Fermi acceleration, for example, due to magnetohydrodynamic turbulence generated by charged dust or irregularities in the external medium (Waxman, 1995; Schlickeiser and Dermer, 2000; Dermer and Humi, 2001), or by first-order Fermi acceleration involving putative shocks in a relativistic wind (Waxman, 1995) could, however, accelerate UHECRs in GRB blast waves.
Both Vietri (1995) and Waxman (1995) pointed out a remarkable coincidence between the energy density of the highest energy cosmic rays and the power of GRB sources within the Greisen-Zatsepin-Kuzmin (GZK) radius, outside of which UHECRs are degraded by photomeson production on the cosmic microwave background. If GRB sources convert a comparable amount of energy into UHECRs as is detected in the form of rays, then these sources can account for the observed intensity of UHECRs. The comparisons of Vietri (1995) and Waxman (1995) made use of statistical studies where the most distant GRBs detected with BATSE were assumed to be at . Redshift measurements of GRB sources now permit more refined studies of GRB statistics, yielding the comoving space density of GRB sources and the volume-averaged energy injection rate of GRB sources into the ISM. This coincidence can therefore be more carefully tested.
In this paper, it is assumed that the sources of UHECRs are GRBs. We then examine the implications that follow from this assumption. Theoretical problems with accelerating particles to ultra-high energies are not dealt with here (see, e.g., Rachen and Mésázaros (1998); Vietri (1998b); Dermer (2001); Dermer and Humi (2001)). In Section 2, we summarize a recent statistical study employing the external shock model for GRBs (Böttcher and Dermer, 2000) and compare it with other statistical studies of GRBs and the constant-energy-reservoir result of Frail et al. (2001). An external shock model is more energetically efficient than internal shocks to generate rays in the prompt phase of a GRB, so this study yields a lower limit to the energy production rate of GRB sources per comoving volume. We show that an external shock model is consistent with the UHECR/GRB hypothesis, so that the coincidence originally identified by Vietri (1995) and Waxman (1995) holds.
In Section 3, the evolving temporal and spectral behavior of synchrotron radiation in GRB blast waves is characterized. This radiation provides a target photon source for high-energy protons, and we calculate neutron and neutrino production from photopion processes in GRB blast waves. Neutral particle production spectra, integrated over the prompt and afterglow phases of a GRB, are calculated. The diffuse high-energy neutrino background and the distribution of neutrino event rates are calculated in Section 4. The outflowing neutrons decay to form high-energy protons and electrons. In Section 5, the radiation halos formed through synchrotron and Thomson processes of neutron -decay electrons are derived in the special case of a power-law distribution of neutrons that are impulsively released from a GRB source. The hypothesis that hadronic cosmic rays originate from the subset of supernovae that collapse to form relativistic outflows and GRBs is briefly considered in Section 6. Fuller discussions of this hypothesis can be found elsewhere (Dermer, 2000a, b). Summary and conclusions are given in Section 7. Appendix A gives the synchrotron radiation limit used to determine the maximum proton energies, and Appendix B gives a scaling for the photomeson production efficiency in surrounding circumburster media (CBM) with different densities.
2 Statistics and Energetics of UHECRs and GRBs
2.1 GRB Statistics
The BATSE instrument on the Compton Gamma Ray Observatory provides a data base of peak count rates and peak fluxes for several thousand GRBs with unknown redshifts (Paciesas et al., 1999). Many attempts have been made to derive the GRB rate density and mean luminosities by modeling this size distribution. Even constraining the implied redshift distribution to be consistent with the -distribution for the GRBs with measured redshifts, it has not been possible to derive these quantities unambiguously from the size distribution alone. Uncertainties in determining the rate density of GRBs arise from lack of knowledge of the redshift distribution (Totani, 1997), the luminosity function (Mao and Mo, 1998; Krumholz et al., 1998; Hogg and Fruchter, 1999; Schmidt, 1999), and the spectral shape (Mallozzi et al., 1996) of GRBs. A useful simplification (Totani, 1997; Wijers et al., 1998; Totani, 1999) is to assume that the GRB rate density is proportional to the star formation rate (SFR) history of the universe as traced, for example, by faint galaxy data in the Hubble Deep Field (Madau et al., 1998) (which may, however, seriously underestimate the true star formation rate at (Blain et al., 1999)). An important result is that GRBs are unlikely to be standard candles, whether or not their birth rate follows the SFR or a range of reasonable evolutionary models (Schmidt, 1999; Hogg and Fruchter, 1999; Krumholz et al., 1998).
To constrain the models further, Böttcher and Dermer (2000) jointly modeled the distributions of peak flux, duration, and peak photon energies of the spectra of GRBs using an analytic representation (Dermer et al., 1999) of temporally evolving GRB spectra in the external shock model of GRBs. The assumption that the GRB source density followed the star formation history of the universe was maintained, and a flat CDM cosmology with and Hubble constant km s-1 Mpc-1, with , was used. The model flux was folded through the simulated triggering response of a BATSE detector to determine detectability. This approach requires that the total energy and the initial blast wave Lorentz factor of a GRB source be specified. The burst luminosity is then calculated through the standard blast-wave physics that yielded the analytic representation of the GRB spectrum. The analytic model is degenerate in the quantity , where is the density of the surrounding medium, which is assumed to be uniform. The photomeson production efficiency can be scaled from , as shown in Appendix B.
Böttcher and Dermer (2000) showed that fixed values of and could not explain the observed distributions, and that broad ranges of values are required. The comoving differential density distribution of GRB sources was obtained by assuming that the and distributions are separable from the redshift distribution and are adequately described by single power-law distributions. The rate-density distribution of GRB sources that gives a reasonable fit to the size, duration, and peak photon energy distributions, in units of Gpc-3 yr, is
| (1) |
In equation (1), ergs, and the Heaviside function is defined such that for , and otherwise. The range of given here corresponds to a density cm-3 although, again, the model is degenerate in the quantity . The analytic representation of the SFR function, normalized to unity at , is
| (2) |
(Note that the branch of this function was omitted in equation (12) of Böttcher and Dermer (2000).)
The burst rate and energy release rate per unit comoving volume by GRB progenitors can be easily obtained from equation (1). In the local universe, we find that
| (3) |
for the burst rate density, where is the minimum energy of GRB sources in units of ergs, and the expression on the right-hand-side of this equation is valid when . The fit to the BATSE statistics is not sensitive to the value of when . When , Gpc-3 yr-1. If GRB 980425 is assumed to be associated with SN 1998bw, then the statistical model requires that . In this case, Gpc-3 yr-1, and most GRBs have low energy and luminosity and are consequently not observed. The event rate is therefore very sensitive to the number of faint bursts which is not well-constrained by present data (Mao and Mo, 1998). Beaming will increase the rate density of sources by the inverse of the mean beaming fraction compared to the isotropic value given here.
The local energy emissivity of the sources of GRBs, from equation (1), is
| (4) |
The average energy release per burst is just the ratio of equations (4) and (3), and is equal to ergs and ergs when and , respectively. This does not correspond to the average energy release of detected GRBs, because very energetic bursts are much more likely to be detected. One-half of the total energy generated by burst sources comes from events with energies ergs. This is a lower limit to the average energy of an event, because the use of a single power-law function for in equation (1) does not accurately model extremely powerful and very rare events, such as GRB 990123. Consequently, equation (4) is a lower limit to the local emissivity determined by fits to BATSE data. This value is not sensitive to the choice for , which is required to be in the statistical study. Thus the local volume-averaged GRB energy emissivity is better known than the local GRB event rate density.
Possible collimation of GRB sources does not alter the energetics arguments made here as it does for the event rate calculation, because a smaller beaming fraction is offset by a larger number of sources. Neither would beaming affect the efficiency calculations performed below. If GRBs exhibit a constant energy reservoir (Frail et al., 2001; Panaitescu and Kumar, 2001), the implications for GRB source emissivity in the statistical study of Böttcher and Dermer (2000) therefore remains unchanged, and in fact implies a distribution of jet opening angles for the sources of GRBs (, so that when . Because the rate density of GRB sources is inversely proportional to the beaming factor, the radiative signatures from a single GRB would be changed due to beaming. Throughout this paper, we quote energy emissivities and event rates for uncollimated GRB sources, but additionally consider the constant energy reservoir result when calculating the rate of GRBs in the Milky Way.
The statistical study of Böttcher and Dermer (2000) is seen to be consistent with other recent GRB statistical studies once one recognizes that inefficiencies for generating radiation from the GRB event and for detecting emission in the BATSE range have been explicitly taken into account in this approach (this point was not considered by Stecker (2000)). Moreover, most burst events with will not trigger a GRB detector such as BATSE due to the triggering criteria and design of burst detectors that have been flown to date (Dermer et al., 1999). These undetected dirty fireballs may contribute as much as 50-70% of the total emissivity.
For example, Schmidt (1999) derives a local emissivity of GRBs in the 10-1000 keV band of ergs Gpc-3 yr-1, which is a factor 36 smaller than the value obtained here. The efficiency for the external shock model to produce radiation in the 10-1000 keV band is -15%, and % of the total energy is released in the form of dirty fireballs with that would not trigger BATSE. (The clean fireballs with cannot be very numerous.) Insofar as inefficiencies for generating -ray emission in a colliding shell model are typically 1% or less (Kumar, 1999; Panaitescu et al., 1999; however, see Beloborodov, 2000; Fenimore and Ramirez-Ruiz, 1999), and that the collision of a relativistic shell with matter at rest allows the greatest fraction of directed kinetic energy to be dissipated within the blast wave shell (Piran, 1999), we think that equation (4) therefore provides a conservative lower estimate for the emissivity of progenitor sources of GRBs in the local universe.
To obtain the emissivity of GRB sources into the Milky Way galaxy, we proceed in two ways. The first, following Wijers et al. (1998), is to employ the Schechter luminosity function , giving the number density of galaxies with luminosities in the range to . Assuming that the burst emissivity per galaxy is proportional to the luminosity of the galaxy, then , so that , where is the Gamma function. The energy released by GRB progenitors in a galaxy with luminosity is , so that
| (5) |
In the last term of equation (5), we used the results of equation (4) with Mpc-3, , and (Loveday et al., 1992). If the Milky Way is an galaxy, then the power of GRB sources into the Milky Way is therefore ergs s-1.
Scalo and Wheeler (2002) argue that a better approach is to weight the burst emissivity by the ratio of the blue luminosity surface density of the Milky Way to the volume-averaged blue luminosity density of galaxies in the local universe. Using the expressions pc-2 and Mpc-3 quoted by Scalo and Wheeler (2002), we find ergs pc-2 yr-1 for the burst power per unit area in the solar neighborhood. For a 15 kpc radius, we then obtain ergs s-1 for the GRB source power in the Milky Way, which is in good agreement with the value obtained through the first approach. An advantage of this method is to highlight the potentially large variations in the emissivity of GRB sources in different regions of a galaxy.
The power required to supply the galactic cosmic radiation, assuming that cosmic rays are uniformly distributed throughout the disk of the Galaxy, is ergs s-1 (Gaisser, 1990). We therefore see that GRB sources and the dirty and clean fireballs, collectively referred to as fireball transients (FTs), supply a power to the Milky Way that is % of the cosmic ray power, and may therefore make an appreciable contribution to cosmic ray production in the Galaxy. The relative FT/cosmic-ray power could be much larger if the contribution of clean and dirty fireballs that are invisible to GRB detectors (Dermer et al., 1999) is much larger than derived on the basis of the single power-law representation of the - and -distributions. This fraction would also be larger if the efficiency for the sources of GRBs to generate rays is smaller than calculated in the external shock model used by Böttcher and Dermer (2000).
2.2 Ultrahigh Energy Cosmic Rays
The energy density of UHECRs follows from the intensity eV2 m-2 sr-1 s-1 measured with the Akeno Giant Air Shower Array (Takeda et al., 1998). This expression is valid within the experimental error for all cosmic rays with energy (eV) eV, except for being 1.5 away from the eV data point. It is accurate to within 2 of all data points at (eV) . Above eV, small-number statistics dominate. From this expression it follows that the energy density of UHECRs with energy between (eV) and eV is
| (6) |
The evidence for a high energy tail above eV is unclear due to the small-number statistics. Equation (6) should be considered an upper limit to the UHECR energy density, in view of the smaller flux of eV particles measured with the monocular HiRes fluorescence air shower experiment (Sommers, 2002).
Ultra-high energy particles lose energy by adiabatic losses in the expanding universe, and by photo-hadron and photo-pair production on the cosmic microwave background. The mean energy loss length due to these processes has been recently recalculated by Stanev et al. (2000). The loss length for eV protons is about 140 Mpc, and this length is also consistent with their calculations of horizon distance within which 50% of the protons survive. The values of at eV defines the GZK radius insofar as the energy losses are dominated by photo-hadronic processes at these energies. The quantity defines a characteristic survival time for particles with energy . The volume-averaged rate at which astronomical sources produce eV particles in the local universe is therefore ergs cm ergs Gpc-3 yr-1, provided that UHECRs traverse roughly straight-line trajectories through intergalactic space. If UHECRs diffuse in the intergalactic magnetic field, then the source volume contributing to locally observed cosmic rays could be reduced, though with no significant change in the local UHECR intensity due to the better trapping of UHECRs in our vicinity.
This value is times smaller than the emissivity given in equation (4), so that in principle there is a sufficient amount of energy available in the sources of GRBs to power the UHECRs (Vietri, 1995; Waxman, 1995). The conversion of the initial energy of a fireball into UHECRs must, however, be very efficient. If nonthermal power-law distributions of particles are accelerated in the blast wave, as expected in simple treatments of Fermi acceleration, then hard spectra with a nonthermal particle injection index place a large fraction of the nonthermal energy in the form of the highest energy particles. A large fraction of the blast-wave energy can be dissipated as UHECRs even if if particle acceleration is sufficiently rapid that particles reach ultra-high energies and diffusively escape on the deceleration time scale (Dermer and Humi, 2001).
3 Photomeson and Neutral Particle Production in GRB Blast Waves
3.1 Photopion Cross Section and Production Spectra
Only the photomeson process is considered in detail in this paper; photopair and secondary production losses involving nucleon-nucleon collisions can be shown to much less important in comparison to photomeson losses for ultra-high energy particles in the blast-wave environment. The two dominant channels of photomeson production for proton-photon () interactions are and , which occur with roughly equal cross sections. In the latter case, the neutron decays with a lifetime s through the -decay reaction . The decay of the charged pion produces three neutrinos and a positron through the chain , followed by the decay . Neutrino production from photomeson interactions in GRB blast waves has been considered earlier (Waxman and Bahcall, 1997; Vietri, 1998a, b; Rachen and Mésázaros, 1998; Halzen and Hooper, 1999; Waxman and Bahcall, 2000; Dai and Lu, 2001), but usually in the context of an internal shock model. Rachen and Mésázaros (1998a) also consider neutron production in the internal shock model.
To treat neutral particle production, we follow the approach of Stecker (1979) (see also Böttcher and Dermer (1998)). The cross section is treated in the -function approximation. Thus an interaction takes place if the photon energy in the proton’s rest frame equals , where primes denote quantities in the comoving frame, is the proton Lorentz factor, represents photon energies in units of the electron rest mass energy, is the energy of the resonance, and is the cosine of the angle between the photon and proton directions. The differential cross section for the photomeson production of neutrons and neutrinos produced with energy is approximated as
| (7) |
The multiplicity for neutrons and for neutrinos, noting that we are only considering the neutrinos formed from decay (and not from the neutron). The photomeson cross section cm2. Each neutrino carries away about 5% of the proton’s initial energy, with the -decay positron receiving another 5%. Thus we let for neutrons and for neutrinos, with the units of the proton rest mass defining the units of .
The neutral particle production spectrum in the comoving frame is therefore
| (8) |
where gives the nonthermal proton spectrum in the comoving frame, and is the differential number density of soft photons, assumed to be isotropically distributed in the blast-wave fluid frame, with photon energies between and . Substituting equation (7) into equation (8) gives
| (9) |
The production spectrum of neutral particles as measured by an observer can be approximately obtained by noting that the differential time element , and particle energy , where unprimed quantities refer to observed quantities. Redshift effects are not considered in this section. In more accurate treatments, a full angular integration over the production spectrum should be performed, which is especially important if the outflow is collimated. In the present treatment, it is adequate to use the simpler relations for and . Thus , and we have
| (10) |
where
| (11) |
3.2 Blast Wave Dynamics
We consider the case of an adiabatic blast wave decelerating in a uniform surrounding medium with density .111This treatment is reasonably consistent with the statistical treatment of GRBs by Böttcher and Dermer (2000) There the radiative regime that provided the best fit to the GRB statistics is nearly adiabatic, with the blast wave decelerating as , compared to in the fully adiabatic limit. When , the blast wave evolves according to the relation
| (12) |
(Chiang and Dermer, 1999), where is the distance of the blast wave from the explosion center, and the deceleration radius
| (13) |
(Mészáros and Rees, 1993), where . The rate at which nonthermal proton kinetic energy is swept-up in the comoving frame of an uncollimated blast wave is
| (14) |
(Blandford and McKee, 1976), where . Thus the accumulated nonthermal kinetic energy at radius is
| (15) |
where the largest value of in the second asymptote stems from the restriction, and .
It is convenient to relate the observer’s time to , and describe blast-wave evolution in terms of the dimensionless time , where the deceleration timescale (for the observer) is
| (16) |
(Rees and Mészáros, 1992; Mészáros and Rees, 1993). Because ,
| (17) |
Likewise,
| (18) |
and
| (19) |
The expressions on the right-hand-sides of equations (17)-(19) accurately bridge the early and late time behaviors of the asymptotes.
3.3 Comoving Proton, Electron, and Photon Spectra
A power-law distribution of nonthermal protons with number index is assumed to be accelerated in the blast-wave. Because protons and ions are swept up with Lorentz factor and are then subsequently accelerated, we represent the nonthermal proton distribution by the expression
| (20) |
(Böttcher and Dermer, 1998). The term represents the fraction of swept-up particle kinetic energy that is transformed into the energy in the nonthermal proton distribution and could, in principle, be as large as . Not more than -20% of the total nonthermal proton energy could, however, be radiated if the treatment is to remain consistent with the assumption of an adiabatic blast wave. The term , giving the maximum proton Lorentz factor in the blast wave frame, must be for GRBs to account for UHECRs. Rachen and Mésázaros (1998) define limits on various acceleration scenarios that give large values of . Particle spectra from gyroresonant acceleration due to pitch-angle scatterings and stochastic energy diffusion in particle interactions with plasma waves can give and can produce nonthermal spectra with , though the exact value depends on the spectrum of the turbulence (Schlickeiser and Dermer, 2000; Dermer and Humi, 2001).
A nonthermal electron spectrum is also assumed to be accelerated in the blast wave with the same index as the nonthermal protons. Following Sari et al. (1998) (see also Dermer et al. (2000a)), we represent the nonthermal electron spectrum by the expression
| (21) |
where is the total number of swept-up nonthermal electrons and is the electron Lorentz factor. In the slow cooling limit, , , and the steady-state electron spectral index , whereas in the fast cooling limit , , and . Here the minimum electron Lorentz factor and the cooling electron Lorentz factor , where and are parameters describing the swept-up kinetic energy transferred to the electrons and the magnetic field, respectively (Sari et al., 1998). The magnetic field is defined through the expression
| (22) |
We let (Chiang and Dermer, 1999) and take in this paper.
We consider only nonthermal synchrotron emission here. Synchrotron self-absorption and synchrotron self-Compton (SSC) processes are treated by Dermer et al. (2000a), including a comparison of the analytic results to detailed numerical simulations. Given the parameters used here, the neglect of synchrotron self-absorption is not important for photomeson production, but the inclusion of Compton processes could, however, depress the intensity of the low-energy photon spectrum when .
In the -function approximation for the synchrotron emissivity, the photon production spectrum
| (23) |
where , is the magnetic-field energy density in units of cm-3, and G. The magnetic field is assumed to be randomly oriented. This formula is accurate to better than a factor-of-2 except near the endpoints of the distribution (see Fig. 2 in Dermer et al. (2000a)). By substituting equation (21) into equation (23), we obtain the comoving photon density
| (24) |
where
| (25) |
Substituting equation (24) into equation (11), performing the integrals, and defining ) for and 2, we obtain
| (26) |
where . The term dominates each of the branches of equation (26). A good approximation to is therefore
| (27) |
The production spectrum of neutral particles formed through photomeson production is therefore given by equation (10), but with replaced by either or given by equations (26) or (27), respectively.
3.4 Energy-Loss Timescales for High Energy Protons
Energy-loss timescales are derived in the comoving frame for protons that would have energies as measured in the observer frame. These timescales are compared with the comoving time passing since the initial explosion event; clearly if the energy-loss timescale is long compared with the available comoving time, then only a small fraction of the particle energy can be extracted through that process. From the relation , we obtain the comoving time
| (28) |
The photopion energy-loss rate is
| (29) |
(compare eq. [8]), where the factor takes into account that interactions are required for a high-energy proton to lose a significant amount of its energy. Here we consider both the and chains, because both will compete against other energy-loss processes. Thus , giving
| (30) |
where . Hence
| (31) |
The energy-loss rate through photopair () production is small compared to the photomeson energy-loss rate at very high energies because of the greater energy loss per scattering event in photomeson production. Although photopair production could dominate the energy-loss rate for protons with , it is not important for the highest energy protons and is not treated here.
The proton synchrotron loss rate is given by
| (32) |
The importance of this process for producing high-energy rays from GRB blast waves has been considered by Vietri (1997) and Böttcher and Dermer (1998).
The secondary production rate is , where from the shock jump conditions, and mb. The secondary production efficiency , where . The secondary production efficiency increases through the afterglow phase, and reaches a value of at . Unless cm-3, the efficiency for this process will be low (see Pohl and Schlickeiser (2000) and Schuster, Pohl, & Schlickeiser (2002) for treatments of this process in GRBs and blazars, respectively).
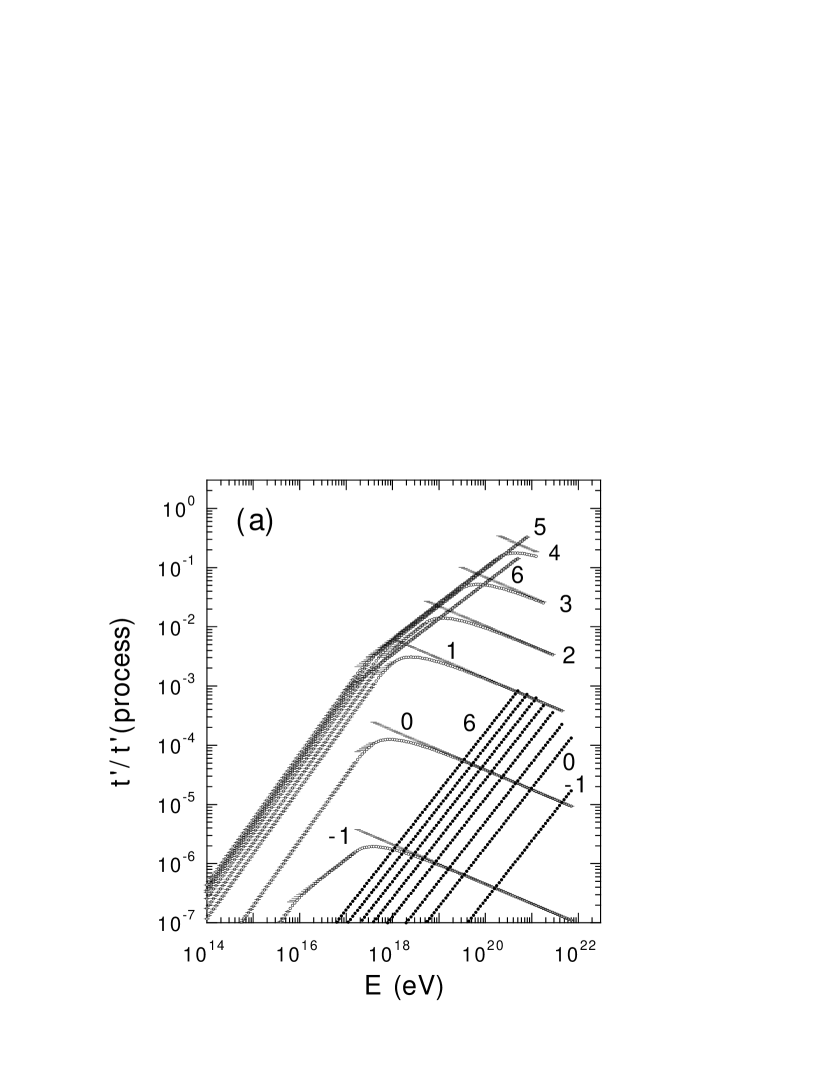
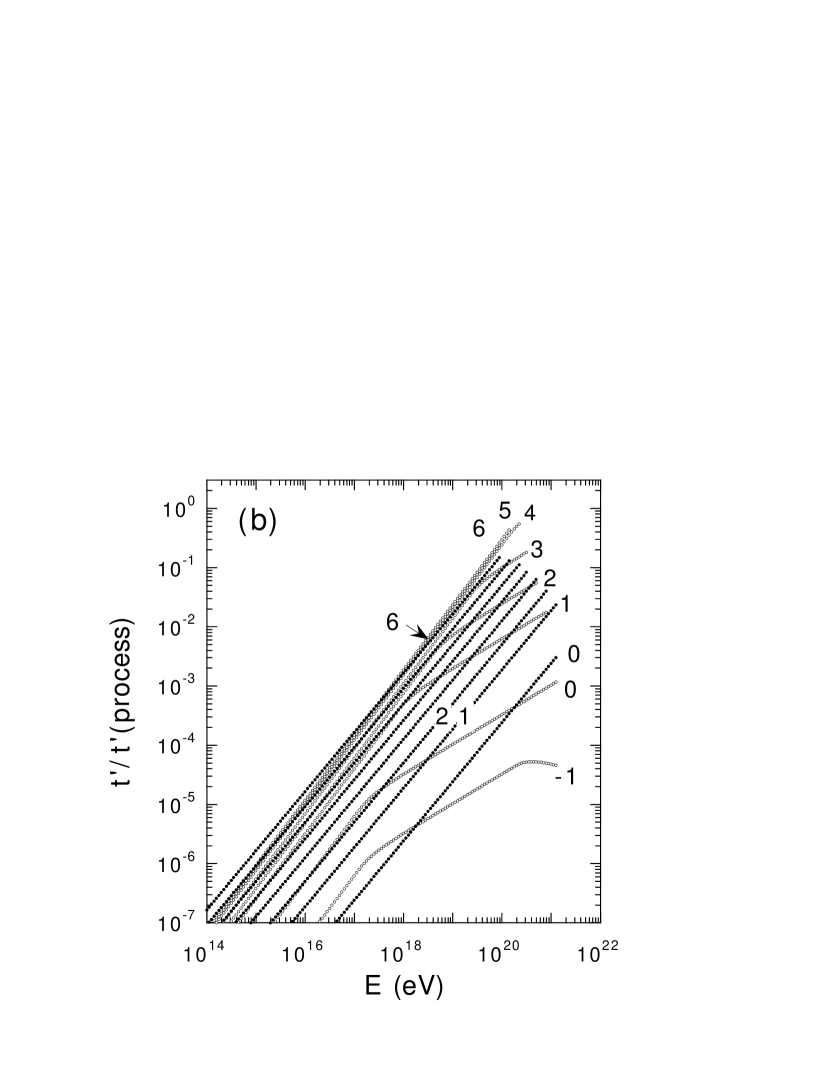
Fig. 1 shows results of calculations of the ratio of the comoving time to timescales for photomeson production (open circles) and proton synchrotron radiation (filled circles). The timescales are calculated at different observer times as a function of observed proton energy , up to the maximum proton energy defined by the synchrotron radiation limit given in Appendix A. The chosen parameters in Figs. 1a and 1b are typical of those used to fit GRBs in the prompt and afterglow phase, respectively, and are listed in Table 1. In both cases, we use a total energy release ergs, which is near the mean value of the energy release distribution (see Section 2.1). The value is similar to that deduced in fits to afterglow GRB spectra of GRB 990510 (Harrison et al., 1999) and GRB 970508 (Wijers and Galama, 1999); a value of much steeper than will make the energetics of UHECR production problematic.
Other than and , Fig. 1a employs the parameter set in Fig. 1 of Dermer et al. (2000b) which was shown to give good fits to burst spectra during the -ray luminous phase of GRBs (Chiang and Dermer (1999); there we used ergs and ). The remaining parameters used in Fig. 1a are , cm-3, , and . Even with such a large value of , the blast wave evolves in the adiabatic limit because the electrons are in the weakly cooling regime. We also take . The dotted lines show the photopion timescales obtained using the approximate expression for in equation (27). Fig. 1b uses parameters that are typical of those used to model the afterglow spectra of GRBs (Harrison et al., 1999; Wijers and Galama, 1999), and are the same as Fig. 1a except that and . The latter choice ensures that the GRB blast-wave evolution is nearly (though not quite; see Böttcher and Dermer (2000a)) adiabatic, given that the electrons are strongly cooled during the prompt phase and much of the afterglow phase for this larger value of . The major difference between the fits derived to GRB spectra during the prompt and afterglow phases is thus the stronger value of field at later times. Other arguments that the magnetic field evolves to its equipartition value following the prompt phase are given by Dermer et al. (2000b).
As can be seen from Fig. 1, the relative timescales for photomeson production in the external shock model usually dominates the other processes, and approaches or exceeds unity for the highest energy protons during the afterglow phase. Thus a large fraction of the energy contained in the highest energy protons is converted into an internal electromagnetic cascade and lost as photomeson neutral secondaries. The largest proton energies are constrained by the synchrotron limit given in Appendix A, but still exceeds eV, in accord with the hypothesis that UHECRs are accelerated by GRBs. Protons with observed energies eV therefore lose a significant fraction of their kinetic energy through photomeson production which is transformed into neutrons, neutrinos, and high energy leptons. The leptons generate high energy gamma rays during an electromagnetic cascade in the blast wave (Böttcher and Dermer, 1998). When , proton synchrotron losses can dominate photomeson losses during certain phases of the evolution. Although secondary production can be the dominant proton energy loss process at eV, its importance is negligible unless the CBM density is very high.
When the relative timescales exceed unity, a large fraction of the proton energy is radiated away during the comoving time , and the proton distribution will strongly evolve through radiative cooling. When this occurs, a thick-target calculation is required to calculate total neutrino and neutron emissivity. This regime begins to be encountered here, but a complete treatment of photopion production will require solving a transport equation that is beyond the scope of this paper. We also note that the efficiency ratio is actually shorter when the injection index becomes larger, because the energy density of the soft photons is then concentrated into a narrower bandwidth and is therefore more intense. Nevertheless, much less energy of the total GRB energy is radiated through photomeson production when , because the total GRB energy carried by the highest energy protons is much smaller.
3.5 Instantaneous and Time-Integrated Production Spectra
It is simple to derive the characteristic spectral behavior of neutrons or neutrinos produced in the external shock model. Using equations (27) and (20) in equation (10), we find that the instantaneous production spectra, multiplied by , follow the behavior
| (33) |
where is given by the synchrotron radiation limit, equation (A1). These spectral indices are two units larger than particle injection number indices. It is also assumed in these expressions that and , but it is simple to generalize the results when this is not the case. The instantaneous production spectra are very hard at low energies, with when . Irrespective of whether we are in the fast cooling () or slow cooling () regime, the spectra soften to for , although the spectra still rise in an representation. At energies , , where the behavior holds when . The peak energy is carried primarily by particles with energy
| (34) |
In this expression, the break energy is the photon energy separating the portion of the synchrotron emissivity spectrum produced by an electron distribution with a low-energy cutoff from the higher-energy portion of the synchrotron spectrum. As is well known, this often occurs at energies keV - several MeV during the prompt phase of GRBs (Cohen et al., 1997). Equation (34) also follows from elementary considerations.
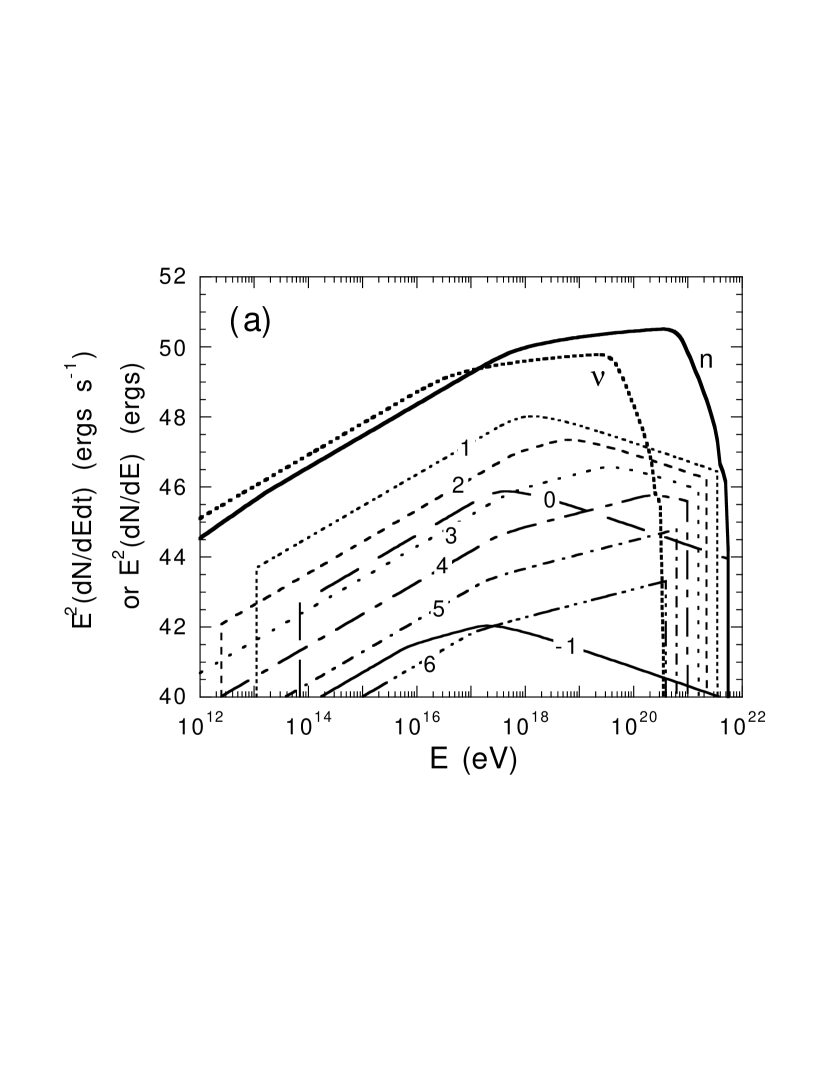
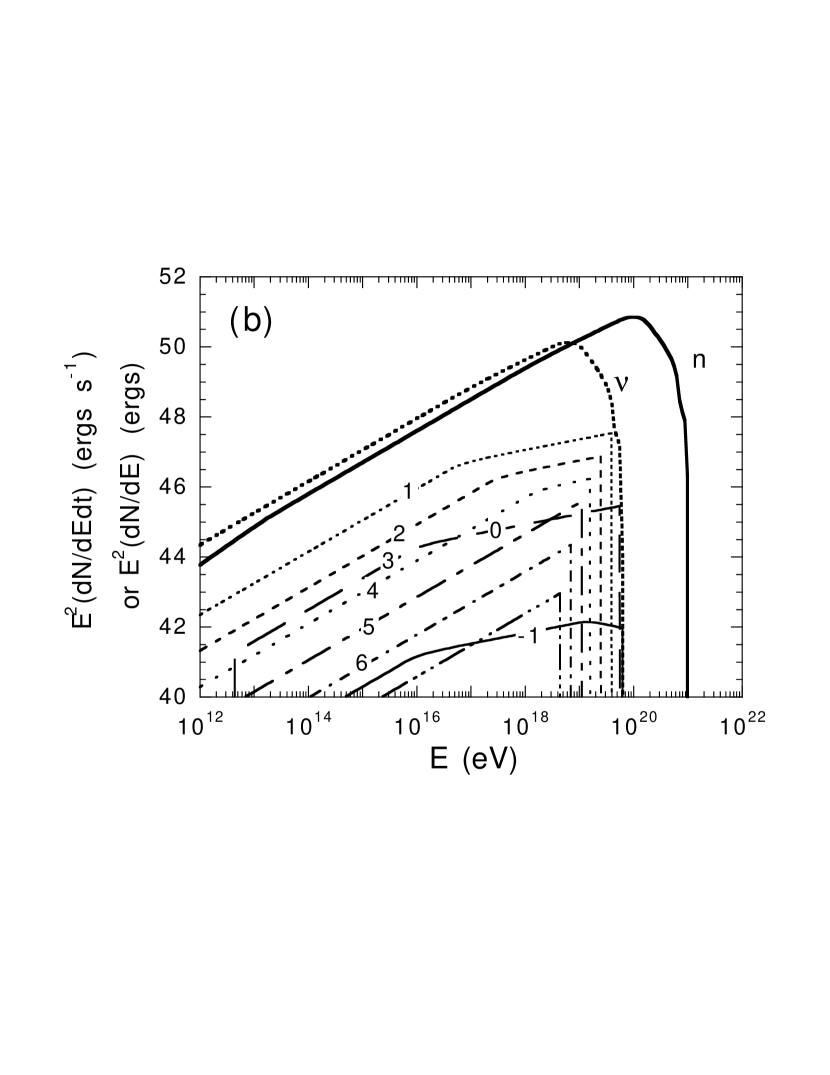
Figs. 2a and 2b show instantaneous production spectra at different observing times for neutrons and neutrinos, respectively. Fig. 2a employs the parameter set (A) for the prompt phase of GRBs and Fig. 2b uses the parameter set (B) that better represents afterglow data (see Table 1). The peak of the spectrum at , above which , occurs at early times in the instantaneous spectra of Fig. 2a. The transition to the portion of the spectrum is not seen after s is Fig. 2a nor in the Fig. 2b spectra. This is because reaches such low energies that would occur above the maximum energy defined by equation (A1). The maximum energies of the neutrons reach or exceed eV, but the maximum neutrino energies only reach eV due to the smaller amount of energy transferred to each neutrino in the photomeson production process (compare cross section (7)). The production spectrum breaks from at low energies to at intermediate energies in Fig. 2a, because the electrons distribution starts to evolve in the uncooled regime. In contrast, the spectrum above the break in Fig. 2b is slightly softer with , because the electron distribution evolves in the strongly cooled regime.
We also show the time-integrated production spectra of both the neutrons and neutrinos for parameter sets (A) and (B) in Figs. 2a and 2b, respectively. Here we integrate the instantaneous production spectra over all times until the blast wave reaches , where it has decelerated to mildly relativistic speeds. The time-integrated spectra retains its behavior at (eV) eV. For the prompt-phase parameter set (A), the time-integrated spectra steepens to a behavior above the value of evaluated at , and then cuts off at a maximum energy determined by equation (A1) at . For parameter set (B), the time-integrated spectrum remains very hard, with , up to nearly the maximum energy defined by .
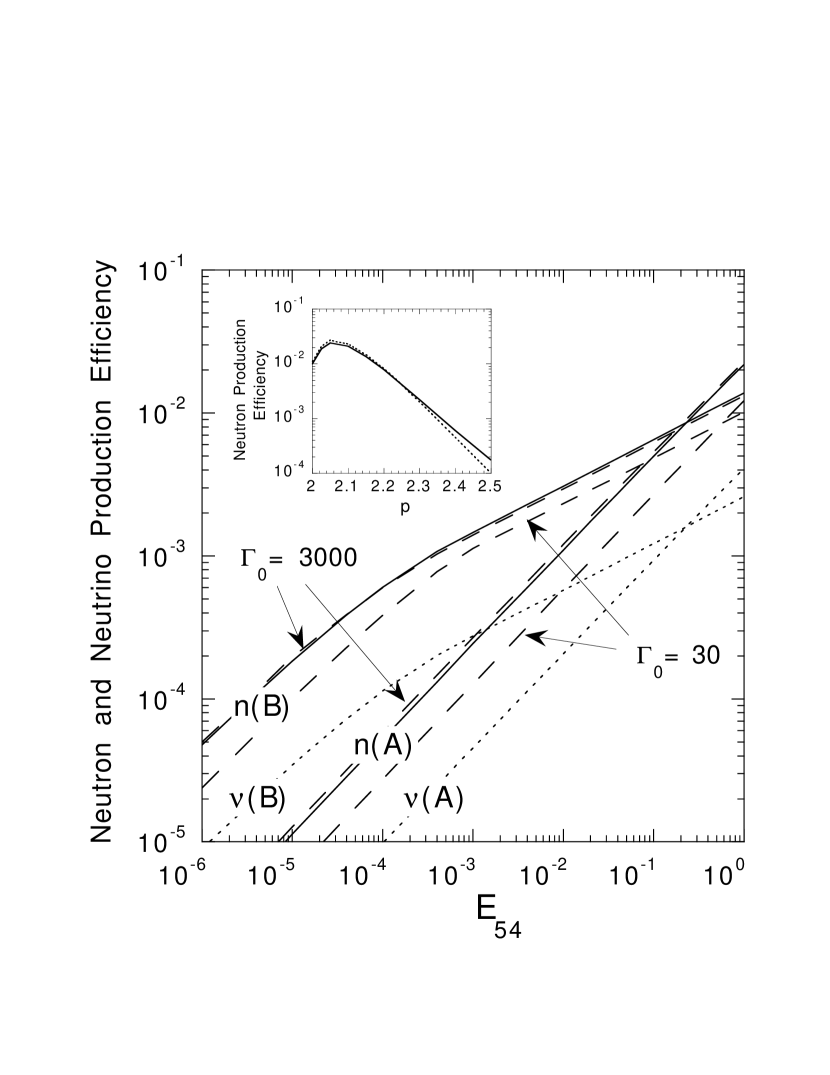
The time-integrated spectra in Fig. 2 imply both the total energy release and the energies of the produced neutrons and neutrinos that carry the bulk of this energy. Neutrons with energies between and eV carry ergs of energy for the chosen parameters. Neutrinos carry as much total energy as the neutrons in an energy range that is times smaller than that of the neutrons. The ratio of the energy carried by either neutrons or neutrinos to the total explosion energy , here called the production efficiency, is therefore % for neutrons and % for neutrinos. Fig. 3 shows calculations for the neutron and neutrino production efficiencies as a function of . The neutron production efficiency increases with increasing and reaches a few per cent when . Parameter set (A) gives better efficiency at large values of than set (B), but poorer efficiencies when . The production efficiency is only weakly dependent upon , but depends strongly upon , as outlined earlier and shown in the inset. The maximum efficiency occurs when . According to the statistical treatment of the external shock model described in Section 2.1, % of the total GRB energy is radiated by explosions with ergs. Thus we find that % and 0.2% of this energy is converted into high-energy neutrons and neutrinos, respectively, if the UHECR/GRB hypothesis is correct. This will have the observable consequences described in Sections 4 and 5.
The efficiencies for neutral particle production correspond to GRBs with smooth profiles. In the external shock model result, smooth-profile GRBs result from blast wave deceleration in a uniform surrounding medium. We have chosen cm-3. Because (Appendix B), smooth profile GRBs could produce neutrinos and neutrons with even smaller efficiencies if cm-3. Interactions with an inhomogeneous and clumpy CBM are thought to produce the short timescale variability observed in rapidly variable GRBs in the external shock model (Dermer and Mitman, 1999; Dermer and Böttcher, 2002). Under these circumstances, neutrino production could be considerably enhanced. Thus the production calculations only apply to GRBs which display smooth profiles.
3.6 Temporal Behavior of Production Spectra
The temporal indices of the particles formed through photomeson production can be obtained by examining equations (10), (20) and (27), noting the temporal dependences of the various terms. Writing equation (10) in more detail, we have
| (35) |
provided . The coefficient has been extracted from the term, and varies according to (equation (25)), so that it has the time dependence given by equation (17). The time dependences of and are given by equations (18) and (19), respectively. It then becomes necessary to determine the time dependences of and therefore of the that enter into equation (27), noting that .
The temporal behavior of the neutron and neutrino production time profiles, or “light curves,” depends on whether the electrons are in the slow or fast cooling regimes (Sari et al., 1998). Because of the progressive weakening of the magnetic field in the standard blast-wave model, the fast cooling regime will exist only if the cooling electron Lorentz factor is less than the minimum electron injection Lorentz factor at . Using the expressions for and following equation (21), we therefore find that the nonthermal electrons will evolve in the fast cooling regime at least during some stage of the blast-wave evolution if
| (36) |
using equation (16) for . When equation (36) does not hold, the system is always in the slow cooling regime. For example, if we vary only in parameter set (A), there will be some evolution in the fast cooling regime when . There will be evolution in the fast cooling regime for essentially all values of with parameter set (B). Note that the baryon-loading factor separating the different cooling regimes is quite sensitive to , with .
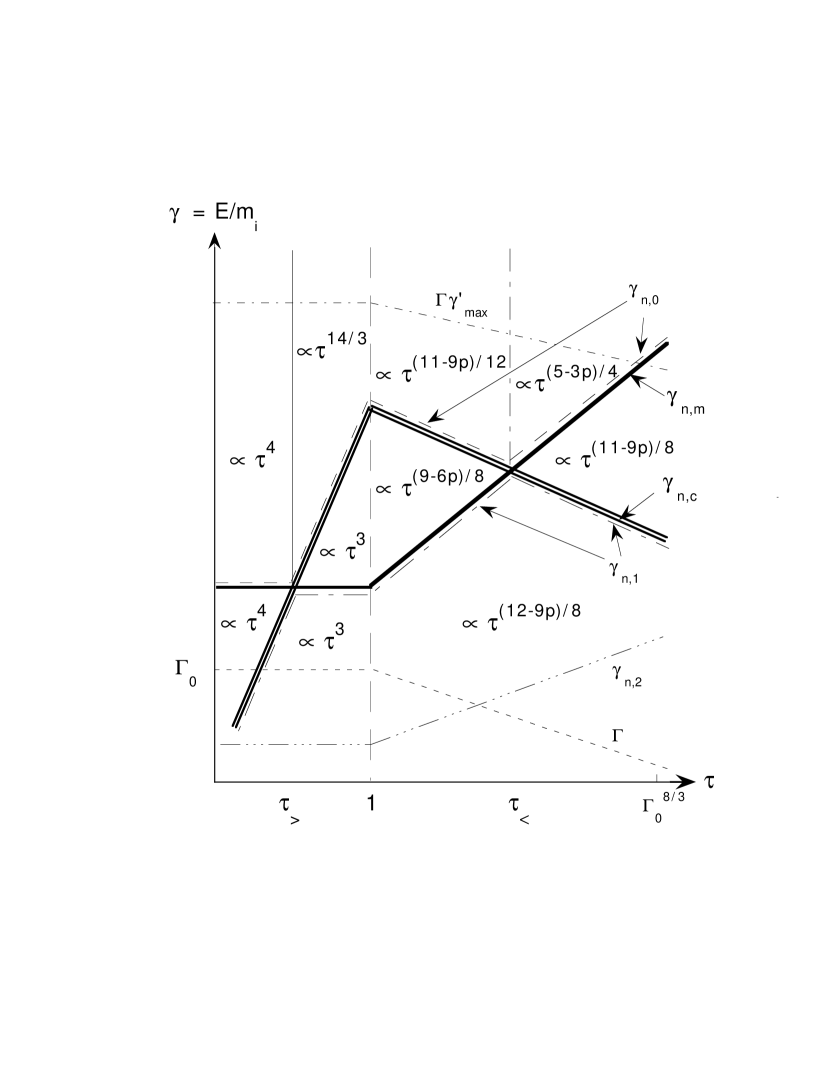
Fig. 4 is a sketch of the temporal indices of particles produced with different energies as a function of dimensionless time . First consider the outside boundaries of the temporal-index plane. Particles will only be produced if . This defines the lower region bordered by the short dashed lines. Due to threshold effects, another limit to low-energy particle production arises from photomeson threshold effects due to the upper cutoff of the highest energy photons at . Neutrons and neutrinos will not be produced with energies ) because of this cutoff. For the synchrotron radiation limit given by equation (A1) — but now for electrons — , so as sketched by the dashed-triple-dotted lines. The synchrotron radiation limit for protons defines the upper boundary for the highest energy particles that are produced. It is , and is shown by the dot-dashed lines. Different Fermi acceleration models could give different maximum particle energies, but all would likely be bounded from above by this limit due to the competition between the synchrotron loss and acceleration rates.
The blast-wave system, as illustrated in Fig. 4, passes through a fast cooling regime. Thus there are two dimensionless times and defined by the relation that bound the period when the blast wave is in this regime. The blast wave is in the slow cooling regime when either equation (36) fails to hold or, if not, when and . We define and . Hence and for , and and when . The behaviors of and are indicated by the thick lines and the double lines, respectively, in Fig. 4.
In the slow-cooling regime, and . In the fast-cooling regime, and . It is straightforward though tedious to derive the temporal indices displayed in Fig. 4 using the above relations and equation (27) in equation (35). The important point to notice is how hard the values of are in the afterglow phase. The highest energy particles with are due to interactions with the part of the soft photon spectrum. In the uncooled regime, when , so that the bulk of the energy is radiated at late times. Because of the rapid decay of with time, however, this phase does not persist very long. Nevertheless, the temporal indices in the lower and intermediate energy regimes are and , respectively, in the afterglow phase when . Thus the bulk of the energy is still radiated at late times. Although this temporal behavior will be difficult to detect from neutrinos and neutrons from GRBs, they are relevant to the high-energy gamma-ray spectrum observed from GRBs. Charged pions will decay into leptons, which will scatter soft photons to high energies to generate a cascade, and neutral pions from will decay to form rays that can pair produce until the photons are at sufficiently low energies to escape. As noted by Böttcher and Dermer (1998), the temporal decay of the high-energy emission from hadrons is much slower than the synchrotron decay. Thus high-quality GeV observations of GRBs could reveal the presence of a high-energy hadronic component, though it must be carefully distinguished from the SSC component, for example, by its spectral characteristics. The Gamma ray Large Area Space Telescope (GLAST) mission222http://glast.gsfc.nasa.gov will be well-suited to measure the -ray afterglow of GRBs and thus test for an energetic hadronic component in GRB blast waves.
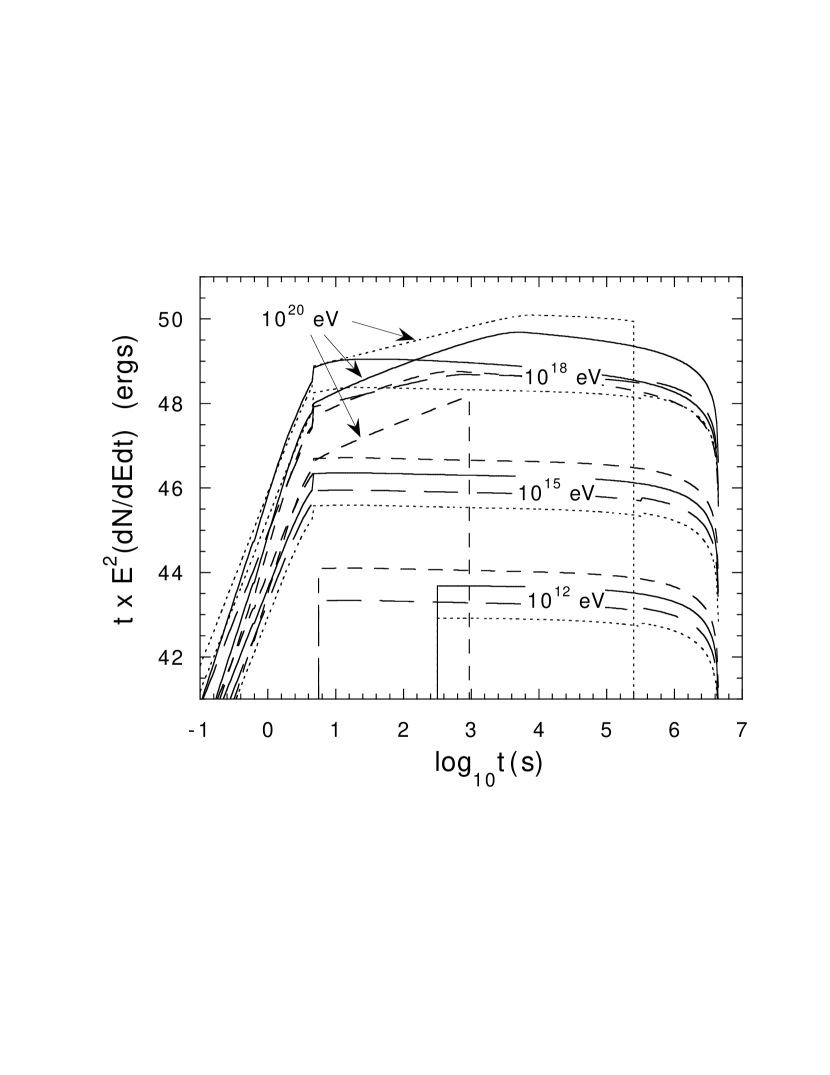
Fig. 5 shows calculations of the neutron and neutrino production time profiles at , , , and eV for parameter sets (A) and (B), as described in the figure caption. Here we have multiplied the spectra by observing time in order to reveal the time during which the bulk of the energy is radiated. For these parameters, roughly equal energy is radiated per decade of time, except at the very highest energies and during early times. From the analytic results for the temporal index in the afterglow phase, we find that and at intermediate energies, in agreement with the calculations. The lower energy regime with is not encountered here. The abrupt cutoffs at early and late times are due to the definite ranges of particle energies implied by the analysis.
4 Neutrinos from GRBs
The detailed calculations provide a lower limit to the neutrino fluxes if the UHECR/GRB hypothesis is correct. Even within the context of the external shock model, other effects could enhance the neutrino emissivity. For example, reverse shock emission provides additional soft photons that would enhance photomeson production (Dai and Lu, 2001). Larger neutrino fluxes could also be obtained if we relax the assumption that the surrounding medium is uniform, which is probably the case in many GRBs, in view of the short timescale variability observed in their -ray emission (Dermer and Mitman, 1999). Also important is the uncertainty in determining the rate density of dirty and clean fireballs.
Before displaying calculations, it is useful to make an estimate of the neutrino background expected from GRBs. The energy density of high-energy neutrinos from GRBs is
| (37) |
where we use equations (4) and (2) to give the mean emissivity at , and let the Hubble time yr. The term represents the production efficiency which, as we have seen, is %. For , the principal behavior of the time-integrated GRB neutrino spectrum varies up to some maximum energy - eV (see Fig. 2 and App. B), so that the diffuse neutrino background flux also varies . Using equation (37) to normalize this flux, we find
| (38) |
GRBs will therefore produce a diffuse neutrino flux at the level of GeV cm-2 s-1 sr-1 at eV. This flux333A similar estimate for the diffuse extragalactic -ray background, though now assuming a spectrum varying as might be expected from an electromagnetic cascade in the GRB blast wave, gives a diffuse flux of keV cm-2 s-1 sr-1. The -ray production efficiency could reach 10%, but this emission still falls well below the observed diffuse extragalactic -ray background, which has an intensity of keV cm-2 s-1 sr-1 between MeV and GeV (Sreekumar et al., 1998). is comparable to other estimates of cosmological neutrinos above eV (Gaisser et al., 1995; Yoshida and Teshima, 1993; see also Stecker et al., 1991).
4.1 Diffuse Neutrino Background
Each GRB produces a time-integrated neutrino spectrum ( , where is the energy of the emitted neutrino. The luminosity distance is defined so that the relationship ) holds, where is the differential element of time in the emitter frame. Because and , we find that
| (39) |
The differential event rate observed from bursting sources with comoving density is (e.g., Weinberg, 1972; Dermer, 1992). For a Friedmann-Robertson-Walker universe, (Totani, 1999). The diffuse flux of neutrinos produced by the superposition of GRBs throughout the universe is therefore
| (40) |
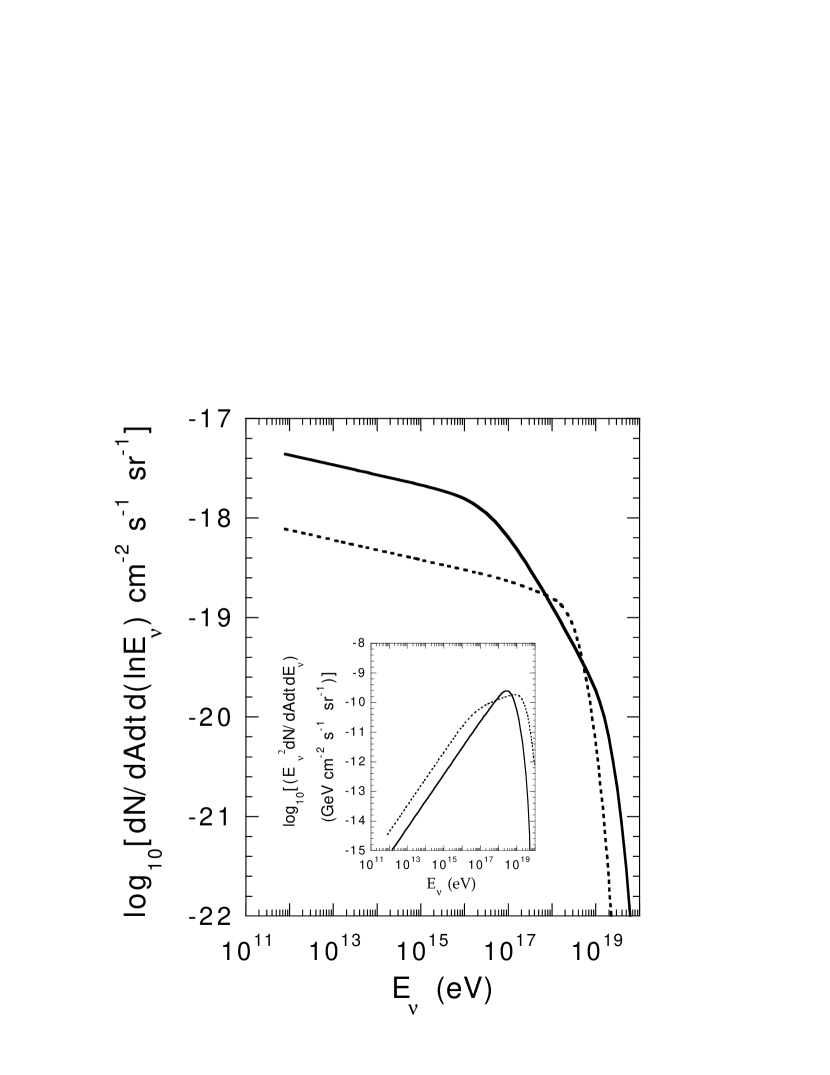
Calculations of the diffuse neutrino background, using equation (1) with standard parameter sets (A) and (B) in equation (40), are shown in Fig. 6. As before, we use a cosmology with and . The relevant units conversion is -Gpc3-yr) cm-2 s-1. The solid curve is for parameter set (A), and the dotted curve is for parameter set (B). The calculations are at the level of cm-2 s-1 sr-1 at eV. Thus the estimate of the diffuse neutrino background (38) is in accord with these results. Parameter set (A) produces a more luminous neutrino flux at lower energies because there are greater number of high energy soft photons, due to the smaller magnetic field used in this parameter set. It is not clear in this representation, but there is approximately equal energy fluxes in parameter sets (A) and (B), but most of the energy for set (B) is carried by neutrinos with energies between and eV.
4.2 GRB Neutrino Event Rate
The number of neutrino events that would be detected per year by a muon detector with an effective area of (km2) due to upward-going neutrinos is
| (41) |
In this expression, is the probability that a neutrino with energy , on a trajetory passing through a detector, produces a muon above threshold. From the work of Gaisser and Grillo (1987) and Lipari and Stanev (1991) as summarized in Gaisser et al. (1995), we use the following approximation to calculate neutrino event rates:
| (42) |
(see also Dai and Lu (2001)).
The number of events detected from a GRB at redshift is
| (43) |
Here, in contrast to equation (40), it is necessary to evaluate explicitly. It is given by
| (44) |
The size distribution of neutrino events can be obtained by evaluating the quantity
| (45) |
where a contribution to the integral occurs only if the number of neutrino events, calculated through equation (43), exceeds .
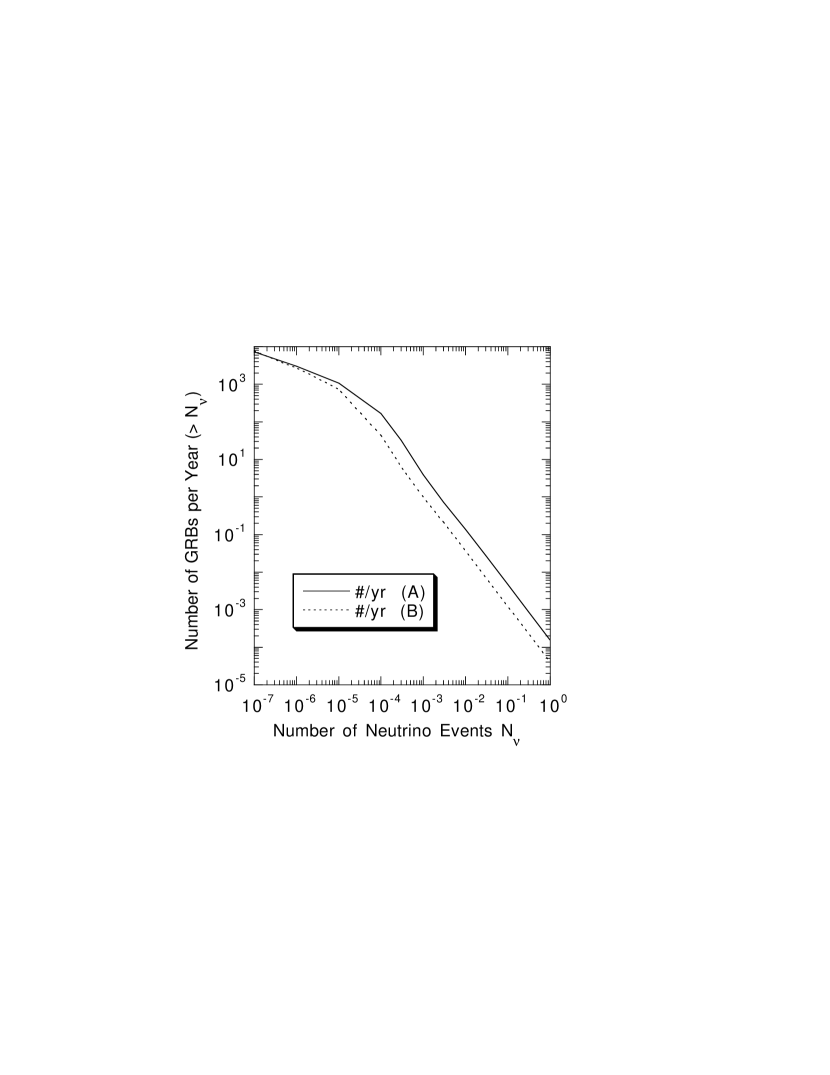
This calculation is displayed in Fig. 7. Neutrino detectors at energies eV are more sensitive to neutrino number flux rather than energy flux, so these neutrino spectra do not regrettably yield large numbers of neutrino events per year. Very weak neutrino fluxes are predicted in the external shock model of GRBs for smooth profile GRBs, and we predict that no neutrinos will be detected in coincidence with such GRBs. Detection by km2 detectors of multiple neutrino events from smooth-profile GRBs would probably rule out the external shock model. Obversely, the lack of detection of neutrino events from GRBs with smooth profiles is fully consistent with the underlying assumptions of this study. The predicted neutrino signal from highly variable GRBs will require more study. Detectable neutrino emission with km3 neutrino telescopes is predicted within an internal shell model (Waxman and Bahcall, 1997), though it is not clear if these predictions also apply to smooth-profile GRBs.
5 Radiation Halos from Neutrons Produced by GRBs
After production, neutrons with Lorentz factor will travel a characteristic distance kpc before their numbers are depleted by -decay. Figs. 2a and 2b show that for strong GRBs, of the explosion energy is carried by neutrons with - eV, or . Thus a halo of neutron-decay electrons, protons, and neutrinos will be formed around the site of a GRB that extends over a size scale of kpc - 1 Mpc. The characteristic neutron-decay lifetime is yrs. If the -decay electrons radiate on a timescale that is much shorter than the neutron-decay timescale, then the peak power of a single energetic GRB explosion in the extended nonthermal radiation halo could reach
| (46) |
where is a temporal correction factor. This assumes a neutron-production efficiency of 1%, as applies to GRBs with ergs (see Fig. 3). The power in the outflowing neutron-decay protons is larger than that given by equation (46), but will only be detected if the protons can radiate this energy or deposit it in a galaxy halo to be radiated through other processes. Given the rarity of powerful GRB events, it is unlikely that the nonthermal halo from neutron-decay electrons surrounding a galaxy will consist of the superposition from several GRBs at the frequency of greatest luminosity, but will instead be formed by a single event. If GRBs are stongly beamed, however, the radiation halos will consist of a superposition of emissions from many GRBs. In Section 5.1 we derive the radiation halo from a single powerful GRB “neutron bomb.” Highly beamed GRBs will produce halos that are time averages of the emission spectra formed by a single GRB, weighted by the energy of events. Section 5.2 outlines energy deposition into the halo from neutron-decay protons. We also note that this process will make a very weak, long-lived afterglow of very energetic neutron-decay neutrinos. Section 5.3 describes multiwavelength prospects for detecting these halos.
5.1 Radiation Halo from Neutron -Decay Electrons
The neutron flux (neutrons cm-2 s-1) at location in the case of a spherically symmetric explosion is simply
| (47) |
where is the time measured in the rest frame of GRB source and is the differential number of neutrons produced at time with Lorentz factors in the range between and . The -decay electron and antineutrino each receive on average 0.6 MeV from the decay (the neutron-proton mass difference is MeV). It is sufficiently accurate for the purposes here to let the proton and -decay electron each receive the same Lorentz factor as the neutron originally had. Thus the differential emissivity of either neutron-decay protons or electrons is simply
| (48) |
(see also Giovanoni and Kazanas (1990); Contopoulos and Kazanas (1995)).
If we consider only the neutrons with which decay on timescales s, then the GRB explosion and afterglow can be approximated as a -function in time. If we also approximate the neutron production spectrum as a single power law, then the neutron source spectrum can be represented by
| (49) |
where is the spectral index of the neutron number spectrum, and is the maximum neutron Lorentz factor. Normalizing this spectrum to the total energy in neutrons, we have
| (50) |
Because , it is irrelevant whether the minimum value of is 1, as used here, or . Without loss of generality, we let the explosion time . Substituting equations (49) and (47) into equation (48) gives
| (51) |
We now consider the radiation signature of the neutron-decay electrons. Subsequent transport of the electrons can be neglected if an on-the-spot approximation is valid, which holds if the electron Larmor radius is much less than . This requires that the halo magnetic field G. Faraday rotation measures of galaxy clusters and inferences from synchrotron radio halos indicate that cluster fields are G (see, e.g., the review by Eilek (1999)). It seems likely that galaxy halos would also be this strong. The solution to the electron continuity equation
| (52) |
is
| (53) |
Synchrotron radiation and Compton scattering of the cosmic microwave background radiation will dominate the energy losses of the electrons, although a more detailed treatment must treat Klein-Nishina effects which become important for electrons with , where K. These loss rates can be written as (see discussion following equation (23)). Substituting equation (51) into equation (53) and solving gives the result
| (54) |
where and
| (55) |
Thomson and synchrotron losses can be treated on equal footing by rewriting equation (23) in terms of the photon emissivity
| (56) |
The quantity for synchrotron emission, and for Thomson scattering, where is the characteristic dimensionless photon energy of the radiation field. The frequency , where the dimensionless field energy density for synchrotron emission and for Thomson scattering, where is the spectral density of the soft photon field. These equations are valid when . The restriction to the classical synchrotron regime always holds in this system, but the restriction to the Thomson regime may not apply, as already noted.
It is elementary to substitute equation (54) into equation (56) to obtain the photon emissivity at location and time . The spectrum observed at time requires an integration over volume. Because the neutrons are flowing out at speeds very close to the speed of light, the expression accurately relates the explosion frame time and the observer time. Taking this relationship into account finally gives the synchrotron or Thomson spectrum observed at time after a GRB explosion. It is
| (57) |
where
| (58) |
The flux density (Jy) where is the observing frequency.
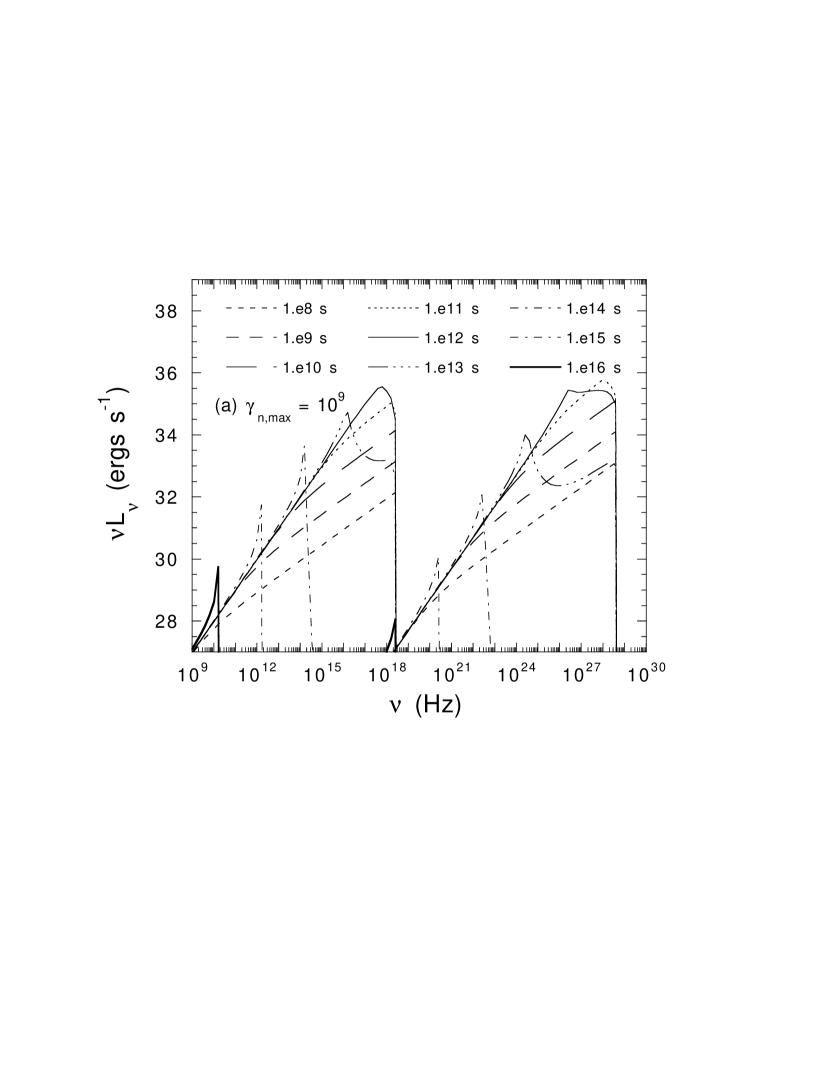
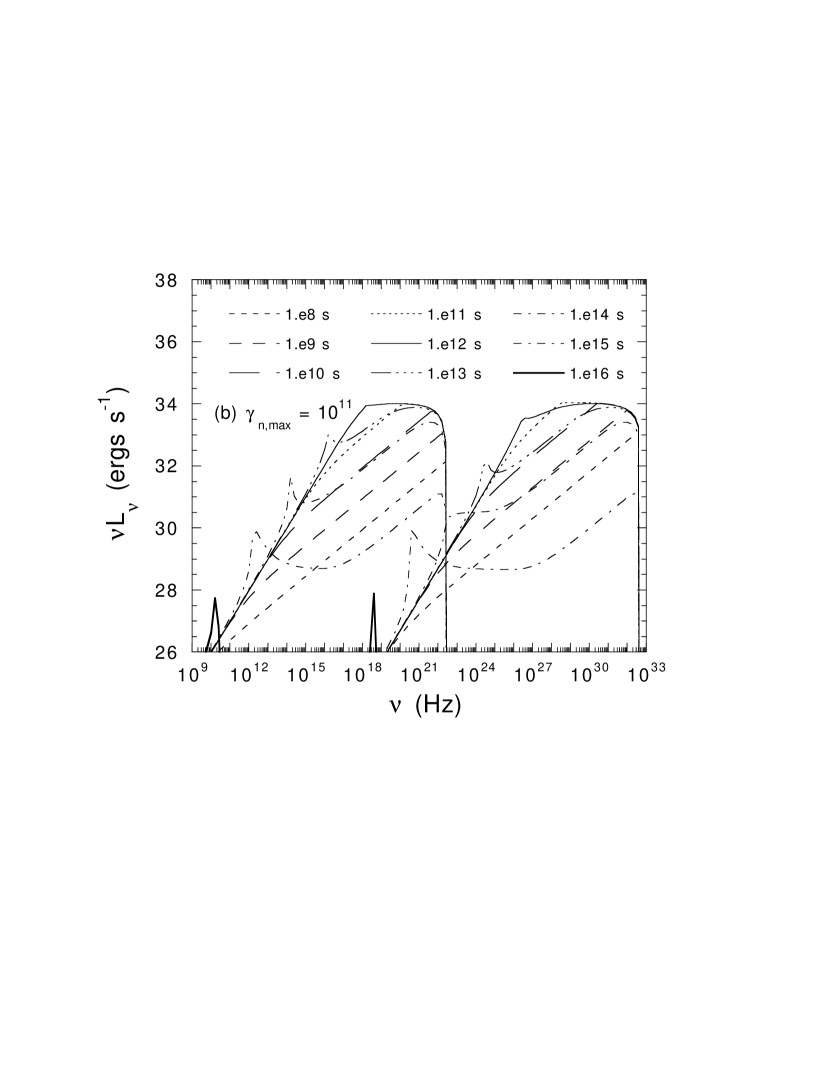
Fig. 8 shows calculations of the synchrotron and Thomson spectra emitted by neutron -decay electrons using equation (57). Here it assumed that ergs in neutrons are emitted with a spectrum up to a maximum Lorentz factor in Fig. 8a, and up to in Fig. 8b. In both calculations, we use a magnetic field G and approximate the cosmic microwave background radiation as a -function soft photon source with dimensionless photon energy and energy density ergs cm-3. Note that although the synchrotron and Thomson spectra are plotted in the same graph, they are independently calculated.
The peak luminosities reach ergs s-1 in Fig. 8a and ergs s-1 in Fig. 8b. The discrepancy with equation (46) implies that . This value is understood when one considers temporal smearing due to the finite energy-loss timescale, light travel-time effects and, most importantly, the contribution of late time () radiation. The bandwidth correction factor should also be considered. For a 1 G field, the energy-loss timescale is s, which for is comparable to the s neutron decay timescale. The temporal smearing due to light travel-time effects arising from emission produced on the far side of the explosion produces the high-energy features in the spectra observed at late times, particularly in Fig. 2b. In synchrotron and Thomson processes, the integrated luminosity decays at late times when most of the energy is injected in the form of high-energy electrons, as is the case here. Thus there is comparable energy radiated per decade of time at late times. A value of in equation (46) is therefore reasonable.
A notable feature in Fig. 8 is the appearance of sharp emission peaks at late times. These are the pileups that appear when electrons are injected with number indices harder than and lose energy through synchrotron and Compton processes (Pinkau, 1980). The synchrotron pileup features might be considerably broadened by magnetic-field gradients in the halos of galaxies. The situation regarding the pileup features in the Thomson peaks at ultra-high -ray energies is more complicated and will require further study. Besides the Klein-Nishina effects that are not considered here and are crucially important in Fig. 2b, rays with energies TeV Hz will materialize into e+-e- pairs through - interactions with the cosmic microwave background radiation to form a pair halo surrounding the galaxy (Aharonian et al., 1994). Photons with energies TeV will not be observed due to pair-production attenuation on the diffuse infrared radiation field. The energy processed by this electromagnetic cascade will be transferred, in most cases, from the Thomson to the synchrotron components (consider, however, Kirk and Mastichiadis (1992)). Given detailed modeling and sensitive observations, the relative powers in the X-ray/soft -ray synchrotron component and the high-energy -component could, in principle, be used to infer the halo magnetic field.
Effects of different magnetic field geometries and spatial variations of neutron injection due to beaming in GRBs should be considered in future work. Fig. 8 represents the simplest field geometry, but is representative of the integrated emission spectrum from radiation halos due to UHECR production in GRBs.
5.2 Radiation Halos from Neutron-Decay Protons
The neutron-decay protons carry three orders of magnitude more energy than the neutron-decay electrons, but this energy is also more difficult to extract. The proton Larmor radius is BG) kpc, so that much of the energy will be carried directly into intergalactic space when , even in the optimistic case of an extended ( kpc) galaxy plasma halo with a mean magnetic field of G. Such neutrons, together with the ultra-high energy protons and ions that diffusively escape from the blast wave, are of course postulated here to constitute the UHECRs. The Larmor timescale BG) s, so that a eV proton might random walk for s before diffusively escaping from a 1 G, 100 kpc halo into intergalactic space. The timescale for energy loss through secondary production is (cm-3) s, where the mean halo particle density cm-3. Even though secondary production is very inefficient, it could however compete with the energy deposition by neutron -decay electrons if cm-3, , and G. Although the distinctive signature of secondary production is the decay bump at MeV, it would be severely broadened due to the large Lorentz factors involved and would probably either not be detectable, or would form a low plateau to the diffuse galactic and intergalactic radiation fields.
Streaming instabilities excited by the outflowing neutron-decay protons could convert a large fraction of the available energy into long wavelength magnetohydrodynamic turbulence. Subsequent cascades of the turbulence energy to shorter wavelengths could accelerate electrons through gyroresonant interactions with whistler and Alfven waves. Such processes have been invoked to explain the formation of diffuse radio halos in rich clusters (for a recent review, see articles in the collection edited by Böhringer et al. (1999)). It would be difficult, however, to distinguish neutron-decay halo nonthermal radio emission from electrons accelerated by cluster merger shocks (e.g., Loeb and Waxman, 2000). Searches for neutron-decay halos from field galaxies would therefore be more definitive than searching for such halos around galaxies within or near the peripheries of a galaxy cluster.
5.3 Prospects for Detecting GRB Neutron-Decay Radiation Halos
Three neutron-decay radiation halos are distinguished. In the Type- halo, the power of the halo radiation field comes from -decay electrons. The previous section outlined in sufficient detail the principal radiative properties of a halo. The most important uncertainty, besides the ever-present question of GRB source collimation, is the ratio of the magnetic-field energy density in the halo to that in the cosmic background radiation. The -decay electrons in a synchrotron halo place most of the radiated power in the synchrotron component. In contrast, microwave or ambient photons are Compton-scattered to ultra-high -ray energies to precipitate a pair shower in a Compton halo.
In the Type-p (for proton) halo, the power of the halo radiation field comes from -decay protons. A p-halo can be much brighter than a halo, because it has a factor more energy available, but the extraction and subsequent reradiation of this energy is far less easily quantified than for the halo. Depending on the radiation transfer and environmental effects there are, as for the halos, synchrotron p-halos and Compton p-halos.
The third type of halo is the Type- (for neutrino) halo. The instantaneous neutrino energy spectra received at different times after the GRB can be obtained by following the approach of Section 5.1. The detection of a halo is not technically feasible at present.
5.3.1 Statistics of Neutron-Decay Halos
Our starting point was the differential source rate density, equation (1). There we noted that in the power-law approximations for the - and -dependences of the differential rate density, one-half of the energy generated by the sources of GRBs comes from cosmic sources with apparent isotropic energy releases ergs. Fig. 3 shows that the neutron production efficiency increases monotonically with energy; therefore most of the neutron energy comes from GRBs with ergs. These very energetic GRBs are, of course, much less frequent. Our study of GRB statistics (Böttcher and Dermer, 2000) shows that in the universe on small () scale, the rate density of GRB sources is Gpc-3 yr-1. Thus on average there are 0.43 GRB-type explosions per Gpc3 per year with energy ergs.
There are, speaking crudely, ( galaxies)/Mpc3, so that the density of galaxies in the local universe is Mpc-3 (compare Section 2.1). If all the mass of galaxies were wrapped up in galaxies, then each galaxy would see on average a GRB-type explosion with energy ergs every Myrs, assuming that GRB explosions are uncollimated. Let represent the characteristic FWHM duration when the emission at frequency from a neutron-decay halo reaches its peak luminosity . If Myr, then the fraction of galaxies displaying emission at this level is Myrs. If, on the other hand, Myrs, then the galaxy will exhibit a superposition of the emissions from many GRB neutron-decay halos, with the total halo brightness reaching Myr). If the beaming fraction is of the full sky (Frail et al., 2001), then GRBs will take place about once every years in an galaxy, and will display neutron-decay halos at a level corresponding to the average GRB power multiplied by the neutron -decay production efficiency. Under these circumstances, the average bolometric power of an galaxy from halos is at a level of ergs s 1% ergs s-1, where the factor of 4 accounts for clean and dirty fireballs, and the factor is a correction factor due to the enhancement of neutrino production in a clumpy medium.
5.3.2 Halos and -Halos: Essential Features
The essential features of a halo produced by a single uncollimated GRB are given by the peak photon frequency , the duration of peak luminosity , and radial extent of the halo. For a synchrotron halo, Hz, and yrs. Setting in equation (46), the peak luminosity ergs s-1. The radial extent of the halo is kpc.
A Compton -halo will be formed if the mean halo magnetic field G. In this case, cosmic microwave background photons are Thomson scattered to energies TeV. Many of these photons will materialize into electron-positron pairs through interactions with the cosmic diffuse background radiation field (Gould and Schréder, 1967) to initiate an electromagnetic cascade that channels the radiant power into lower energy rays and into a radially extended synchrotron component. The cascade ends when the photons penetrate the optical depth of the universe to attenuation. This quantity is not well known, but Stecker and de Jager (1998) calculate that for TeV photons from sources at due to absorption by the diffuse intergalactic infrared radiation field.
The -halo will be brightest if the neutron-decay protons transfer and radiate their energy on a timescale shorter than the light-crossing time . Given the model-dependent uncertainty of the emergent photon spectrum from a -halo, we approximate it with a spectrum that has constant value between Hz and Hz. The power radiated from the -halo formed by a single strong GRB is, in this crude approximation for the spectrum, therefore at best
| (59) |
where we use (compare eq.[46]). If the radiation is emitted in a narrow bandwidth, the -halo could be 2-3 orders of magnitude brighter. Thus there is emission in all observable wavebands at the level given by equation (59) during a period of s. The first-generation emission is distributed over a region of size kpc, but the cascade radiation from the pair halo can occupy a much larger volume.
5.3.3 Halo Detection: Observational Issues
GRBs were first detected with soft -ray instruments (see Dermer et al. (1999)). To survey prospects for detecting neutron-decay halos, we begin at soft -ray energies and move to lower frequencies, returning at the end to the high-energy -ray domain.
Soft -ray and X-ray Detection
The sensitivity limit of a detector such as BATSE is keV cm-2 s ergs cm-2 s-1 for a -100 s observation, and that of OSSE is ergs cm-2 s-1 for a two-week observation. Even with many orders of magnitudes improvement in sensitivity as provided by pointed instruments or position-sensitive technology, the detection of a neutron-decay halo is not easy with available X-ray detectors, much less -ray detectors. We estimate the limiting detection distance for a telescope with sensitivity ergs s-1 over its nominal point-source observing time and bandpass. The peak luminosity of a neutron-decay halo is given by equation (46), so that Mpc. This criterion eliminates all -ray instruments and all but the best X-ray detectors, such as Chandra444Unfortunately, the fact that the neutron-decay halos are spread over a region greatly exceeding the extent of the galaxy makes them more difficult to detect, because they they will be harder to resolve from the diffuse background. The strength of instruments such as Chandra is that it focuses all photons from a point source onto one or a few pixels, so that the back-ground is greatly reduced (M. Böttcher, private communication, 2000). with . Within a few Mpc, the Milky Way and M31 are the closest -type galaxies. The rough odds are that a detectable halo could be observed from % of nearby galaxies if GRBs releases their energy isotropically, leaving only the two galaxy candidates if Mpc. A neutron-decay halo from M31 would cover a half-angle extent of . Even for galaxies at Mpc, the challenge of background subtraction to reveal a cleaned X-ray image is severe, but would be assisted with model templates. It is worth recalling that beaming can increase the chance odds of sighting a galaxy that harbors a neutron-decay halo, but the halo itself would be at a proportionately smaller flux.
Optical Detection
In the spherical region that surrounds us to a depth of 100 Mpc, or within for , there are, according to the earlier statistic, galaxies. At Mpc, the half-angular extent of a neutron halo is ) arc minutes. At a sampling distance between and 100 Mpc, there are therefore abundant candidates with galaxy disk sizes of - arc seconds and a halo angular extent appropriate for an optical CCD. In the following, we sketch some basic considerations that enter optical halo detection.
-
•
The predicted -halo optical luminosity is ergs s-1, but a neutron-decay halo could be as bright as ergs s-1 if the parameters in the model are most optimistically tuned in favor of detecting a synchrotron -halo. Compared to the typical galaxy optical luminosity of ergs s-1, the halo luminosity provides a very weak flux. On the other hand, the emission is spread over a region that is far outside the optical radius of the galaxy.
-
•
The relative brightnesses of the central source and halo is -9 orders of magnitude, or -22 magnitudes. If the limiting magnitude is for a good ground-based telescope, then a halo could only be seen for galaxies with . Noting that for M31 implies that the limiting distance to detect a neutron-decay halo is Mpc for 2-3 meter class ground-based telescopes. In this case, the advantage of a halo that fills the CCD is lost, and the sensitivity of most large-aperture telescopes may not be good enough to detect the halo above background sources, the sky brightness and detector noise.
-
•
The limiting magnitude of the Hubble Space Telescope for point sources is . We could then potentially see neutron-decay halos to Mpc. Even at 100 Mpc, the halo subtends much of the CCD and the central bright source emission would have to be subtracted. For comparison, when subtracting central source flux from galaxy-disk flux in HST images, the contrast between the optical power of the AGN and that of the extended disk might have been - (this estimate is made by comparing optical luminosities of typical galaxies and QSOs, though the ratio could be even larger in studies where blazar light is subtracted from the host galaxy.) This still does not compare with the extreme contrast between the surface brightnesses of the optical disk of a galaxy and the surrounding diffuse halo. It seems that a blocking crystal for ground and space-based optical telescopes could be developed to eliminate the intense flux of the much brighter galaxy disks. The instruments on the Solar and Heliospheric Observatory probably achieve the greatest technical feat to detect faint objects in the field of a bright source ( or implies orders of magnitude blockage of the Sun), but the detection of halos around distant galaxies will clearly pose different problems.
-
•
Optical central-source luminosity is suppressed in certain classes of galaxies, most remarkably, those that are likely to harbor active star formation. Here we are thinking of edge-on starbursts (M82 or NGC 253-types) and dusty spirals, tidally-disturbed systems (e.g. Mrk 421 and its satellite galaxies (Gorham et al., 2000)), and infrared luminous mergers such as Arp 220, Mrk 273, and other non-quasar members in Arp’s atlas of peculiar galaxies. The search for neutron-decay halos also introduces a new avenue to examine the relative power of ULIGs (ultra-luminous IR galaxies) in stellar formation and black hole activity. The Infrared Space Observatory results on PHA/infrared line tracers of the starburst and AGN activity (Lutz et al., 1996) showed a separation of different galaxy types in a way that can be tested, because the strength of the neutron-decay halo is proportional to star-formation activity. The magnitude of either a halo or a -halo is, in this picture, directly proportional to the rate at which high-mass stars are formed, and is a basic assumption of the GRB statistics treatment of Böttcher and Dermer (2000).
-
•
AGNs and quasars introduce greater background subtraction problems, and pose the added difficulty of an interfering zodiacal light from high-latitude dust or gas that scatters the optical emission from the galaxy’s AGN and stellar radiation fields. The existence of rather dense high latitude (-100 kpc) dust seems quite likely in an AGN environment due, for example, to tidal activity, disk winds, AGN radiation pressure on surrounding gas, and gravitational effects from distorted dark-matter halos and galaxy bars. Diffuse scattering plasma might also, unfortunately, be found in ULIGs for the same reasons.
Technical considerations for detecting neutron-decay halos with optical telescopes will require an examination beyond the scope of this paper. A central insight is that even though point-source (“light-bucket”) fluxes dim with source distance according to in the Newtonian limit, the surface brightness of an optically thin source is constant (again, in the Newtonian limit). This effect has fundamental implications for observations against a source-confused and sky-limited background.
Radio Detection
The radio regime has the best sensitivity, with Hz mJy ergs cm-2 s-1, combined with excellent angular resolution. Improved resolution (VLBI) must trade off with better limiting sensitivity (VLA), both of which additionally depend on observing frequency. For an optimistic radio halo power of ergs s-1, the limiting sampling distance is only Mpc. Two effects determine the actual radio luminosity of a halo. The first, as seen in Fig. 8, is that the radio luminosity is times dimmer than the peak nonthermal synchrotron power from a synchrotron halo for our standard halo with a randomly oriented G mean magnetic field. This reduction is partially offset by the fact that the synchrotron decay timescale from the radio-emitting electrons and positrons is larger by a factor of than the burst timescale (see Fig. 8) in the case of a 1 G halo. The net result is to reduce the sampling distance so that detecting the radio emission from a halo turns out again to be difficult. In the event of a very weak (G) halo magnetic field, the reprocessing of the Compton power into the synchrotron component could however improve radio detectability by moving to lower frequencies (see Section 5.3.2). To take advantage of the good radio resolution (the size of the radio halo for sources at ( Mpc) is on the order of a few arc-seconds) would require detection of cm2- HzJy fields spread over a surface area of this extent. This is not yet feasible. The tradeoff between angular extent and sensitivity will be helped if radio techniques can yield cleaned images that are in extent. Wherever the radio range proves to have the greatest capability (probably for galaxies at a few tens of Mpc), structure in the neutron-decay radio halo should be carefully sought. The advantage here is that to test the UHECR/GRB hypothesis, every galaxy should have a diffuse neutron-decay radio halo, whether or not GRB outflows are collimated.
The very low-frequency ( MHz) emission from neutron-decay halos persists around all galaxies, and forms part of the diffuse low-frequency radio background. Whether detection of such halos is technically feasible with new-generation radio arrays (e.g., the planned low-frequency array LOFAR) will require more study.
High Energy -ray Detection
Returning now to the ultra-high energy gamma-ray regime, neither GLAST nor the ground-based air and water Cherenkov telescopes operating or in development (e.g., Whipple, Milagro, HESS, VERITAS) can be expected to detect a Compton halo. Only under the most optimistic conditions of a highly luminous Compton -halo at ergs s-1 is detection feasible. GLAST is times more sensitive than EGRET, which had a limiting sensitivity of few ergs cm-2 s-1, as does Whipple. This gives a sampling distance of kpc. With the seven-fold increase in limiting distance for GLAST, and with the improvement that will be achieved with the VERITAS array, there remains a chance of detecting highly luminous Compton -halos from nearby galaxies.
In summary, the search for direct synchrotron, and both direct and cascade radiation from neutron-decay halos predicted by the external shock model are at limits that challenge current radio, optical, X-ray, and -ray detector technology. The predicted weakness of the -decay halos reflects the low neutron production efficiency in this model. The stronger neutrino and neutron production within the context of an internal shock scenario (Waxman and Bahcall, 2000; Dai and Lu, 2001) would imply neutron decay halos times brighter. However, because of the uncertainty in the brightness of a -halo, the detection of neutron-decay halos at the level of ergs s-1 around galaxies would not discriminate between internal and external shock models. Radiation halos detected at the level of - ergs s-1 around galaxies would be inconsistent with an external shock scenario, but would require stong damping of the very energy neutron-decay proton energy in an internal shell model. The much stronger neutrino production in the internal shock model will also provide a clear discriminant between internal and external shock scenarios.
6 Cosmic Ray Production by GRBs
As summarized in the Introduction, observations indicate that GRBs are associated with supernovae taking place in star-forming galaxies. Statistical analyses within the external shock model show that progenitor sources of GRBs inject a time- and space-averaged power ergs s-1 into an galaxy. More general arguments also show that the power injected into the Milky Way by fireball transient sources with relativstic outflows is at the level of ergs s-1 (Dermer, 2000b). This is much smaller than the ergs s-1 thought to be injected into the Galaxy by SNe of all types. It is also somewhat smaller than the galactic cosmic-ray luminosity of ergs s-1 that is estimated to be required to power hadronic cosmic rays, depending on the assumed efficiency for accelerating hadronic cosmic rays. But the global cosmic-ray power estimate assumes that the locally observed cosmic-ray energy density is typical throughout the galaxy, and that temporal stochastic variations are not large. Both of these assumptions could be wrong (Hunter et al., 1997; Pohl and Esposito, 1998). The derived FT power is sufficiently close to suggest that the progenitor sources of GRBs could power a significant fraction of the hadronic cosmic rays in the Galaxy.
We additionally note several difficulties for the conventional view that cosmic rays are accelerated by supernovae in the galaxy (see Dermer (2000a) for further detail): (i) Spectral signatures of the hadronic cosmic-ray component associated with emission features, which carries -100 times as much energy as the leptonic cosmic-ray component, have not been detected unambiguously in the vicinity of SNRs (Esposito et al., 1996). (ii) The unidentified EGRET sources have not been firmly associated with SNRs (Romero et al., 1999), and several candidate SNRs are more likely to be associated with pulsars (e.g., Mirabal et al., 2001). (ii) TeV gamma rays are not detected from SNRs at the level expected from hadronic acceleration in SNR shocks (Buckley et al., 1998; Aharonian et al., 2001). (iii) The measured spectrum of the diffuse galactic -ray background is harder than predicted if the locally measured cosmic-ray proton spectrum is typical of other places in the Milky Way (Hunter et al., 1997). (iv) The origin of cosmic rays at and above the knee of the cosmic-ray spectum and the smooth transition at the knee are difficult to explain with a SN shock model (Lagage and Cesarsky, 1983; Dermer, 2001).
We therefore suggest that cosmic rays originate from the subclass of SNe that are progenitors of GRBs. (Milgrom and Usov (1996) and Dar and Plaga (1999) have also suggested that cosmic rays might be accelerated by the sources of GRBs.) How frequent are these events compared to other types of SNe? We can evaluate this rate from the statistical study of Böttcher and Dermer (2000), or by modifying this study in view of the constant energy reservoir result of Frail et al. (2001).
The “supernova unit”
| (60) |
is defined in terms of the number of events of a given type per Solar luminosities in the blue band per century, recalling from Section 2.1 that Gpc-3, where . For reference, note also that 1 SNu GEM, where the conversion factor to galactic events per Myr [GEM of events - yr); Wijers et al. (1998)] uses a Milky Way blue-band luminosity pc (Binney and Merrifield, 1998; Scalo and Wheeler, 2002).
The local rate density of FTs calculated by Böttcher and Dermer (2000) when in equation (3) is Gpc-3 yr-1, implying a rate of GEM, or in supernova units. In galaxies of type Sbc-Sd, and for Type II and Type Ib/c SNe, respectively (Cappellaro et al., 1997; Scalo and Wheeler, 2002). Hence the ratio , and . The FT rate density is, however, very sensitive to the number of low energy GRBs, and so could be times less frequent if .
If we accept the standard energy reservoir result of Frail et al. (2001), then the rate of the brightest GRBs will be times the observed rate. For the FT rate of Gpc-3 yr-1, which is the minimum rate necessary to fit the BATSE statistics within the external shock model, this implies a FT within the Milky Way - yr-1, depending on the density.555Two measures of the density of galaxies like the Milky Way, which is assumed to be L∗-like, are used in this paper. The Gpc-3 figure refers to the number density of galaxies with luminosities between and (Section 5.3.1). The method of energy-weighting that was applied to the Schechter luminosity function in equation (5) implies an density of Gpc-3. Given the uncertainties associated with the rate and beaming estimations, we can expect that a GRB or FT will occur about once every - yr in the Galaxy. Consequently in every 10-100 SNe will display relativistic outflows including, in -50% of the cases, a GRB. GRBs are probably associated with the rarer Type Ib/c SNe that have lost their hydrogen envelopes. This prediction can be tested with a sample of many dozens of SNe Ib/c, where follow-on radio monitoring is used to identify relativistic outflows (Kulkarni et al., 1998; Weiler et al., 2000). A small fraction of SNe in our Galaxy should exhibit strong hadronic signatures associated with cosmic ray production.
There are -1000 black holes formed per Myr in the Milky Way if a black hole is formed by every GRB and FT. Over the yr age of our galaxy, - black holes are thus formed. Gravitational deflection of the black holes off other stars and molecular clouds would increase the scale height of the older black holes to values exhibited by the older K and M stellar populations (e.g., Bahcall and Soneira, 1980). A population of isolated black holes that accrete matter from the ISM will thus be formed by GRBs (Armitage and Natarajan, 1999; Dermer, 2000b). Some of the EGRET unidentified sources could originate from accreting, isolated black holes.
7 Summary and Conclusions
We considered implications of the hypothesis that UHECRs are accelerated by the sources of GRBs in this paper. Here are the main points deduced from this study:
-
1.
The statistical study of GRBs in the external shock model (Böttcher and Dermer, 2000) gives the rate density and emissivity of GRBs, and the number of GRBs with different Lorentz factor and total apparent isotropic energy . The event rate is very uncertain for weak GRBs, but most of the energy comes from the rare strong GRBs with ergs. If GRBs are highly beamed, as suggested by Frail et al. (2001) and Panaitescu and Kumar (2001), then GRBs and fireball transients with ergs could occur as frequently as once every - yrs in the Galaxy.
-
2.
Formulae for the nonthermal synchrotron emission spectra produced by an external shock were used to derive the comoving nonthermal synchrotron photon spectra in the blast wave. This radiation provides target photons for the very energetic nonthermal particles. Neutrons, neutrinos, positrons, and pairs are formed as byproducts of -p and -ion interactions.
-
3.
Neutron and neutrino production spectra and light curves formed in photomeson interactions are readily derived in the external shock model. The neutrino flux from individual GRBs is far too weak to be detected by km2 neutrino detectors, because most of the energy is carried by relatively few, very energetic neutrinos. GRBs might still contribute the major fraction of the diffuse neutrino background for neutrinos with energies eV. The energy carried away by neutrons from very energetic GRBs with will exceed 1% of the total energy; reverse shock emission giving enhanced target photons could make the neutron-production efficiency even larger, though SSC processes might reduce it.
-
4.
Galaxies with GRB activity will be surrounded by neutron-decay halos formed by emissions from -electrons and neutron-decay protons. The halo size is kpc, where is the Lorentz factor of the neutrons that carry most of the energy from the GRB. The shortest halo emission lifetime from a single GRB is yrs. The peak luminosity of a halo from a single smooth-profile GRB is ergs s-1. Depending on the magnetic field strength in halos of galaxies, the neutron -decay electrons will produce a nonthermal synchrotron halo with peak luminosities at optical/X-ray/soft -ray energies, and a Compton halo at very high (GeV-TeV) -ray energies when the high-energy electrons Compton-scatter photons of the cosmic microwave radiation and induce a cascade. The -halo formed by neutron-decay protons is more difficult to quantify and could be much brighter than the emission from a halo.
-
5.
Because of sensitivity and imaging capabilities, prospects for detecting neutron -decay halo emission are best at optical and radio frequencies. For optimistic model parameters, it might also be technically feasible to detect these halos at X-ray and -ray energies. The subtraction of the light from the bright central galaxy is a major obstacle to halo detection at optical frequencies. Approximately % of galaxies should display a halo from a single GRB near the peak of its luminosity output for unbeamed GRBs. If GRBs are highly beamed, then essentially all galaxies will be surrounded by such halos, but at a weaker average flux. The average bolometric neutron-decay halo emission surrounding an galaxy is ergs s-1 from smooth-profile fireball transients, but could be greater for GRBs occurring in inhomogeneous surroundings.
-
6.
The emissivity of the progenitor sources of GRBs in our Galaxy potentially provides a large fraction of the luminosity required to power the galactic cosmic rays. If cosmic rays are accelerated by the supernovae that collapse to form a GRB, about 1 out of -100 supernova remnants in the Galaxy should have harbored a GRB, so that detection of a strong hadronic signature from a subset of supernovae should support this model for the origin of cosmic rays.
In addition to the search for GRB neutron-decay radiation halos around galaxies, further progress on these problems will be achieved by searching for neutrino emission from GRBs. Detection of high-energy neutrinos from smooth profile GRBs would probably rule out the external shock model for the prompt phase of GRBs. Another important study is to search for the sister classes of GRBs that do not trigger GRB detectors. Present GRB telescopes have strong triggering biases against dirty and clean fireballs transients predicted by the external shock model that can be remedied with appropriate slewing strategies and new detector designs (Dermer et al., 1999). Most important is to identify hadronic emission from SNRs through gamma-ray observations, and to determine if cosmic ray production is typical of all SNRs or, as suggested here, only a small subset of SNe that are associated with GRBs.
Appendix A Synchrotron Radiation Limit on Maximum Proton Energy
We derive an expression for the maximum proton energy that results from a competition between the acceleration energy-gain rate and the synchrotron energy-loss rate. For the acceleration rate, we assume that a particle cannot gain a large fraction of its energy at a rate more rapid than the gyrofrequency (Guilbert et al., 1983; Kirk, 1991; de Jager et al., 1996; Rachen and Mésázaros, 1998). This condition follows from general considerations for either first- or second-order acceleration. In either case, , where is the particle momentum in the comoving frame and is an unknown parameter. For first-order Fermi acceleration in the Bohm diffusion approximation, , where is the upstream speed. For second-order Fermi acceleration, , where is the Alfven speed of the scattering centers and is the fractional energy density of resonant waves (Dermer, 2001).
The synchrotron radiation limit is obtained by balancing the acceleration rate with the synchrotron energy-loss rate given through equation (32). It easily follows that the maximum observable proton Lorentz factor is
| (A1) |
The synchrotron radiation limit is implemented in the calculations with . Thus, for example, the timescales of the highest energy protons shown in Figs. 1a and 1b derive from this limit. Other effects that limit maximum particle energy through second-order Fermi acceleration in a GRB blast wave, such as available time and the requirement that the Larmor radius of the accelerated particle be less than the blast-wave width, are considered elsewhere (Dermer and Humi, 2001).
Appendix B Analytic Estimate of Photomeson Production Efficiency
The comoving differential photon energy density in a blast-wave geometry is
| (B1) |
The comoving differential photon density is , and the synchrotron emission is assumed to be isotropic in the comoving frame, so that .
The time scale for significant energy loss by photohadronic reactions is given, following equation (29), by
| (B2) |
where , cm2, , , and we now use primes to refer particle Lorentz factors to their proper frame. The comoving time available to undergo hadronic reactions is . The quantity
| (B3) |
represents the efficiency to lose energy through photohadronic processes.
In a fast cooling scenario, the photon energy at the peak of the spectrum is
| (B4) |
The threshold condition requires acceleration of protons with observer-frame energies when scattering photons with . Because following the prompt phase, demands on particle acceleration to scatter photons with are more easily satisfied during the early episodes () of a GRB.
The synchrotron flux can therefore be written as
| (B5) |
We evaluate equation (B3) at , and denote quantities at this time with hats. From equations (21) and (23) at corresponding to in a fast cooling scenario,
where ]. Hence and for , and for in the fast cooling limit (at smaller photon energies, though still above the synchrotron self-absorption frequency, ). From eq. (B3),
| (B6) |
Thus
| (B7) |
We (Dermer et al., 1999, 1999a; Böttcher and Dermer, 2000; Dermer, 2000b) have previously shown that joint consideration of blast wave temporal and spectral characteristics of external shock emission, levels of the diffuse background radiation, and triggering characteristics of -ray detectors cause burst telescopes to be biased in favor of the detection of GRBs with the prompt phase peak frequency , where is the photon energy of the telescope’s largest effective area. For the BATSE telescope, -1. Parameter sets A and B imply that and , and and , respectively. The estimate for compares favorably with the results of Figs. 1a and b. This estimates apply to protons with energy eV, which follows from the condition .
From equation (B6) it is easy to show that in the fast cooling limit, and at progressively higher proton energies.
The spectral model used to fit the BATSE statistics is degenerate in the quantity (Böttcher and Dermer, 2000), and is also degenerate in this quantity (eq. [B4]). But the photomeson production efficiency which, when the invariance is removed, indicates that
| (B8) |
Based on the measured directional energy releases and the duration distribution of GRBs, - and uniform CBM densities - cm-3 are implied. The lower range of the densities are similar to values deduced from GRB afterglow fits (Panaitescu and Kumar, 2001; Wijers and Galama, 1999; Panaitescu and Kumar, 2001a). Clouds or clumps in the external medium with densities cm-3 are argued in this model to produce shorter duration spikes in GRB light curves, and so from equation (B8) could be more neutrino and neutron luminous. The conclusions of neutrino and neutron power calculated in this paper apply to smooth profile GRBs, and we predict no coincident neutrino fluxes from this type of GRB.
References
- Aharonian et al. (2001) Aharonian, F. et al. 2001, A&A, 370, 112
- Aharonian et al. (1994) Aharonian, F. A., Coppi, P. S., and Völk, H. J. 1994, ApJ, 423, L5
- Armitage and Natarajan (1999) Armitage, P. J., and Natarajan, P. 1999, ApJ, 523, L7
- e.g., Bahcall and Soneira (1980) Bahcall, J. N., and Soneira, R. M. 1980, ApJS, 44, 73
- however, see Beloborodov (2000) Beloborodov, A. M. 2000, ApJ, 539, L25
- Binney and Merrifield (1998) Binney, J., and Merrifield, M. 1998, Galactic Astronomy (Princeton: Princeton University Press)
- Blain et al. (1999) Blain, A. W., Jameson, A., Smail, I., Longair, M. S., Kneib, J.-P., and Ivison, R. J. 1999, MNRAS, 309, 715
- Blandford and McKee (1976) Blandford, R. D., and McKee, C. F. 1976, Phys. Fluids, 19, 1130
- Bloom et al. (1999) Bloom, J. S., et al. 1999, Nature, 401,453
- Bloom et al. (1999a) Bloom, J. S., et al. 1999a, ApJ, 518, L1
- Böhringer et al. (1999) Böhringer, H., Feretti, L., and Schuecker, P., eds., 1999, Diffuse Thermal and Relativistic Plasma in Galaxy Clusters, MPE Report 271
- Böttcher (2000) Böttcher, M. 2000, ApJ, 539, 102
- Böttcher and Dermer (1998) Böttcher, M., and Dermer, C. D. 1998, ApJ, 499, L131
- Böttcher and Dermer (2000) Böttcher, M., and Dermer, C. D. 2000, ApJ, 529, 635; (e) 2000, ApJ, 536, 513
- Böttcher and Dermer (2000a) Böttcher, M., and Dermer, C. D. 2000a, ApJ, 532, 281
- Briggs et al. (1999) Briggs, M. S. et al. 1999, ApJ, 524, 82
- Buckley et al. (1998) Buckley, J. H., et al. 1998, A&A, 329, 639
- Cappellaro et al. (1997) Cappellaro, E., Turatto, M., Tsvetkov, D. Y., Bartunov, O. S., Pollas, C., Evans, R., and Hamuy, M. 1997, A&A, 322, 431
- Castander and Lamb (1999a) Castander, F. J., and Lamb, D. Q. 1999a, ApJ, 523, 593
- Castander and Lamb (1999b) Castander, F. J., and Lamb, D. Q. 1999a, ApJ, 523, 602
- Chiang and Dermer (1999) Chiang, J., and Dermer, C. D. 1999, ApJ, 512, 699
- Cohen et al. (1997) Cohen, E., Katz, J. I., Piran, T., Sari, R., Preece, R. D., and Band, D. L. 1997, ApJ, 488, 330
- Contopoulos and Kazanas (1995) Contopoulos, J., and Kazanas, D. 1995, ApJ, 441, 521
- Costa et al. (1997) Costa, E., et al. 1997, Nature, 387, 783
- Dai and Lu (2001) Dai, Z. G., and Lu, T. 2001, ApJ, 551, 249
- Dar and Plaga (1999) Dar, A., and Plaga, R. 1999, A&A, 349, 259
- de Jager et al. (1996) de Jager, O. C., Harding, A. K., Michelson, P. F., Nel, H. I., Nolan, P. L., Sreekumar, P., and Thompson, D. J. 1996, ApJ, 457, 253
- Dermer (1992) Dermer, C. D. 1992, Phys. Rev. Lett., 68, 1799
- Dermer (2001) Dermer, C. D., 2001, in Proc. 27th ICRC, Hamburg, Germany, 6, 2039
- Dermer and Mitman (1999) Dermer, C. D., and Mitman, K. E. 1999, ApJ, 513, L5
- Dermer et al. (1999a) Dermer, C. D., Böttcher, M., and Chiang, J. 1999a, ApJ, 515, L49
- Dermer et al. (1999) Dermer, C. D., Chiang, J. and Böttcher, M. 1999, ApJ, 513, 656
- Dermer et al. (2000b) Dermer, C. D., Chiang, J., and Mitman, K. E. 2000b, ApJ, 537, 785
- Dermer and Humi (2001) Dermer, C. D., and Humi, M. 2001, ApJ, 556, 479
- Dermer and Böttcher (2000) Dermer, C. D., and Böttcher, M. 2000, ApJ, 534, L155
- Dermer and Böttcher (2002) Dermer, C. D., and Böttcher, M. 2002, to be submitted to Reviews of Modern Physics
- Dermer et al. (2000a) Dermer, C. D., Böttcher, M., and Chiang, J. 2000a, ApJ, 537, 255
- Dermer (2000a) Dermer, C.D., astro-ph/0005440, v. 1
- Dermer (2000b) Dermer, C.D., Proc. Heidelberg 2000 High-Energy Gamma-Ray Workshop, ed. F. A. Aharonian and H. Völk (AIP: New York), p. 202 (astro-ph/0010564)
- Djorgovski et al. (2001) Djorgovski, S. G., et al. 2001, in Gamma Ray Bursts in the Afterglow Era, ed. E. Costa, F. Frontera, and J. Hjorth (Springer: Berlin), 218
- Efremov et al. (1998) Efremov, Y. N., Elmegreen, B. G., and Hodges, P. W. 1998, ApJ, 501, L163
- Eilek (1999) Eilek, J. 1999, in Diffuse Thermal and Relativistic Plasma in Galaxy Clusters, ed. H. Böhringer, L. Feretti, and P. Schuecker, MPE Report 271, 71
- Esposito et al. (1996) Esposito, J. A., Hunter, S. D., Kanbach, G., and Sreekumar, P. 1996, ApJ, 461, 820
- Fenimore and Ramirez-Ruiz (1999) Fenimore, E. E., and Ramirez-Ruiz, E. 1999, ApJ, submitted (astro-ph/9909299)
- Frail et al. (1999) Frail, D. A., et al. 1999, ApJ, 525, L81
- Frail et al. (2001) Frail, D. A., et al. 2001 (astro-ph/0102282)
- Fruchter et al. (1999) Fruchter, A. S., et al. 1999, ApJ, 519, L13
- Furlanetto and Loeb (2002) Furlanetto, S., and Loeb, A. 2002, ApJ, submitted (astro-ph/0203044)
- Gaisser (1990) Gaisser, T. K. 1990, Cosmic Rays and Particle Physics (New York: Cambridge University Press), 148
- Gaisser and Grillo (1987) Gaisser, T. K., and Grillo, A. F. 1987, Phys. Rev. D, 36, 2752
- Gaisser et al. (1995) Gaisser, T. K., Halzen, F., and Stanev, T. 1995, Phys. Repts., 258(3), 173
- Galama et al. (1998) Galama, T. J., et al. 1998, Nature, 395, 670
- Galama et al. (2000) Galama, T. J., et al. 2000, ApJ, 536, 185
- Gallant and Achterberg (1999) Gallant, Y. A., and Achterberg, A., 1999, MNRAS, 305, L6
- Gallant et al. (1999) Gallant, Y. A., Achterberg, A., and Kirk, J. G. 1999, A&AS, 138, 549
- Giovanoni and Kazanas (1990) Giovanoni, P. M., and Kazanas, D. 1990, Nature, 345, 319
- Gorham et al. (2000) Gorham, P. W., van Zee, L., Unwin, S. C., and Jacobs, C. S. 2000, AJ, 119, 1677
- Gould and Schréder (1967) Gould, R. J., and Schréder, G. P. 1967, Phys. Rev., 155, 1404
- Grindlay (1999) Grindlay, J. E. 1999, ApJ, 510, 710
- Guilbert et al. (1983) Guilbert, P. W., Fabian, A. C., and Rees, M. J. 1983, MNRAS, 205, 593
- Halzen and Hooper (1999) Halzen, F., and Hooper, D. W. 1999, ApJ, 527, L93
- Harrison et al. (1999) Harrison, F. A., et al. 1999, ApJ, 523, L121
- Hogg and Fruchter (1999) Hogg, D. W., and Fruchter, A. S. 1999, ApJ, 520, 54
- Hunter et al. (1997) Hunter, S. D., et al. 1997, ApJ, 481, 205
- Kirk (1991) Kirk, J.G., in Relativistic Hadrons in Cosmic Compact Objects, ed. A. A. Zdziarski and M. Sikora (New York: Springer-Verlag), 91
- Kirk and Mastichiadis (1992) Kirk, J. G., and Mastichiadis, A. 1992, Nature, 360, 135
- Krumholz et al. (1998) Krumholz, M., Thorsett, S. E., and Harrison, F. A., 1998, ApJ, 506, L81
- Kulkarni et al. (1999) Kulkarni, S. R., et al. 1999, Nature 398, 389
- Kulkarni et al. (1998) Kulkarni, S. R., et al. 1998, Nature 395, 663
- Kumar (1999) Kumar, P. 1999, ApJ, 523, L113
- Lagage and Cesarsky (1983) Lagage, P. O., and Cesarsky, C. J. 1983, A&A, 118, 223
- e.g., Lamb (1999) Lamb, D. Q. 1999, A&AS, 138, 607
- Lipari and Stanev (1991) Lipari, P., and Stanev, T., 1991, Phys. Rev. D, 44, 3543
- Loeb and Perna (1998) Loeb, A., and Perna, R. 1998, ApJ, 503, L35
- e.g., Loeb and Waxman (2000) Loeb, A., and Waxman, E. 2000, Nature, 405, 156
- Loveday et al. (1992) Loveday, J., Peterson, B. A., Efstathiou, G., and Maddox, S. J. 1992, ApJ, 390, 338
- Lutz et al. (1996) Lutz, D., et al. 1996, A&A, 315, L137
- Madau et al. (1998) Madau, P., Pozzetti, L., and Dickinson, M. 1998, ApJ, 498, 106
- Mallozzi et al. (1996) Mallozzi, R. S., Pendleton, G. N., and Paciesas, W. S., 1996, ApJ, 471, 636
- Mao and Mo (1998) Mao, S., and Mo, H. J. 1998, A&A, 339, L1
- McBreen and Hanlon (1999) McBreen, B., and Hanlon, L. 1999, A&A, 351, 759
- Mészáros and Rees (1993) Mészáros, P., and Rees, M. J. 1993, ApJ, 405, 278
- Milgrom and Usov (1995) Milgrom, M., and Usov, V. 1995, ApJ, 449, L37
- Milgrom and Usov (1996) Milgrom, M., and Usov, V. 1995, Astroparticle Physics, 4, 365
- e.g., Mirabal et al. (2001) Mirabal, N., Halpern, J. P., Eracleous, M., and Becker, R. H. 2000, ApJ, 547, L137
- Narayan et al. (1992) Narayan, R., Paczyński, B., and Piran, T. 1992,, ApJ, 395, L83
- Odewahn et al. (1998) Odewahn, S. C., et al. 1998, ApJ, 509, L5
- e.g., Owens et al. (1998) Owens, A., et al. 1998, A&A, 339, L37
- Paciesas et al. (1999) Paciesas, W. S. et al. 1999, ApJS, 122, 465
- Panaitescu et al. (1998) Panaitescu, A., Mészáros, P., and Rees, M. J. 1998, Astrophys. J., 503, 314
- Panaitescu and Kumar (2001) Panaitescu, A., and Kumar, P. 2001, ApJ, 554, 667
- Panaitescu and Kumar (2001a) Panaitescu, A. and Kumar, P. 2001, ApJ, 560, L49
- Panaitescu et al. (1999) Panaitescu, A., Spada, M., and Mészáros, P. 1999, ApJ, 522, L105
- Pian (2000) Pian, E. 2000, in Supernovae and Gamma Ray Bursts, ed. M. Livio, K. Sahu, and N. Panagia, in press (astro-ph/9910236)
- Pinkau (1980) Pinkau, K. 1980, A&A, 87, 192
- Piran (1999) Piran, T. 1999, Phys. Rpts., 314, 575
- Piro et al. (2000) Piro, L., et al. 2000, Science, 290, 955
- Pohl and Esposito (1998) Pohl, M., and Esposito, J. A. 1999, ApJ, 507, 32
- Pohl and Schlickeiser (2000) Pohl, M., and Schlickeiser, R. 2000, A&A, 354, 395
- Rachen and Mésázaros (1998) Rachen, J., and Mészáros, P. 1998, Phys. Rev. D, 58, 123005
- Rachen and Mésázaros (1998a) Rachen, J., and Mészáros, P. 1998, in Fourth Huntsville Symposium on Gamma Ray Bursts, ed. C. A. Meegan, R. D. Preece, and T. M. Koshut (AIP: New York), 776
- Rees and Mészáros (1992) Rees, M. J., and Mészáros, P. 1992, MNRAS, 258, 41P
- Reichart (1999) Reichart, D. E. 1999, ApJ, 521, L111
- Romero et al. (1999) Romero, G. E., Benaglia, P., and Torres, D. F. 1999, A&A, 348, 868
- Sari et al. (1998) Sari, R., Piran, T., and Narayan, R. 1998, ApJ, 497, L17
- Scalo and Wheeler (2002) Scalo, J., and Wheeler, J. C. 2002, ApJ, in press (astro-ph/9912564)
- Schaefer (2000) Schaefer, B. E. 2000, ApJ, 532, L21
- Schlickeiser and Dermer (2000) Schlickeiser, R., and Dermer, C. D. 2000, A&A, 360, 789
- Schmidt (1999) Schmidt, M. 1999, ApJ, 523, L117
- Schuster, Pohl, & Schlickeiser (2002) Schuster, C., Pohl, M., & Schlickeiser, R. 2002, A&A, 382, 829.
- Sommers (2002) Sommers, P., oral contribution at Aspen Workshop on UHE Particles from Space (January 27 - February 2, 2002)
- Sreekumar et al. (1998) Sreekumar, P., et al. 1998, ApJ, 494, 523
- Stanev et al. (2000) Stanev, T., Engel, R., Mücke, A., Protheroe, R. J., and Rachen, J. P. 2000, Phys. Rev. D, 62, 093005
- Stecker (1979) Stecker, F. W., 1979, ApJ, 228, 919
- Stecker (2000) Stecker, F. W., 2000, Astroparticle Phys., 14, 207
- Stecker and de Jager (1998) Stecker, F. W., and de Jager, O. C. 1998, A&A, 334, L85
- see also Stecker et al. (1991) Stecker, F. W., Done, C., Salamon, M. H., and Sommers, P. 1991, Phys. Rev. Lett., 66, 2697; (e) 1992, Phys. Rev. Lett., 69, 2738
- Takeda et al. (1998) Takeda, M., et al. 1998, Phys. Rev. Lett., 81, 1163
- Totani (1997) Totani, T. 1997, ApJ, 486, L71
- Totani (1999) Totani, T. 1999, ApJ, 511, 41
- van Paradijs et al. (1997) van Paradijs, J., et al. 1997, Nature, 386, 686
- van Paradijs et al. (2000) van Paradijs, J., Kouveliotou, C., and Wijers, R. A. M. J. 2000, ARA&A, 38, 379
- Vietri (1995) Vietri, M. 1995, ApJ, 453, 883
- Vietri (1997) Vietri, M. 1997, Phys. Rev. Lett., 78, 4328
- Vietri (1998a) Vietri, M. 1998a, Phys. Rev. Lett., 80, 3690
- Vietri (1998b) Vietri, M. 1998b, ApJ, 507, 40
- Waxman (1995) Waxman, E. 1995, Phys. Rev. Lett., 75, 386
- Waxman and Bahcall (1997) Waxman, E., and Bahcall, J. N. 1997, Phys. Rev. Lett., 78, 229
- Waxman and Bahcall (2000) Waxman, E., and Bahcall, J. N. 2000, ApJ, 541, 707
- Waxman and Coppi (1996) Waxman, E., and Coppi, P. 1996, ApJ, 464, L75
- e.g., Weinberg (1972) Weinberg, S., 1972, Gravitation and Cosmology (New York: Wiley), chpt. 14
- Weiler et al. (2000) Weiler, K. W., Panagia, N., Sramek, R. A., van Dyk, S. D., Montes, M. J., and Lacey, C. K. 2000, in Supernovae and Gamma-Ray Bursts, ed. M. Livio, N. Panagia, and K. Sahu, in press (astro-ph/0002501)
- Wijers et al. (1998) Wijers, R. A. M. J., Bloom, J. S., Bagla, J. S., and Natarajan, P. 1998, MNRAS, 294, L13
- Wijers and Galama (1999) Wijers, R. A. M. J., and Galama, T. J. 1999, ApJ, 523, 177
- Yoshida and Teshima (1993) Yoshida, S., and Teshima, M. 1993, Progr. Theor. Phys., 89, 833
| Variable | Quantity | Parameter Set AaaParameter set giving good spectral fits to -ray luminous phase of GRBs | Parameter Set BaaParameter set giving good spectral fits to -ray luminous phase of GRBs |
|---|---|---|---|
| Total EnergyccApparent isotropic energy release (ergs) | |||
| Initial Lorentz factor | 300 | 300 | |
| Electron Energy Transfer Parameter | 0.5 | 0.1 | |
| Magnetic Field Parameter | |||
| Maximum Particle Energy Parameter | 1 | 1 | |
| Density of Surrounding MediumddSurrounding medium is assumed to be uniform density (cm-3) | |||
| Nonthermal Particle Injection Index | 2.2 | 2.2 | |
| Nonthermal Proton Energy Fraction | 0.5 | 0.5 |