X-ray emission from Lindroos binary systems
Abstract
We present a study of the X-ray emission from binary systems extracted from the Lindroos catalogue (Lindroos 1986) based on the ROSAT All-Sky survey as well as ROSAT PSPC and HRI pointings. The studied sample consists of visual binary systems comprised of early-type primaries and late-type secondaries. The ages of the systems were determined by Lindroos (1985) from uvby photometry of the primaries. These ages range between 33 and 135 Myr, so if the late-type secondaries are physically bound to the early-type primaries, they could be Post-T Tauri stars (PTTS).
We have found strong X-ray emission from several secondaries. This fact together with their optical and IR data, make them bona fide PTTS candidates. We have also detected X-ray emission from several early-type primaries and, in particular, from most of the late-B type stars. Because their HRI hardness ratios are similar to those from resolved late-type stars, the presence of an unresolved late-type companion seems to be the cause of this emission.
Key Words.:
stars: binaries – stars: Post-T Tauri – stars: X-rays — stars: individual (HR 4796)1 Introduction
Pre-main sequence (PMS) late-type stars are known to be X-ray sources (see Walter et al. 1988, Bouvier 1990 and Neuhäuser et al. 1995). In the evolution of these stars to the Main Sequence (MS), there is a state usually defined as Post-T Tauri Stars (PTTS). PTTS were first defined by Herbig (1978) as PMS stars more evolved than Classical T Tauri stars (CTTS) but still contracting to the MS. Given that the stage of CTTS is only a small fraction of the total time of contraction of low-mass stars to the MS, PTTS should be much more abundant than CTTS if star formation has been ongoing for a sufficiently long time. However, it is difficult to find PTTS because they do not show spectroscopic or photometric peculiarities which make them easy to detect. Unlike CTTS, they do not present significant IR or UV excesses and the H line is not observed as a strong emission line. Therefore, the identification of these stars is difficult and relies on the detection of the Li I (6708Å) absorption line and the chromospheric Ca II (H & K) lines in their spectra, as well as on their X-ray detection.
Murphy (1969) first proposed that PTTS could be searched as members of young binary systems. The basis of his idea was that the MS lifetime of high-mass stars is comparable to the contraction timescale of solar-type stars. Hence, there could be binary systems comprised of MS early-type stars physically bound to PTTS. Gahm et al. (1983) carried out photometric and spectroscopic observations of visual double stars with early type primaries. The derived data, together with observations, allowed Lindroos (1986; L86 hereafter) to identify 78 likely physical pairs with several PTTS candidates as secondaries.
A high lithium abundance and a high chromospheric activity level are necessary (although not sufficient) indicators of youth. Martín et al. (1992) and Pallavicini et al. (1992) carried out optical spectroscopy of the Lindroos late-type companions, detecting the Li I(6708Å) absorption line and the Ca II (H & K) emission lines in the spectra of several PTTS candidates. Ray et al. (1995) took this sample of “genuine” PTTS and looked for circumstellar matter around them. For this purpose, they analyzed the IRAS database (Point Source Catalogue and Faint Source Catalogue) and also searched for continuum 1.1 mm emission. While IR excesses were found for most of the sources, no mm dust continuum was detected (see also Gahm et al. 1994 and Jewitt 1994).
| HD | Sp.Type1 | Optical position2 | Sep.1 | Distance3 | VA, VB 4 | Av5 | Clas.6 | ||
| RA (2000) | Dec (2000) | (″) | (pc) | (mag) | (mag) | ||||
| (h) (m) (s) | ( °) (′) (″) | ||||||||
| 560 A+B | B9V+G5Ve | 00 10 02.20 | 11 08 44.93 | 7.7 | 1009 | 5.53,10.37 | 0.00 | CP | |
| 1438 A+B | B8V+F3V | 00 18 42.17 | 43 47 28.11 | 6.2 | 21235 | 6.11,9.7∗ | 0.04 | ||
| 8803 A+B | B9V+F6Vp | 01 26 53.55 | 03 32 08.32 | 6.0 | 16025 | 6.43,9.67 | 0.12 | LO | |
| 17543 A+C | B6IV+F8V | 02 49 17.56 | 17 27 51.51 | 25.2 | 18537 | 5.28,10.73 | 0.21 | PP | |
| 23793 A+B | B3V+F3Vp | 03 48 16.27 | 11 08 35.86 | 9.0 | 17331 | 5.10,9.41 | 0.08 | LO | |
| 27638 A+B | B9V+G2V | 04 22 34.94 | 25 37 45.53 | 19.4 | 828 | 5.41,8.43 | 0.00 | PP | |
| 33802 A+B | B8V+G8Ve | 05 12 17.90 | -11 52 09.19 | 12.7 | 744 | 4.47,9.92 | 0.01 | CP | |
| 35007 A+C | B3V+G3V | 05 21 31.84 | -00 24 59.36 | 37.6 | 33089 | 5.68,11.88 | 0.16 | ||
| 36013 A+B | B2V+F9V | 05 28 45.28 | 01 38 38.17 | 25.0 | 30386 | 6.89,12.49 | 0.04 | ||
| 36151 A+B | B5V+G1V | 05 29 25.4 | -07 15 39.18 | 48.6 | 370122 | 6.69,10.60 | 0.08 | ||
| 36151 A+X | B5V+G7V | 05 29 25.4 | -07 15 39.18 | 45.0 | 370122 | 6.69,11.98 | 0.08 | ||
| 36779 A+B | B2.5V+K5IV | 05 34 03.89 | -01 02 08.61 | 27.5 | 380378: | 6.24,11.20 | 0.10 | LO | |
| 38622 A+C | B2V+G2V | 05 47 42.91 | 13 53 58.56 | 24.9 | 24554 | 5.27,12.01 | 0.04 | CP | |
| 40494 A+B | B3IV+G8V | 05 57 32.21 | -35 16 59.80 | 33.8 | 26338 | 4.36,12.66 | 0.00 | PP | |
| 43286 A+B | B5IV+G3V | 06 15 30.24 | 03 57 29.50 | 18.3 | 30885 | 6.99,12.38 | 0.06 | ||
| 48425 A+C | B3V+G5V | 06 42 27.57 | -23 13 57.29 | 34.9 | 368122 | 6.9,10.4∗ | 0.00 | ||
| 53191 A+B | A0V+G3V | 07 00 16.73 | -60 51 45.83 | 17.0 | 20725 | 7.74,11.75 | 0.05 | PP | |
| 53755 A+B | B0.5IV+F5III | 07 05 49.64 | -10 39 36.28 | 6.2 | 1087: | 6.49,10.3∗ | 0.65 | ||
| 56504 A+B | B9IV+G6III | 07 16 00.27 | -29 29 33.81 | 31.1 | 932+ | 9.8,9.7∗ | 0.07 | ||
| 60102 A+B | B9.5V+G8V | 07 11 38.41 | -84 28 09.77 | 16.4 | 20625 | 7.54,11.86 | 0.22 | PP | |
| 63465 A+B | B2.5III+F2V | 07 47 24.99 | -38 30 40.12 | 10.9 | 38080 | 5.08,11.13 | 0.25 | LO | |
| 70309 A+B | B3IV+K2IV | 08 19 05.58 | -48 11 52.27 | 42.5 | 25236 | 6.45,11.28 | 0.12 | LO | |
| 71510 A+C | B3V+G3V | 08 25 31.32 | -51 43 38.69 | 34.9 | 20721 | 5.19,10.77 | 0.01 | LO | |
| 74146 A+B | B5V+F0IV | 08 39 57.59 | -53 03 17.03 | 16.6 | 1318 | 5.19,8.66∗ | 0.03 | ||
| 76566 A+B | B3V+G4V | 08 55 19.20 | -45 02 30.01 | 35.0 | 28651 | 6.28,12.64 | 0.00 | LO | |
| 77484 A+B | B9.5V+G5V | 09 02 50.65 | 00 24 29.54 | 4.4 | 25064 | 8.02,12.0 | 0.09 | PP | |
| 86388 A+B | B9V+F5V | 09 55 05.60 | -69 11 20.31 | 9.2 | 17721 | 6.87,9.98 | 0.02 | LO | |
| 87901 A+B | B8V+K0Ve | 10 08 22.31 | 11 58 01.94 | 176.9 | 23.70.4 | 1.35,8.08 | 0.00 | LO | |
| 90972 A+B | B9.5V+F9Ve | 10 29 35.38 | -30 36 25.43 | 11.0 | 14716 | 5.58,9.65 | 0.03 | CP | |
| 104901 A+B | B9II+F0IIe | 12 04 46.98 | -61 59 48.60 | 23.0 | 980: | 7.43,8.01∗ | 1.11 | ||
| 106983 A+B | B2.5V+ G8III | 12 18 26.24 | -64 00 11.05 | 33.8 | 1106 | 4.05,12.49 | LO | ||
| 108767 A+B | B9.5V+K2Ve | 12 29 51.85 | -16 30 55.56 | 24.2 | 279 | 2.94,8.43 | 0.00 | CP | |
| 109573 A+B | A0+M2.5 | 12 36 01.3 | -39 52 09.00 | 7.6 | 673 | 5.78,13.3 | 0.00 | ||
| 112244 A+B | O9Iab+K0III | 12 55 57.13 | -56 50 08.90 | 29.1 | 578213 | 5.38,11.77 | 0.90 | LO | |
| 112413 A+B | A0IIIp+F0V | 12 56 01.67 | 38 19 06.17 | 19.6 | 341 | 2.90,5.60∗ | 0.00 | ||
| 113703 A+B | B4V+K0Ve | 13 06 16.70 | -48 27 47.84 | 11.4 | 12712 | 4.72,10.8 | 0.00 | CP | |
| 113791 A+B | B2III+F7V | 13 06 54.64 | -49 54 22.49 | 25.1 | 12613 | 4.25,9.38 | CP | ||
| 120641 A+B | B8V+F0Vp | 13 52 02.98 | -52 48 05.81 | 18.0 | 333: | 7.47∗,-7 | 0.00 | ||
| 123445 A+B | B9V+K2V | 14 08 51.89 | -43 28 14.80 | 28.6 | 21837 | 6.19,12.52 | 0.12 | LO | |
| 127304 A+B | A0V+K1V | 14 29 49.67 | 31 47 28.28 | 25.8 | 1068 | 6.07,11.37 | 0.04 | PP | |
| 127971 A+B | B7V+K0V | 14 35 31.48 | -41 31 02.77 | 26.9 | 1099 | 5.89,11.22 | 0.08 | LO | |
| 129791 A+B | B9.5V+K5Ve | 14 45 56.2 | -44 52 03.08 | 35.3 | 12916 | 6.94,12.93 | 0.26 | CP | |
| 137387 A+B | B3IVe+K5IV | 15 31 30.82 | -73 23 22.53 | 27.0 | 31259 | 5.47,11.27 | 0.47 | LO | |
| 138800 A+X | B8IV+KOV | 15 40 21.33 | -73 26 48.07 | 34.0 | 22541 | 5.65,12.86 | 0.22 | LO | |
| 143939 A+B | B9III+K3Ve | 16 04 44.49 | -39 26 04.76 | 8.6 | 16727 | 6.98,11.80 | 0.00 | CP | |
| 145483 A+B | B9V+F3V | 16 12 16.04 | -28 25 02.29 | 4.6 | 918 | 5.67∗,-7 | 0.25 | ||
| 162082 A+B | B7V+F2V | 17 50 18.10 | -26 19 33.87 | 10.7 | 314+ | 8.16,11.05 | 0.63 | LO | |
| 174585 A+B | B2.5V+K2IV | 18 49 45.91 | 32 48 46.15 | 34.8 | 31052 | 5.90,10.89∗ | 0.17 | ||
| 174585 A+C | B2.5V+G0V | 18 49 45.91 | 32 48 46.15 | 58.7 | 31052 | 5.90,10.3∗ | 0.17 | ||
| 180183 A+B | B3V+K05 | 19 18 41.54 | -56 08 40.90 | 19.4 | 24449 | 6.82,11.45 | 0.10 | LO | |
Notes: 1. Taken from Pallavicini et al. (1992); 2. Coordinates of the primary star; 3. Deduced from Hipparcos parallax of the primary star, except those marked with + taken from L86; 4. Adopted from Pallavicini et al. (1992) except those marked with an asterisk obtained from the SIMBAD database; 5. taken from L86; 6. Classification taken by Pallavicini et al. (1992) with respect to the presence of the Lithium absorption line and CaII (H and K) chromospheric lines in the spectrum of the secondary: CP (certainly physical), PP (probably physical) and LO (likely optical); 7. Unknown visual magnitude for the secondary star.
The X-ray emission from Lindroos binary systems was first studied by Schmitt et al. (1993). After the analysis of seven pairs comprised of late B-type stars and later-type companions, the main result was the detection of X-rays from both members of the pair. In the case of late-type stars it is well-known that they produce X-rays in their hot coronae. However, this is not the case of late-B type stars. Theoretically, early-type stars between B4 and A7 are not expected to be X-ray emitters: they do not possess the strong winds thought to be responsible of the X-ray emission in O- and early B-type stars (Lucy & White 1980), nor significant convection zones thought to be necessary to sustain a magnetic dynamo to power a corona. Although the detection of X-rays from late-B and early-A type stars have been reported by several authors (i.e. Caillault & Zoonematkermani 1989, Schmitt et al. 1993, Berghöfer & Schmitt 1994, Berghöfer et al. 1996, Simon et al. 1995, Panzera et al. 1999), there is no clear mechanism that explains the origin of this emission. The most accepted explanation is related to the presence of otherwise unknown unresolved late-type companions of these stars.
The aim of this paper is to study the X-ray emission of all L86 binary systems with PTTS candidates which were observed by ROSAT. For this purpose, we have selected binary systems with late-type stars as secondaries. We will study the X-ray emission from the PTTS candidates as well as the emission from the early-type stars. The characteristics of the sample are described in Sect. 2. Sect. 3 provides the details related to the source detection and identification. The processed X-ray data are analyzed in Sections 4, 5 and 6. The conclusions are drawn in Sect. 7.
2 The binary sample
The Lindroos catalogue (L86) contains 78 binary systems. We have selected those binaries in which the secondary member is a F, G, or K-type star (note that no M-type stars are present in the Lindroos Catalogue). Our final sample consists of 47 systems. Two of them (HD 113791 and HD 106983) were not included in L86 but in Gahm et al. (1983). We have also included the binary system HR 4796 (HD 109573, TWA 11), a possible member of the TW Hya association (see Webb et al. 1999) given that its stellar properties are in agreement with those of the Lindroos sample. This is the only binary system in our sample with an M-type star as a secondary. Note that we have not rejected those pairs that are classified as likely optical pairs by Pallavicini et al. (1992), having in view that the X-ray emission could provide important information related to the nature of these systems.
Stellar properties of our binary sample are shown in Table 1. The name of the source as well as the components of the binary system (A for the primary, B for the secondary and C or X for companions in multiple systems) are shown in column 1. The spectral types of both stars are given in column 2. Column 3 shows the optical position of the primary star while column 4 shows the projected separation between both members. The distance to the primary star, the visual magnitude of both components and the visual extinction to the pair are given in columns 5, 6 and 7. We have also included in column 8 an orientative ‘flag’ which is related to the nature of the binary system: according to the spectroscopic survey carried out by Pallavicini et al. (1992), the systems are classified as LO (likely optical pair), PP (probably physically bound) and CP (certainly physically bound).
3 ROSAT observations and data reduction
The X-ray telescope and the instrumentation onboard the ROSAT satellite are described in detail by Trümper (1983), Pfeffermann et al. (1988) and David et el. (1996). Two main detectors are available: the Position Sensitive Proportional Counter (PSPC), which can be used either in survey or in pointed mode, and the High Resolution Imager (HRI).
We have studied all the available data for our sample, i.e., PSPC (survey and pointed mode) and HRI data. The source detection and identification have been carried out using the source detection routines provided by the Extended Scientific Analysis System (EXSAS; Zimmermann et al. 1997) which are based on a Maximum Likelihood (ML) technique (Cruddace et al. 1988). For all detected X-ray sources we have looked for optical counterparts to check the reliability of the detection. We will briefly describe the data in the following subsections.
3.1 PSPC observations
| HD | X-ray position | 1 | Counts2 | Exp. time | HR1 | HR2 | ML | |
| RA (2000) | Dec (2000) | (″) | (secs.) | |||||
| (h) (m) (s) | (°) (′) (″) | |||||||
| 560 | 00 10 02.73 | 11 08 49.9 | 9.3/15.9 | 115.611.5 | 565.4 | -0.120.10 | 0.110.15 | 239.7 |
| 1438 | 3.24/3.32 | 458.3 | ||||||
| 17543 | 3.41/2.93 | 332.9 | ||||||
| 23793 | 03 48 16.19 | 11 08 48.6 | 12.8/9.8 | 20.35.1 | 371.8 | 0.350.25 | -0.150.29 | 34.5 |
| 33802 | 05 12 17.81 | -11 52 01.8 | 7.5/11.0 | 377.420.0 | 408.0 | -0.060.05 | -0.030.08 | 1124.0 |
| 35007 | 3.26/3.36 | 431.8 | ||||||
| 36151 | 4.64/3.22 | 465.3 | ||||||
| 38622 | 05 47 44.54 | 13 53 15.5 | 49.5/32.1 | 6.0 3.6 | 458.5 | 0.21 | 0.640.42 | 9.4 |
| 40494 | 6.39/5.00 | 674.9 | ||||||
| 43286 | 06 15 26.95 | 03 56 48.8 | 63.8/77.2 | 16.14.9 | 488.9 | -0.030.31 | 0.550.34 | 18.4 |
| 48425 | 3.49/3.41 | 522.9 | ||||||
| 53191 | 5.74/5.14 | 1236.3 | ||||||
| 56504 | 3.80/3.69 | 406.4 | ||||||
| 60102 | 07 11 36.51 | -84 27 00.6 | 69.2/73.4 | 11.44.3 | 345.7 | 0.760.35 | 0.300.33 | 11.4 |
| 63465 | 2.01/2.07 | 75.7 | ||||||
| 74146 | 5.31/5.14 | 720.1 | ||||||
| 77484 | 09 02 48.18 | 00 24 17.1 | 39.0/42.1 | 7.13.5 | 372.4 | -0.970.39 | -0.28 | 6.2 |
| 86388 | 3.99/4.00 | 391.3 | ||||||
| 87901 | 10 08 12.72 | 12 00 01.8 | 184.8/13.5 | 48.97.8 | 393.6 | -0.370.15 | -0.67 | 78.0 |
| 90972 | 10 29 39.77 | -30 35 57.9 | 63.1/73.8 | 9.84.0 | 132.8 | 0.080.45 | -0.240.50 | 6.7 |
| 104901 | 3.84/4.14 | 361.2 | ||||||
| 106983 | 2.16/2.16 | 82.7 | ||||||
| 108767 | 12 29 52.18 | -16 30 48.0 | 9.0/32.6 | 20.55.5 | 281.3 | -0.240.26 | -0.120.41 | 21.7 |
| 109573 | 12 35 59.5 | -39 52 05.01 | 18.9/17.2 | 43.77.6 | 285.0 | -0.200.17 | 0.350.17 | |
| 112244 | 12 55 54.00 | -56 50 04.9 | 25.9/19.5 | 4.23.0 | 108.5 | 0.46 | 0.470.39 | 7.0 |
| 112413 | 12 56 01.11 | 38 18 56.2 | 11.7/8.3 | 47.48.1 | 519.7 | -0.390.16 | 0.160.30 | 56.7 |
| 113703 | 13 06 18.27 | -48 27 44.3 | 16.0/3.7 | 72.29.1 | 302.7 | 0.070.13 | 0.000.17 | 150.7 |
| 113791 | 13 06 59.79 | -49 54 03.3 | 53.3/33.1 | 12.14.4 | 343.3 | 0.45 | 0.370.33 | 15.7 |
| 127304 | 4.23/2.70 | 592.5 | ||||||
| 127971 | 14 35 31.63 | -41 31 08.0 | 5.6/21.3 | 6.33.7 | 315.0 | 0.26 | -0.060.50 | 6.8 |
| 129791 | 14 45 56.17 | -44 52 12.2 | 18.0/19.8 | 39.06.9 | 327.7 | 0.450.16 | -0.080.21 | 62.4 |
| 137387 | 2.99/3.13 | 248.8 | ||||||
| 138800 | 2.68/2.50 | 227.8 | ||||||
| 143939 | 16 04 44.67 | -39 26 03.0 | 2.8/11.3 | 25.55.9 | 324.4 | -0.210.23 | -0.250.37 | 39.3 |
| 145483 | 16 12 16.52 | -28 25 30.0 | 7.0/19.39 | 60.88.6 | 319.7 | 0.470.13 | 0.090.17 | 104.9 |
| 174585 | 2.96/3.10 | 790.1 | ||||||
| 180183 | 2.47/1.98 | 139.8 | ||||||
Notes:
1. Given the low spatial resolution of the PSPC, we cannot resolve
the two components of the binary system. As a consequence, the
displacement between the detected X-ray source and the
optical positions of the two
components of the system are given. 2. In the case of non-detection,
upper limits are computed at the positions of both components, A and
B, respectively.
| HD | ROR | X-ray position | Offaxis | Counts | Exp. time | HR1 | HR2 | ML | ||
|---|---|---|---|---|---|---|---|---|---|---|
| number | RA (2000) | Dec (2000) | (″) | (′) | (secs.) | |||||
| (h) (m) (s) | (°) (′) (″) | |||||||||
| 560 | 700503p | 00 10 02.48 | 11 08 41.2 | 5.6/6.8 | 12.32 | 1993.245.3 | 8238.3 | -0.040.02 | 0.050.03 | 7713.6 |
| ” | 701092p | 00 10 02.47 | 11 08 40.4 | 6.1/6.0 | 12.31 | 4258.365.7 | 8121.8 | -0.080.02 | 0.120.02 | 18859.8 |
| 741461 | 200501p | 18.60 | 69.6/59.7 | 17319.4 | ||||||
| 1049012 | 201271 | 4.94 | 16.2/3.94 | 8491.6 | ||||||
| 143939 | 200738p | 16 04 44.66 | -39 26 16.4 | 12.0/13.1 | 7.61 | 108.010.6 | 1686.6 | -0.130.10 | 0.090.14 | 334.2 |
Notes: 1. The source is very close to the support structure of the telescope, so we are not sure about the reliability of the upper limit; 2. This source has two PSPC observations: 201271p and 201271p-1. There are no detections in the individual observations, so we have added up both files to improve the S/N ratio.
The ROSAT All-Sky Survey (RASS) was performed with the PSPC. The diameter of the field of view is 2° and each object is observed up to times separated by minutes, with up to 30 sec per scan.
The spectral
resolution of the PSPC (43%
at 0.93 keV) allows spectral analysis in three energy bands:
- Soft = 0.1 to 0.4 keV
- Hard 1 = 0.5 to 0.9 keV
- Hard 2 = 0.9 to 2.0 keV
While in some pointed observations the signal to noise are
large enough to carry out detailed spectral analysis,
this is not possible for RASS data. Note that the
RASS exposure times of our sample range from 75 sec to 1236 sec.
However, we can obtain spectral information
of our sources studying the X-ray hardness ratios (HR)
defined as follows:
| (1) |
where H1 and H2 are the counts observed in the Hard 1 and Hard 2 bands, and S are the counts observed in the Soft band. Hence, HR values can range from to . If no counts are detected in one of the bands only an upper or lower limit to HR1 and HR2 is available. Neither HR values nor limits are available for undetected stars.
The nominal positional accuracy of the ROSAT PSPC detector in pointing mode is 25″ at 1 keV (note that it is energy and off-axis angle dependent). However, this accuracy is reduced to 1′ in the survey phase. If the offset between the X-ray source and the optical position exceeds the spatial resolution of the RASS data ( 1′), the identification of the X-ray source with the optical counterpart is doubtful. Hence, for all the RASS observations we have to select a maximal displacement between the X-ray and the optical position within which the detections are reliable. Following Neuhäuser et al. (1995), we have taken a value of 40″ as the maximal distance between the X-ray detection and the optical counterpart.
The RASS data (detections and upper limits) of our sample are shown in Table 2. The name of the source and the position of the X-ray detection are given in columns 1 and 2. As mentioned before, the spatial resolution of the PSPC is too low to resolve most of the binary systems. In fact, in most of the cases we have only obtained a single detection displaced from both components of the system. Hence, we show in column 3 the displacements of the X-ray detection with respect to the optical positions of both members of the binary system. There is only one system in which the projected separation is so large that the X-ray emission can be clearly attributed to the secondary star: HD 87901. The total number of counts in the broad band, the exposure time and the hardness ratios HR1 and HR2 are given in columns 4, 5, 6 and 7. In the case of non-detections we have computed the number of counts at the position of both components, A and B, respectively. An estimate of the probability of the detection by the ML procedure is given in the last column; a value of ML=5 corresponds to a 2.7 signal over the background. Note that 11 sources listed in Table 1 do not appear in Table 2. Most of them (HD 8803, HD 27638, HD 36013, HD 36779, HD 53755, HD 71510, HD 123445 and HD 162082) are not detected and are located so close to another X-ray sources that a computation of an upper limit is not possible. Two of them (HD 70309, HD 76566 and HD 120641) show bad quality exposure maps so no X-ray data can be derived.
The same information as in Table 2 is given in Table 3 for PSPC pointed observations. Only four of our binary systems were observed in PSPC pointings, with just two of them detected. Columns 1 and 2 provide the name of the system and the ROSAT Observation Request (ROR) number. The coordinates of the X-ray detection are given in column 3. As in the case of the RASS data, the spatial resolution is not high enough to detect both components of the binary systems. As a consequence, we show the displacement of the X-ray source with respect to both components of the binary system in column 4. Column 5 shows the displacement of the source with respect to the center of the image (off-axis angle). Note that the sensitivity of the detector degrades with increasing off-axis angle. The total number of counts, the exposure time and the hardness ratios, HR1 and HR2, are given in columns 6, 7, 8 and 9. The ML coefficient is provided in the last column.
| HD | ROR | Comp. | X-ray position1 | Offaxis | Counts | Exp. time | HR | ML | ||
|---|---|---|---|---|---|---|---|---|---|---|
| number | RA (2000) | Dec (2000) | (″) | (′) | (secs.) | |||||
| (h) (m) (s) | (°) (′) (″) | |||||||||
| 560 | 201678h | e∗ A+B | 00 10 02.39 | 11 08 40.0 | 5.7/5.0 | 0.33 | 105.610.4 | 1531.7 | -0.200.10 | 304.3 |
| 201987h | A+B | 00 10 02.67 | 11 08 37.5 | 10.1/7.1 | 0.38 | 118.911.0 | 2373.5 | 0.580.07 | 505.7 | |
| 1438 | 201154h,h-1 | A+B | 13.51 | 5443.5 | ||||||
| 17543 | 201331h | A | 02 49 17.63 | 17 27 47.9 | 3.8 | 0.29 | 10.43.5 | 5770.1 | -0.46 | 16.2 |
| ” | C | 02 49 19.34 | 17 27 40.6 | 5.4 | 0.61 | 31.05.8 | 5767.9 | 0.340.15 | 75.1 | |
| 27638s | 200187 | A | 4.26 | 3881.6 | ||||||
| ” | B | 2.03 | 2312.9 | |||||||
| 338022,s | 200185h | e A | 05 12 17.95 | -11 52 05.4 | 3.8 | 0.30 | 608.722.9 | 2349.8 | 2500.5 | |
| ” | e B | 05 12 17.55 | -11 51 56.5 | 4.5 | 0.32 | 77.88.8 | 2350.1 | 352.6 | ||
| 38622 | 201333h | A | 05 47 42.63 | 13 53 56.2 | 4.5 | 0.16 | 15.14.0 | 4139.7 | -0.43 | 33.8 |
| ” | C | 05 47 42.55 | 13 53 31.9 | 2.1 | 0.50 | 10.93.5 | 4139.0 | 0.54 | 21.3 | |
| 40494 | 201685h | A | 05 57 32.14 | -35 16 59.6 | 0.8 | 0.28 | 32.75.9 | 4539.2 | -0.78 | 89.4 |
| ” | B | 1.59 | 4535.3.8 | |||||||
| 531913 | 201684h | B | 07 00 14.53 | -60 51 54.4 | 0.7 | 0.41 | 5.9 2.6 | 4813.5 | 7.9 | |
| 601023 | 201328h | B | 07 11 27.90 | -84 28 10.3 | 2.6 | 0.25 | 28.65.4 | 2316.0 | 0.450.17 | 101.8 |
| 741464 | 201447h | A | 08 39 57.41 | -53 03 15.3 | 2.5 | 16.02 | 172.419.0 | 50034.5 | -0.68 | 69.9 |
| 201682h | A | 08 39 57.78 | -53 03 15.2 | 2.5 | 0.25 | 10.33.3 | 4680.5 | -0.400.11 | 24.1 | |
| 863883 | 201683h | A+B?,B | 09 55 04.26 | -69 11 28.0 | 11.4/6.4 | 0.08 | 31.36.1 | 2200.6 | -0.040.19 | 51.4 |
| 87901 | 800807h | A | 10 08 22.37 | 11 58 05.8 | 4.0 | 11.59 | 173.413.6 | 2781.5 | -0.34 0.07 | 460.0 |
| “ | B | 10 08 12.73 | 11 59 50.7 | 2.8 | 14.32 | 43.27.6 | 2712.7 | 0.420.16 | 44.6 | |
| 800807h-1 | A | 10 08 22.53 | 11 58 02.2 | 3.3 | 11.52 | 1221.535.5 | 18262.3 | -0.030.03 | 3795.3 | |
| ” | B | 10 08 12.95 | 11 59 47.8 | 1.9 | 14.25 | 357.820.8 | 17774.6 | 0.690.04 | 506.1 | |
| 800880h | A | 10 08 22.10 | 11 58 08.5 | 7.2 | 12.47 | 4565.869.0 | 60144.2 | -0.360.01 | 9914.8 | |
| ” | B | 10 08 12.64 | 11 59 55.7 | 7.8 | 15.23 | 1191.138.4 | 5853.6 | 0.410.03 | 1560.7 | |
| 909723,s | 200188h | B | 10 29 34.59 | -30 36 30.4 | 2.0 | 0.32 | 44.46.9 | 4524.8 | 0.210.15 | 120.3 |
| 108767 | 201329h | A | 12 29 52.11 | -16 30 54.3 | 3.9 | 0.34 | 40.36.5 | 3772.6 | -0.470.14 | 114.1 |
| ” | B | 12 29 51.07 | -16 31 14.2 | 2.5 | 0.42 | 102.310.2 | 3775.6 | 0.600.08 | 384.0 | |
| 201679h | A | 12 29 52.03 | -16 30 54.7 | 2.7 | 0.35 | 43.76.7 | 4277.6 | -0.210.15 | 135.2 | |
| ” | B | 12 29 50.97 | -16 31 14.4 | 1.1 | 0.45 | 91.79.8 | 4279.1 | 0.620.08 | 278.4 | |
| 201991h | A | 12 29 51.70 | -16 30 53.3 | 3.1 | 0.39 | 24.85.1 | 2432.4 | -0.340.20 | 60.8 | |
| ” | B | 12 29 50.67 | -16 31 13.6 | 3.6 | 0.81 | 40.56.5 | 2431.8 | 0.55 0.13 | 104.3 | |
| 201991h-1 | A | 12 29 51.95 | -16 30 53.7 | 2.3 | 0.36 | 40.86.7 | 4218.0 | 0.01 | 68.5 | |
| ” | B | 12 29 51.10 | -16 31 13.4 | 3.2 | 0.75 | 113.610.8 | 4218.3 | 0.520.08 | 336.3 | |
| 109573 | 702764h | e A+B,B? | 12 35 56.35 | -39 50 15.5 | 7.1/4.7 | 2.69 | 942.431.1 | 40293.9 | 0.550.03 | 3439.0 |
| 1137033,s | 150034h | e A+B,B? | 13 06 18.39 | -48 27 45.2 | 17.0/5.0 | 0.30 | 106.59.1 | 3042.1 | 0.010.09 | 412.4 |
| 113791 | 201680h | A | 13 06 54.9 | -49 54 22.7 | 2.6 | 0.23 | 107.510.5 | 6102.4 | -0.070.10 | 358.2 |
| ” | B | 13 06 57.37 | -49 54 27.3 | 2.9 | 0.38 | 68.58.5 | 6101.9 | 0.690.09 | 173.6 | |
| 123445 | 200183h | A | 14 08 52.24 | -43 28 09.5 | 6.6 | 0.11 | 50.367.2 | 4100.6 | 0.190.14 | 161.1 |
| ” | B | 4099.0 | ||||||||
| 127304 | 201681h | A | 4.48 | 5158.0 | ||||||
| 201681h | B | 14 29 48.08 | 31 47 22.3 | 5.4 | 0.50 | 5.72.7 | 5158.4 | 7.7 | ||
| 127971s | 200182h | A | 14 35 31.30 | -41 31 05.5 | 3.4 | 0.11 | 44.56.8 | 5420.1 | 0.490.13 | 146.8 |
| ” | B | 1.46 | 12012.1 | |||||||
| 129791s | 200184h | A | 14 45 57.61 | -44 52 05.6 | 2.5 | 0.11 | 163.112.9 | 5063.0 | 0.560.07 | 684.6 |
| ” | B | 14 45 56.21 | -44 52 36.8 | 4.9 | 0.48 | 24.75.1 | 5061.4 | 0.77 | 60.5 | |
| 1439393,s | 200190h | B | 16 04 43.98 | -39 26 14.9 | 5.1 | 0.21 | 168.613.1 | 7841.5 | 0.450.07 | 609.0 |
Notes: 1. If both components are detected, coordinates of both X-ray sources are given. The displacement of the secondary with respect to the detected X-ray source is computed comparing with its optical coordinates; 2. The two stars of the system are not completely resolved so each star is contributing to the count rate of the companion. 3. The undetected component is so close to the X-ray source that no reliable upper limit can be computed; 4. HD74146 has another observation, 200186h, but with very low exposure time (texp = 357.5 s); e for elongated sources; ∗The elongated shape is due to attitude problems in the processed data; s stars previously studied by Schmitt et al. (1993).
3.2 HRI observations
The HRI detector allows high resolution imaging of X-rays sources. The nominal spatial resolution of the detector is 1.7″ but a bore-sight correction as much as 10″ should be applied. The projected separations between the members of our binary systems range from 4.4″ to 177″. Most of them show separations larger than 10″ so, in principle, they can be resolved by the HRI.
The spectral resolution of the HRI is worse than that of the PSPC. However, the HRI pulse height distribution can be used to compute a 2-band (H and S) hardness ratio. We have defined the HRI hardness ratio as:
| (2) |
To obtain the most realiable S- and H-band definitions, several ROSAT sources known from their PSPC pointed observations to be either extremely soft (HR1 -0.8) or extremely hard (HR1 +0.8) were selected (20). For these sources the HRI hardness ratios were calculated according to Eq. (2) for the following different soft and hard band definitions: S1 = 0-5, H1 = 6-15; S2 = 0-4, H2 = 5-15; S3 = 0-3, H3 = 4-15; and S4 = 0-2, H4 = 3-15, where the numbers give the corresponding HRI energy channels. For each of the corresponding four HRI hardness ratios the mean difference to the PSPC hardness ratios (HR1), was computed. The HRI bands for which the selected sources show the smallest deviation to the PSPC hardness ratio were S3,H3. Therefore, the HRI bands are defined as the soft band (S-band) corresponding to channels 0 to 3 (E 0.3 keV) and the hard band (H-band) corresponding to channels 4 to 15 (E 0.3 keV). This HRI hardness ratio shows a smaller dynamical range than the PSPC hardness ratio, HR1, but clearly identifies soft sources with negative values and hard sources with positive values. For more details, see Supper et al. (in prep.).
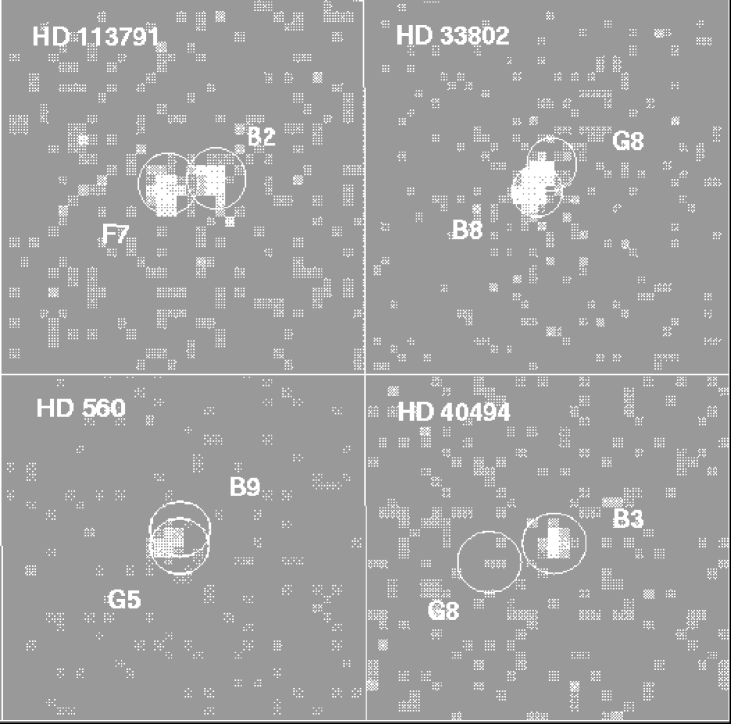
Table 4 shows the HRI detections of Lindroos binaries. Most of the HRI pointed observations were carried out by one of us (HZ) as Principle Investigator (PI). Columns 1 to 3 give the name of the source, the ROR number, and the component of the system detected: A+B when both stars are not resolved and there is only a single detection, and A or B (or C or X for secondaries in multiple systems) when the members of the binary system have been resolved. We have also added an ’e’ to designate the elongated sources. The position of the X-ray sources are shown in column 4. Column 5 shows the difference between the optical and X-ray position. Note that the optical coordinates used as a reference for the B-components are those of the secondaries (taken from SIMBAD database). Column 6 shows the displacement of the sources with respect to the axis of the telescope. Finally, the total counts in the broad band, the exposure time, the hardness ratio and the ML coefficient are given in columns 7, 8, 9 and 10. The upper limits of the undetected sources are also shown.
Table 4 includes three binary systems (HD 86388, HD 109573 and HD 113703) for which it is not clear which of the two members of the system is responsible for the X-ray emission. After the comparison of the optical and the X-ray position, we believe that the late-type companion is most likely the X-ray emitter in the three cases. This is clearer for the HD 86388 system because the X-ray detection is not elongated and it is closer to the optical position of the secondary. In the case of HD 109573 and HD 113703 the X-ray detections in the broad band are slightly elongated although much closer to the optical position of the secondary star (see Table 4). Hence, we will assume that the X-ray emission comes from the late-type secondaries in the three cases under study.
In order to illustrate different observations of the Lindroos binary systems, we have shown in Fig. 1 several HRI images of different pairs.
| HD | Comp. | Det. | ||
|---|---|---|---|---|
| (cm-2) | (erg/s) | |||
| 560 | A+B | 19.74 | H | 30.5629.41∗ |
| 1438 | A+B | ” | H | 29.79 |
| 17543 | A | 20.57 | H | 29.6429.16 |
| 17543 | B | ” | H | 30.1729.44 |
| 23793 | A+B | 20.15 | R | 30.2529.65 |
| 27638 | A | 18.00 | H | 28.56 |
| 27638 | B | ” | H | 28.49 |
| 33802 | A | 19.25 | H | 30.8929.47 |
| 33802 | B | ” | H | 30.0329.06 |
| 35007 | A,B | 20.46 | R | 29.5,29.98 |
| 36151 | A,B | 20.16 | R | 30.14,30.00 |
| 38622 | A | 19.85 | H | 30.0829.48 |
| 38622 | B | ” | H | 29.9929.48 |
| 40494 | A | 18.00 | H | 30.3929.64 |
| 40494 | B | ” | H | 28.57 |
| 43286 | A+B | 20.03 | R | 30.5230.01 |
| 48425 | A,B | 18.00 | R | 29.94,29.98 |
| 53191 | B | 19.95 | H | 29.5329.15 |
| 56504 | A,B | 20.09 | R | 30.92,30.93 |
| 60102 | B | 20.59 | H | 30.6229.89 |
| 63465 | A,B | 20.65 | R | 30.61,30.65 |
| 74146 | A | 19.73 | H | 29.4228.57∗ |
| 77484 | A+B | 20.20 | R | 30.1129.81 |
| 86388 | B: | 19.55 | H | 29.4228.75 |
| 87901 | A | 18.082 | H | 27.7326.15∗ |
| 87901 | B | ” | H | 28.7627.50∗ |
| 90972 | B | 19.73 | H | 30.1129.29 |
| 104901 | A+B | 21.29 | P | 30.32 |
| 106953 | A+B | 18.00 | R | 29.48,29.53 |
| 108767 | A | 18.383 | H | 28.5827.45∗ |
| 108767 | B | ” | H | 28.9527.69∗ |
| 109573 | B | 18.00 | H | 29.7528.26 |
| 112244 | A+B | 21.20 | R | 31.1831.01 |
| 112413 | A+B | 18.112 | R | 29.0428.27 |
| 113703 | B | 20.24 | H | 30.5729.51 |
| 113791 | A | 18.00 | H | 30.1429.13 |
| 113791 | B | ” | H | 29.9829.07 |
| 123445 | A | 20.33 | H | 30.5429.71 |
| 123445 | B | ” | H | 29.21 |
| 127304 | A | 19.85 | H | 28.73 |
| 127304 | B | ” | H | 28.8928.55 |
| 127971 | A | 20.15 | H | 29.7428.91 |
| 127971 | B | ” | H | 27.90 |
| 129791 | A | 20.66 | H | 30.5829.47 |
| 129791 | B | ” | H | 30.6329.52 |
| 137387 | A,B | 20.92 | R | 30.10,30.16 |
| 138800 | A,B | 20.59 | R | 29.81,29.80 |
| 143939 | B | 18.00 | H | 30.5029.40 |
| 145483 | A+B | 20.65 | R | 30.2629.41 |
| 174585 | A+B | 20.48 | R | 29.59,29.63 |
| 180183 | A+B | 20.25 | R | 30.03,29.96 |
Notes: 1. Adopted from Berghöfer et al. (1996); 2. Adopted from Fruscione et al. (1994); ∗Mean X-ray luminosities computed from several observations.
3.3 X-ray fluxes and luminosities
The X-rays fluxes can be computed by multiplying the observed count rates by an energy conversion factor (ECF). The ECF depends on the detector response and the underlying model for the X-ray spectrum. In the case of our sample we have assumed a 1-T Raymond-Smith thermal spectrum (Raymond & Smith 1977), which implies that the ECF mainly depends on the temperature of the emitting plasma and the interstellar absorption. The assumed temperature for the late-type stars is (with Boltzmann’s constant) which is suitable for active late-type stars such as TTS (see Neuhäuser et al. 1995). In the case of the B-type stars we have adopted a mean value of (see Berghöfer & Schmitt 1994 and Berghöfer et al. 1996).
In order to correct for the interstellar absorption, we have converted the visual extinction to our sources into hydrogen column densities, , following Paresce (1984):
| (3) |
For those cases for which no is available, we have adopted a lower limit of log .
The PSPC ECF for different temperatures and interstellar absorption column densities are provided by Neuhäuser et al. (1995) for late-type stars, and by Berghöfer et al. (1996) for early-type stars. In the case of the HRI observations, we have computed the ECF’s following the Technical Appendix to the ROSAT Call for proposals.
Once we obtain the X-ray fluxes, the X-ray luminosities are given by
| (4) |
with being the distance to the star. We have made use of the Hipparcos parallaxes of the primary stars to estimate the distances to our sources (see Table 1).

The X-ray fluxes and luminosities for the whole sample are given in Table 5. The HD number and the binary component (A, B, C or X) are shown in columns 1 and 2. Column 3 provides the computed hydrogen column density. The type of observation, R for RASS, P for PSPC and H for HRI, is given in column 4. The X-ray luminosities with their respective errors and the upper limits for non-detections are finally listed in the last column. If the binary system is observed and resolved by the HRI, we provide the fluxes and luminosities for both members of the pair. If unresolved, we just can provide one X-ray luminosity associated with the pair. In these cases we have adopted a temperature of 1 to compute the ECF’s although, in principle, both stars could be contributing to the total emission. The last method has also been applied to those systems with only RASS or PSPC pointed observations, given that they are always unresolved. In the case of RASS or PSPC non-detections, we have estimated two upper limit luminosities, corresponding to the count rates computed at the optical positions of the primary and the secondary star, respectively (see Table 2).
4 Interpretation of the data
The PSPC is not able to resolve most of the binary systems of the sample (the only exception is HD 87901). Therefore, the HRI data are the most appropriate to study the X-ray emission of individual stars in Lindroos systems. We have based the following analysis on the HRI data of resolved pairs. As we will show in Section 5, most of the resolved pairs show evidences of being physically bound. Only two binary systems are definitely optical pairs (HD 123445 and HD 127971), while another two systems are doubtful (HD 40494 and HD 87901).
4.1 X-ray luminosity functions
The X-ray luminosity function (XLF) of a sample can be derived with Kaplan-Meier estimators using the statistical package ASURV (see Feigelson & Nelson 1985, Schmitt, 1985 and Isobe et al. 1986), which allows to take into account both detections and upper limits.
To check whether the two samples of early-type primaries and late-type secondaries are statistically different we have performed a two-sample test with ASURV. We do not include those objects which are either unresolved or whose identification is not clear, namely: HD 560 and HD 1438, HD 33802, HD 109573, HD 113703 and HD 86388. The result of the test is that our samples are statistically similar with a probability of 0.8 (see upper panel of Fig. 2). Given the different spectral types of the stars in the two samples, this conclusion may appear surprising. In order to check this result, we have repeated the statistical analysis after removing those sources that could be contaminating both samples. In the case of the late-type stars we have removed the X-ray upper limits of two probably unbound sources, HD 123445 B, HD 127971 B. In the case of early-type stars we have removed one source with an unreliable X-ray detection ( HD 87901 A, see Sect. 4.2), and three sources for which we found indications of unresolved late-type companions (Sect. 4.3): HD 123445 A, HD 127971 A and HD 129791 A. For this reduced sample, the probability of both groups of stars to be statistically similar is reduced to 0.4 but this value is higher than the threshold (0.05) to reject the null hypothesis of our two samples to be equivalent. (see lower panel of Fig. 2).
Note, however, that the X-ray luminosity alone cannot provide information about the nature of the X-ray emission. This could only be studied through the spectral analysis of the emission or through the hardness ratios (HR’s).
4.2 Hardness ratios
In the case of the HRI observations, we could obtain individual hardness ratios (HR) using the two sets of channels defined in Sect. 3.2. As shown in Table 4, the computed hardness ratios generally differ from early- to late-type stars. In most of the cases, late-type stars show positive HR’s while early-type stars show negative values. This means that late-type stars emit most of their X-ray radiation in the H-band, which is consistent with the presence of an energetic corona, while early-type stars mainly emit in the S-band. In fact, there are several stars which are only detected in one of these bands, showing upper or lower limits to the HR’s. However, there are some stars which do not follow this trend: HD 87901A, HD 123445A, HD 127971A and HD 129791A, all of which are early-type stars so they are not supposed to have an energetic corona which could explain their positive HR’s.
| HD | U | S-rate | UV-rate | (S/UV) | ) |
|---|---|---|---|---|---|
| (mag) | (cts/ks) | (cts/ks) | |||
| 17543 | 4.69 | 1.81 | 0.24 | 7.54 | -6.8 |
| 38622 | 4.46 | 3.71 | 0.32 | 4.46 | -7.0 |
| 40494 | 3.52 | 7.26 | 1.06 | 6.48 | -6.9 |
| 74146 | 4.48 | 2.86 | 0.32 | 8.93 | -6.8 |
| 87901 | 0.88 | 68.35 | 30.87 | 2.21 | -8.3 |
| 108767 | 2.81 | 7.89 | 2.62 | 3.01 | -6.8 |
| 113791 | 3.28 | 17.59 | 1.43 | 12.30 | -6.6 |
| 123445∗ | 6.02 | 12.4 | 0.09 | 286.11 | -5.4 |
| 127971∗ | 5.39 | 7.90 | 0.04 | 81.48 | -5.9 |
| 129791∗ | 6.84 | 31.44 | 0.01 | 2069.78 | -4.6 |
Notes: ∗ No U-magnitudes available. We derived them from their spectral types and their V-magnitudes, according to Kenyon & Hartmann (1995).
Berghöfer et al. (1999) has shown that the HRI detector is sensitive to ultraviolet (UV) radiation below 4000Å. The contamination of the UV light to the final count rate is mainly concentrated to pulse height channels 1-3 ( our S-band range). Our primary stars are bright sources in the UV range so, in principle, the computed S-band rate could be just a response of the detector to the UV light. In order to check the reliability of the S-band counts for the early-type stars, we have estimated the contribution of the photospheric UV light to the total S-band rate. Following Berghöfer et al. (1999):
| (5) |
with U being the U-magnitudes of the observed stars. This equation was deduced considering the emission of the sources from channels 1 to 8 of the HRI detector. In order to be conservative, we have also computed the S-band rates in these channels. Table 6 shows the results. Column 1 provides the name of the star. The U-magnitudes, taken from The Bright Star Catalogue (Hoffleit & Jaschek 1991) are shown in column 2. For three sources U-magnitudes are not available, so we deduced them from their spectral types and V-magnitudes following Kenyon & Hartmann (1995). The S-band rate and the UV rate, both computed in channels 1-8 of the detector, are shown in columns 3 and 4, while their ratio is provided column 5. We finally show the derived ratio in the last column, in order to check the reliability of the X-ray detections. The bolometric luminosities have been computed using the stellar data provided in Table 1 and the bolometric corrections from Schmidt-Kaler (1982).
As we can see from Table 6, most of the B-type stars of our sample have S-band rates significantly higher than the estimated UV-rates. There is only one source for which both values are comparable: HD 87901A. Note that the HRI observations of this star show very large off-axis values and, according to Berghöfer et al. (1999), Eq. (1) is not reliable for these cases. However, this system was resolved by the PSPC in the RASS survey (see Tab. 2) and, as we mentioned in Sect. 3, no emission was detected from the early-type star but from the secondary.
To further test the reliability of the S-band emission in early-type stars, we have also studied the ratio of these stars to see if it is consistent with the ratio for stars of similar spectral types. According to Table 6, most of the stars show ratios consistent with the reported values for early-type stars (Berghöfer et al. 1997). There are also four stars with unusual ratios: HD 87901 with a lower ratio, and HD 123445, HD 127971 and HD 129791, with ratios closer to those found in late-type stars. Given that these three early-type stars also show positive HR, it is possible that they have unresolved late-type companions. However, in the case of HD 87901 the HR is negative and the is lower than in late-type stars, so the X-ray emission can not be related with an unresolved source. This fact together with its non-detection in the RASS make us think that this emission is due to the HRI UV leak. Therefore, excluding HD 87901 A, we can identify the computed S-band rates with intrinsic X-ray emission from the sources.
The previous test allows to confirm the reliability of the computed HRI HR’s. Given that these HR’s are systematically positive for late-type stars and systematically negative for early-type stars, we can conclude that the nature of the X-ray emission is intrinsically different for our two samples. We will discuss this point more deeply in the following subsection.

4.3 X-ray luminosities
The analysis of the HR’s suggests that the nature of the X-ray emission is different for our two samples. A useful way to represent this difference consists of comparing the X-ray luminosities obtained in the two HRI bands, S and H, for all of our detected sources. Fig. 3 shows this comparison. Note that we have converted the S- and H-band rates into luminosities following the procedure described in Sect. 3.3. We have not included HD 33802 because the binary is not completely resolved and it is difficult to obtain reliable measurements from the individual members (see Fig. 1).
As can be seen from Fig. 3, there is a clear separation between early- and late-type stars. Early-type stars are generally softer than the late-type companions. This result is in agreement with that obtained from the HR’s analysis. Note that although most of the early-type stars lie below the 1:1 correlation line, there are three early-type primaries with higher X-ray luminosities in the H-band than in the S-band: HD 123445 A, HD 127971 A and HD 129791 A. As we explained before, the higher H-band luminosities obtained for the later-type stars are in agreement with their condition of active stars (note that all are located above or on the 1:1 correlation line). In contrast, the higher H-band luminosities for the early type stars are not easy to explain, given that these stars are not supposed to have a convective zone able to support a corona. Because these stars lie in the same part of the diagram as the late-type secondaries, the simplest explanation is to relate them to unresolved late-type companions.

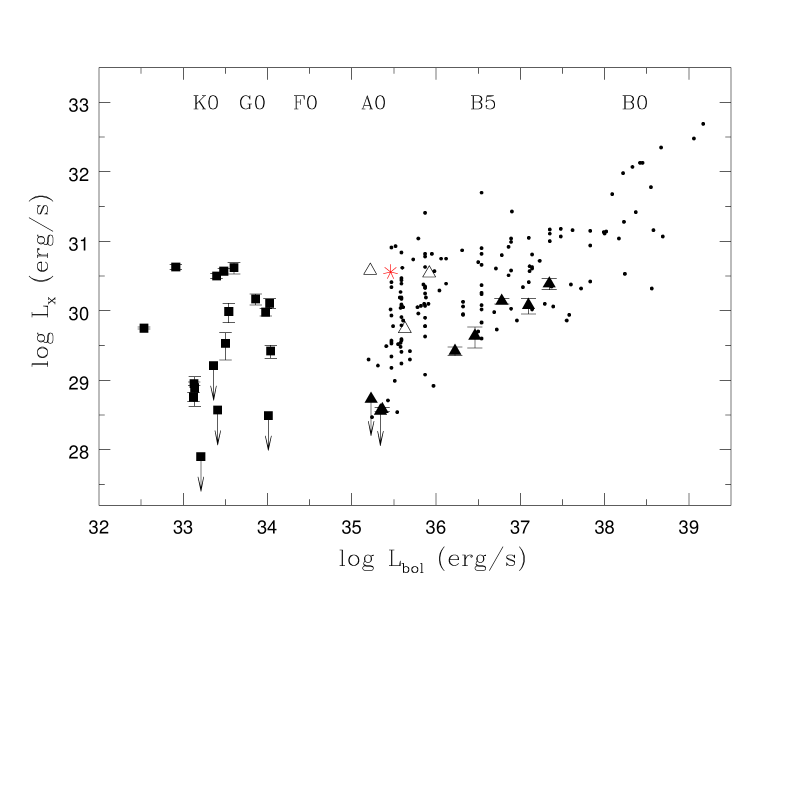
After the analysis of the X-ray luminosities in the two bands, we have studied the total X-ray luminosities of the whole sample. Given that the X-ray emission typically assumes a particular value for each spectral type, we have plotted the X-ray luminosity against the bolometric luminosity for each star. The bolometric corrections were adopted from Schmidt-Kaler (1982). Only in the case of the M-type star, HD 109573 B (HR4796 B), the bolometric correction was taken from Kenyon & Hartmann (1995).
As shown in Fig. 4, there is a clear separation between late- and early-type stars. Late-type stars lie in the region of with X-ray luminosities varying between 27.5 and 31. On the other hand, the early-type primaries show lower X-ray luminosities that decrease from B1 to A0 spectral types. However, the three late-B type stars which clearly deviate in Fig. 3 also deviate in this figure, showing a higher X-ray emission than expected for their spectral types: B9, B7 and B9.5.
We have compared these results with those previously obtained by Schmitt et al. (1993). The X-ray luminosities derived for their sample of 7 Lindroos systems agree with our results except in one case: HD 113703. While these authors identify the single HRI X-ray detection with the early-type primary, we think it is most probably related to the late-type secondary. As we discussed in Sect. 3, the difference between the X-ray detection and the optical position is smaller for the late-type secondary in both the broad and hard band images.
At this point we must also remark that the young star HD 109573 B (HR4796 B) shows an X-ray luminosity higher than that reported by Jura et al. (1998). These authors compute the X-ray luminosity from the same HRI image but using an ECF that corresponds to the PSPC detector, although these detectors have different sensitivities. Moreover, they take a mean ECF from Neuhäuser et al. (1995) which is deduced from a ROSAT survey on Taurus, a star forming region where most of the stars show visual extinctions larger than those in TWA. Therefore, we think that the value listed in Table 5 is more realistic since it takes into account the ECF from the HRI detector and a negligible absorption to the source.
One of our binary systems, HD 560, was detected but unresolved by the ROSAT HRI (see Fig. 1). Because this system is comprised of a B9 primary and a G5 type companion, we have made a simple test to confirm the results obtained for HD 123445 A, HD 127971 A and HD 129791 A: although we certainly know that HD 560 is a binary system, we have supposed HD 560 to be a single B9 star and not a pair. Therefore, if we assume that the single X-ray detection corresponds to a B9-type star and we plot this source into Fig. 4 (starred symbol), the result is that HD 560 lies in the same part of the diagram as the three sources with unresolved late-type candidates. Hence, this test strengthens the idea of unresolved late-type companions in these late-B type stars.
We have compared our sample of primary stars with a sample of MS B-stars taken from the The RASS catalogue of optically bright OB-type stars (Berghöfer et al., 1996) in Figure 4. In principle, our primary stars are in good agreement with the sample of B-type stars with comparable X-ray luminosities. Note, however, the large scatter in the X-ray values at 35.5 (B9 stars). HD 123445 A, HD 127971 A and HD 129791 A lie in this region of the diagram with X-ray luminosities ranging from to erg/s.
The wide range of X-ray luminosities found in late-B stars from Berghöfer’s sample together with the position of our late-B primary stars in Fig. 4, suggests the possibility of having unresolved late-type companions in late-B type stars with 29.5. Although it is beyond the scope of this paper, it would be interesting to check if the MS late-B type stars from Berghöfer et al. (1996) with highest X-ray luminosities are suspected to have late-type unresolved companions.
As we mentioned before, the ratio is generally similar for stars of the same spectral type. As an example, a “canonical” relation of has been reported for O- and early B-type stars (Harnden et al. 1979, Long & White 1980, Pallavicini et al. 1981, Sciortino et al. 1990). Given that the ratio is characteristic for each spectral type, we have finally compared this value with the HRI HR’s computed in Sect. 4.2.
| HD | Sp.T. | log Lx | EW Li I1 | far-IR data2 | RV3 | Physical companions? | ||||
|---|---|---|---|---|---|---|---|---|---|---|
| F(12m) | F(100m) | X-rays | Li I | IR-ex. | RV | |||||
| (erg/s) | (Å) | (Jy) | (Jy) | |||||||
| 560 B? | G5 | 30.56 | 0.290 | 0.278 | 1.037 | E | + | + | + | + |
| 17543 C | F8 | 30.17 | 0.12 | 0.269 | 1.089 | + | + | + | - | |
| 27638 B | G2 | 28.49 | 0.152 | 0.375 | 2.014 | E | - | + | + | + |
| 33802 B | G8 | 30.03 | 0.318 | 0.508 | 2.718 | E: | + | + | + | (+) |
| 38622 B | G2 | 29.99 | 0.2030.055∗∗ | 0.263 | 3.056 | E | + | + | + | + |
| 40494 B | G8 | 28.57 | 0.2060.013∗ | 0.417 | 0.618 | - | + | + | ? | |
| 53191 B | G3 | 29.53 | 0.2220.015∗ | + | + | ? | ? | |||
| 60102 B | G8 | 30.62 | 0.2520.010∗ | + | + | ? | ? | |||
| 86388 B ? | F5 | 29.42 | 0.0530.004∗ | E | + | + | ? | + | ||
| 87901 B | K0 | 28.76 | 0.017 | E: | + | + | ? | (+) | ||
| 90972 B | F9 | 30.11 | 0.147 | 0.253 | 1.657 | E: | + | + | + | (+) |
| 108767 B | K2 | 28.94 | 0.175 | 2.563 | 0.497 | E | + | + | - | + |
| 109573 B | M2.5 | 29.75 | 0.55∗∗∗ | + | + | ? | ? | |||
| 113703 B? | K0 | 30.57 | 0.367 | 0.296 | 1.555 | E | + | + | + | + |
| 113791 B | F7 | 29.98 | 0.1360.005∗ | 0.452 | 1.581 | E | + | + | + | + |
| 123445 | K2 | 29.21 | 0.04∗ | - | - | ? | ? | |||
| 127304 B | K1 | 28.89 | 0.1040.004∗∗ | 0.153 | 0.379 | E | + | + | - | + |
| 127971 B | K0 | 27.90 | 0.030∗ | - | - | ? | ? | |||
| 129791 B | K5 | 30.63 | 0.230 | ? | ? | + | + | ? | ? | |
| 143939 B | K3 | 30.50 | 0.400 | ? | ? | + | + | ? | ? | |
Notes: 1. Most of the Li I EW values have been adopted Pallavicini et al. (1992). These measurements were derived from high-resolution spectra (resolution of 0.1Å), except those marked with an asterisk, which were obtained from low-resolution spectra (resolution of 2Å; the data marked with a double asterisk are taken from Martín et al., 1992 (disp. of 0.22Å/pix); ∗∗∗ adopted from Webb et al. (1999); 2. The IR data are taken from Ray et al. (1995); the two sources marked with a are located close to the Galactic plane and this seems to be the reason of not being detected by IRAS; 3. If similar radial velocities have been measured for both members of the pair it is indicated by an ’E’ (if taken from Gahm et al. 1983) and by an ’E’ (if taken from Martín et al. 1992). If the measurements are doubtful, it is indicated by a ’:’ (see Gahm et al., 1982 and Martin et al., 1992 for more details); 4. We have summarized the data of the table in this column using the symbols +, - and ? for positive, negative and unknown properties respectively. The (+) symbols indicate doubtful properties.

Fig. 5 shows a clear separation between the stars of our sample. A boundary line drawn at allows us to classify our stars in soft and hard X-ray emitters. While the softer X-ray emitters lie close to the ratio reported for O- and early-B type stars, those with positive HR, are spread over a wide range of values. Among the latter, we can also distinguish two groups. On one hand, we find the late-type secondaries lying at the top right corner of the figure. On the other hand, the three late-B type stars with possible unresolved late-type companions occupy a band with ranging from -4.5 to -6. Note that these stars clearly deviate from the group of early-type primaries at the left bottom corner of the figure.
If we include HD 560 in Fig. 5 making the same assumptions as in Fig. 4, ie. assuming that it is a single B9 star responsible for the detected X-ray emission, we can see that the source also lies in the same region as HD 123445 A, HD 127971 A and HD 129791 A.
As a conclusion, we can confirm that B-type stars in the Lindroos systems under study generally show a decrease in the X-ray luminosity for decreasing spectral types (from B0 to B9). The ratio is in agreement with their spectral types and it is well-correlated with their negative HR’s. However, there are three sources, HD 123445 A, HD 127971 A and HD 129791 A which show values higher than those reported for earlier B-type stars. Moreover, when comparing the ratio with the computed HRI HR’s, these three late-B type stars clearly deviate from the sample of primary stars, showing values closer to those reported for the late-type secondaries. Therefore, these three late-B type stars are suspected to have unresolved late-type companions.
5 X-ray emission from late-type secondaries: are they Post T Tauri stars?
As mentioned in the introduction, the late-type secondaries of Lindroos systems have been studied in several spectral ranges. In particular, the optical and IR data provide clear evidences of youth among these stars.
In Table 7 we ahow some of the main observational properties of these late-type secondaries. Columns 1, 2 and 3 provide the name of the source, its spectral type and the X-ray luminosity derived from this work. Column 4 shows the equivalent width (EW) of the Li I absorption line while IR data from the IRAS satellite are provided in columns 5 and 6. A ‘flag’ related to the measured radial velocity of the pair is given in column 7. We have finally summarized all these data in the last columns of the table in order to isolate those late-type stars with evidences to be physically bound to the early-type primaries. Apart from the measured radial velocity of the pair and the Li I EW we have also considered other indicators of youth like the X-ray emission and the measured IR excesses.
As we can see from Table 7, all the late-type secondaries in binary systems with similar radial velocities show indications of youth. For the stars with no radial velocity measurements, we have found pairs with clear evidences of youth and hence, most probably physically bound to their primaries: HD 17543, HD 53191, HD 60102, HD 129791 and HD 143939. HD 123445 B and HD 127971 B do not seem to be bound to their primaries because they lack indicators of youth. Finally, HD 40494 B is not detected in X-rays but it shows a strong Li I absorption line (as HD 27638). Therefore, it is not obvious how to classify this source. Radial velocity measurements would be convenient to confirm the nature of this pair.
According to Lindroos (1985), most of these stars show ages lower than 70 Myr but, as discussed in L86, the uncertainties associated with the age determination are large. Note that the ages of the Lindroos systems were first determined from uvby photometry of the primaries (Lindroos 1985) and making use of the evolutionary tracks and isochrones by Hejlesen (1980). A new estimation of the ages using modern isochrones plus new optical and IR photometrical data will be postponed to a later publication.
Instead of studying the ages of the systems we have considered the Li I (6708Å) EW and we have related it to the derived X-ray luminosities. As shown in Table 7, the Li I EW has been directly measured in most of the Lindroos secondaries, so we can study if there is a relation between both parameters. We have plotted in Fig. 6 the Li I EW versus the effective temperature of our stars. Note that these effective temperatures have been derived from their spectral types according to the conversion given by Kenyon & Hartmann (1995). We have also considered the upper envelopes to the Li I EW of two young clusters, the Pleiades ( 125 Myr) and IC 2602 ( 35 Myr), so that those secondary stars with Li I EW stronger than in the Pleiades or in IC 2602 are younger than these clusters (data from Soderblom et al. 1993, Randich et al. 1997 and Stauffer et al. 1997).
Fig. 6a shows that most of the strongest X-ray emitters are located above the Pleiades upper envelopes to the Li I. This suggests that a large fraction of the Lindroos secondaries are younger than 125 Myr, with 4 of them showing ages lower than 35 Myr. Among these 4 stars, we can clearly distinguish HD 109573 B (HR 4796 B) in the right middle part of the figure, with a high value of the Li I EW. Its X-ray emission is not as large as this coming from the other three sources above the IC2602 Li I envelope. The different spectral type as well as the different evolutionary state could explain this difference.
Fig. 6a also allows us to confirm the nature of the HD 123445 and HD 127971 pairs. The secondary stars lie at the bottom of the diagram with upper limits in both, the Li I EW and the X-ray emission. Two more stars show non-detections in X-rays although they lie very close to the upper envelope of the Pleiades: HD 27638 and HD 40494. As we have discussed above, the former is probably bound to the primary (see table 7) while the nature of the later one is not still clear.
As a conclusion, we can say that those stars with strong X-ray emission seem to be younger than IC 2602. Note, however that although the uncertainties associated with the Li I EW measurements are generally low (see Table 7), for the stars earlier than K0 the Li I EW does not allow us to reach any conclusion about their ages because F- and G-type PMS together with ZAMS stars still have their initial Li content.
To study the last issue in detail, we have converted the Li I EW into lithium abundances, N(Li) making use of non-LTE curves of growth from Pavlenko & Magazzú (1996) and assuming a surface gravity of . Note that we have only considered high-resolution data to make this conversion (see Table 7). We have plotted this value against the effective temperature of our stars in Fig. 6b. As in the left panel of the figure, we have found strong X-ray emitters above the Pleiades and IC 2602 data. Note that most of the Lindroos secondaries (11) show lithium abundances close to 3.0 which is consistent with low mass PMS stars.
6 Results and Conclusions
We have reported the X-ray emission from Lindroos binary systems observed with ROSAT. Most of the stars from this sample are detected in the RASS and several binary systems were observed with the PSPC and the HRI. After the analysis of the data, the main conclusions are:
1. Both, early- and late-type stars, show the same distribution of the X-ray Luminosity Function (XLF). Both samples are statistically similar with a probability of a 0.8. When we repeat the analysis without including stars that could be contaminating the samples, that is, without considering most certainly unbound secondaries, early-type primaries with possible unresolved late-type companions and one unreliable X-ray detection, the result does not change. The probability is reduced to 0.4 but it is large enough to statistically confirm the similarity of both samples.
2. A careful study of the HRI hardness ratios of our sample allows to discriminate between soft and hard X-ray emitters. Late-type stars always show positive HR while most of the early-type stars show negative values. Moreover, if we compare the X-ray luminosity in the two energy bands of the HRI, we can see that there is a clear separation between the two samples. Late-type stars show higher H-band than S-band X-ray luminosities. This result can be explained in terms of an energetic corona and activity episodes commonly reported in these stars. In the case of early-type stars, most of them present higher S-band than H-band luminosities. However, there are three X-ray sources formally identified as early-type primaries which show H-band luminosities comparable to those of late-type stars: HD 123445 A, HD 127971 A and HD 129791 A.
3. The diagram shows a clear separation among sources of different spectral types. This separation is even more prononced when the ratio is plotted vs. the HRI hardness ratio. While early-type stars, which generally show negative HR’s, lie close to the “canonical” relation, late-type stars show positive HR’s and present higher values of this ratio ().
For those particular cases of early-type stars with positive HR’s, we have seen that they display X-ray luminosities comparable to those of the late-type companions. When they are plotted into the - HRI HR diagram, they lie closer to the late-type stars than to the B-type group. All these evidences make us conclude that HD 123445 A, HD 127971 A and HD 129791 A are good candidates to have unresolved late-type companions.
5. The computed X-ray luminosities together with the Li I (6708Å) EW and abundances deduced for the Lindroos late-type secondaries have revealed this group of stars to be a good sample of PTTS candidates. A strong X-ray emission is reported for the youngest ones. Although we have no reliable measurements of their ages, most of the Lindroos secondaries seem to be younger than 125 Myr (when compared to the Pleiades) with three of them showing ages lower than 35 Myr (IC 2602 cluster). Also HD 109573 B (HR 4796 B) is located above these two clusters showing a high X-ray emission.
This study also has allowed us to confirm the optical nature of the HD 123445 and HD 127971 pairs. In this sense, two more systems are classified as doubtful: HD 87901 and HD 40494. The former lacks clear indicators of youth while HD 40494, although not detected in X-rays, may be a young star bound to its primary.
Acknowledgements.
We would like to thank T. Hearty, M. Fernández, J. Alves, S. Döbereiner and B. König for their assistance and their useful comments. We are very grateful to T. Berghöfer for providing his data. Some archived ROSAT observations investigated here were performed by T. Berghöfer, J. Krautter, J. Puls, T. Simon and J. Staubert as PI’s. The ROSAT project is supported by the Max-Planck-Society and the German Government (DLR/BMBF).References
- (1) Berghöfer, T.W., Schmitt, J.H.M.M., 1994, A&A 292, L5
- (2) Berghöfer, T.W., Schmitt, J.H.M.M., Cassinelli, J.P., 1996, A&AS 118, 481
- (3) Berghöfer, T.W., Schmitt, J.H.M.M., Danner, R., Cassinelli, J.P., 1997, A&AS 322, 167
- (4) Berghöfer, T.W., Schmitt, J.H.M.M., Hünsch, M., 1999, A&A 342, L17
- (5) Bouvier, J., 1990, AJ 99, 946
- (6) Caillault, J.P., Zoonematkermani, S., 1989, ApJ, 338, L57
- (7) Cassinelli, J.P, Cohen, D.H., MacFarlane, J.J. et al, 1994, ApJ 421, 705
- (8) Cruddace, R.G., Hasinger,G.R., Schmitt, J.H.M.M., 1988, The application of a maximun likelihood analysis to detection of sources in the ROSAT data. In: Murtagh, F. and Heck, A. (eds), ESO Conf. and Workshop Proc. 28, Astronomy from large databases, Garching, p.177
- (9) David, L.P., Harnden, F.R., Kearns, K. E. et al., 1996, The ROSAT High Resolution Imager calibration report. SAO Technical Report, p.6
- (10) Feigelson, E.D., Nelson, P.I., 1985, ApJ 293, 192
- (11) Fruscione, A., Hawkins, I., Jelinsky, P., et al., 1994, ApJS 94, 127
- (12) Gahm, G.F., Ahlin, P., Lindroos, P., 1983, A&AS 51, 143
- (13) Gahm, G.F., Zinnecker, H., Pallavicini, R., and Pasquini, L., 1994, A&A 282, 123
- (14) Harnden, F.R., Jr et al., 1979, ApJ 234, L51
- (15) Hejlesen, P.M., 1980, A&AS 39, 347
- (16) Herbig, G.H., 1978, Mirzoyan, L.V. (ed.).Problems of Physics and Evolution of the Universe, Armenian Acad. Sci., Yerevan, p.171
- (17) Hoffleit, D., Jascheck, C., 1991, The Bright Star Catalogue, 5th revised edition, Yale University Observatory.
- (18) Isobe, T., Feigelson, E.D. and Nelson, P.I., 1986, ApJ 306, 490
- (19) Jewitt, D.C., 1994, AJ, 108, 661
- (20) Jura, M., Malkan, M., White, R. et al., 1998, ApJ 505, 897
- (21) Kenyon , S., Hartmann, L.W., 1995, ApJS 101, 117
- (22) Lindroos, K.P., 1985, A&AS 60, 183
- (23) Lindroos, K.P., 1986, A&A 156, 223 (L86)
- (24) Long, K.S., White, R.L., 1980, ApJ 239, L65
- (25) Lucy, L.B., White, R.L., 1980, ApJ, 241, 300
- (26) Martín, E.L., Magazzù, A., Rebolo, R., 1992, A&A 257, 186
- (27) Murphy, R.E., 1969, AJ 74, 1082
- (28) Neuhäuser, R., Sterzik, M.F., Schmitt, J.H.M.M., et al., 1995, A&A 297, 391
- (29) Pallavicini, R., Golub, L., Rosner, R., et al, 1981, ApJ 248, 279
- (30) Pallavicini, R., Pasquini, L., Randich, S., 1992, A&A 261, 245
- (31) Panzera, M.R., Tagliaferri, G., Pasinetti, L., et al., 1999, A&A 348, 161
- (32) Paresce, F., 1984, AJ 89, 1022
- (33) Pavlenko, Ya. V., Magazzù, A., 1996, A&A 311, 961
- (34) Pfeffermann, E., Briel., U., Hippmann., H., et al., 1988, Proc. SPIE, 733, 519
- (35) Randich, S., Aharpour, N. Pallavicini, R., et al., 1997, A&A 323, 86
- (36) Ray, T.P, Sargent, A.I., Beckwith, S.V.W., Koresko, C. et al., 1995, ApJ 440, L89
- (37) Raymond, J.C., Smith, B.S., 1977, ApJS 35, 419
- (38) Sciortino, S., Vaiana, G.S., Harnden, F.R., et al, 1990 ApJ 361, 621
- (39) Simon, T., Drake, S.A., Kim, P.D., 1995, PASP 107, 1034
- (40) Schmidt-Kaler, T., 1982, in Landolt-Bornstein, neue serie 2b, 14
- (41) Schmitt, J.H.M.M., 1985, ApJ, 293, 178
- (42) Schmitt, J.H.M.M., Zinnecker, H., Cruddace, R., et al., 1993, ApJ 402, L13
- (43) Soderblom, D., David, R., Jones, B.F., et al., 1993, AJ 106, 1059
- (44) Stauffer, J.R., Hartmann, L.W., Prosser, C.F., et al., 1997, ApJ 479, 776
- (45) Trümper, J., 1983, Adv. Space Res. Vol.2, N 4, 241
- (46) Walter, F.M., Brown, A., Mathieu, R.D., et al., 1988, AJ 96, 297
- (47) Webb, R.A., Zuckerman., B., Platais, B. et al., 1999, ApJ 512, L63
- (48) Zimmermann, H.U., et al., 1997, EXSAS User’s Guide, MPE, Garching