POSTSTARBURST MODELS OF LINERS
Abstract
Since the discovery of low-ionization nuclear emission-line regions in many galaxies (LINERs), it has been recognized that they constitute a class of active galactic nuclei (AGNs) which are thought to be powered by gas accretion onto a central, supermassive black hole. LINERs are observed in approximately one third of galaxies in the local universe and it has been often thought that they harbor an AGN-like central engine with moderate activity. However, some LINERs show no direct evidence for AGNs such as broad emission lines, radio jets, hard X-ray emission, spectral energy distributions which are inconsistent with starlight, and so on. For such LINERs (a subset of type 2 LINERs), we present new poststarburst models which explain some of their most important optical narrow emission-line ratios. In these models, the ionization sources are planetary nebula nuclei (PNNs) with temperature of K which appear in the late-phase evolution of intermediate-mass stars with mass between and . Such PNNs left in a typical starburst nucleus can produce an H luminosity of ergs s-1 for typical poststarburst LINERs and ergs s-1 only in exceptionally bright cases. The PNN phase lasts until the death of the lowest-mass stars formed in the starburst, which is yr for an assumed lower limit of the initial mass function of 3 . This long duration appears consistent with the observed higher frequency of occurrence of LINERs if every galaxy could experience the starburst activity several times in its life. We therefore propose that some LINERs which show no direct evidence for AGNs may be poststarburst nuclei powered by a cluster of PNNs.
Subject headings:
galaxies: abundances - galaxies: active - galaxies: nuclei - galaxies: interstellar matter - H ii regions1. INTRODUCTION
For the past two decades, LINERs have been recognized as one of important classes of AGNs (Heckman 1978; Stauffer 1982; Keel 1983a, 1983b Filippenko & Sargent 1985; Véron-Cetty & Véron 1986; Phillips et al. 1986a, 1986b; Maiolino & Rieke 1995; Ho, Filippenko, & Sargent 1997a, 1997c). They are defined by the following criteria based on optical emission-line intensity ratios (Heckman 1978); 1) ([O ii]3727)/([O iii]5007) where [O ii]3727 is used to designate the [O ii]3726, 3729 doublet, and 2) ([O i]6300)/([O iii]5007) . The most recent and comprehensive survey for activity in galactic nuclei conducted by Ho et al. (1997a) has shown that LINERs make up a significant fraction ( 20 – 30 %) of all galaxies and hence they constitute the most populous class of AGNs; i.e., 50 – 75 % of AGNs are LINERs. Therefore, it is very important to understand the origin of LINERs.
Possible origins of LINERs discussed previously are as follows: a) Low-ionization analog of typical AGNs (Ferland & Netzer 1983; Halpern & Steiner 1983; Filippenko & Halpern 1984; Ho, Filippenko, & Sargent 1993; 1997d), b) powering by shocks driven either by superwinds or by nuclear radio jets (Daltabuit & Cox 1972; Koski & Osterbrock 1976; Fosbury et al. 1978; Heckman 1978; Dopita & Sutherland 1995, 1996; Alonso-Herrero et al. 2000; Sugai & Malkan 2000), c) photoionization by Wolf-Rayet stars (Terlevich & Melnick 1985), d) photoionization by hot O stars (Filippenko & Terlevich 1992; Shields 1992), and e) photoionization by old post-AGB stars in elliptical galaxies (Binette et al. 1994). It is noted that the underlying Balmer absorption due to many A-type stars weakens Balmer emission and thus results in apparently higher [N ii]6583/H intensity ratios in some cases (e.g., Taniguchi et al. 1996); note that this ratio is often used to distinguish LINERs from H ii regions; i.e., ([N ii]6583)/(H) for LINERs while for H ii nuclei (Veilleux & Osterbrock 1987; Ho et al. 1997a). However, the overall statistics of the incidence of LINERs (e.g., Ho et al. 1997a) are probably not affected by Balmer absorption because careful starlight subtraction has been made to remove the effects of Balmer absorption from the data, by matching the stellar populations of each LINER with a template absorption-line galaxy.
1.1. Basic concept

There are several lines of evidence for the presence of pure AGN in some LINERs: i) the presence of broad emission-line region (BLR) (Ho et al. 1997d; Maoz et al. 1998), ii) the presence of hidden BLR in polarized optical spectra (Wilkes et al. 1995; Barth, Filippenko,& Moran 1999), iii) a correlation between line width and critical density of the forbidden lines arising from narrow emission-line region (NLR) (Filippenko & Halpern 1984), iv) the presence of point-like ultraviolet source111 Since UV spectra have shown that some of the point-like UV sources are in fact young starburst clusters rather than AGNs (Maoz et al. 1998), the presence of an unresolved UV source may not always indicate the presence of an AGN. (Maoz et al. 1995), v) the presence of radio core and/or jets (e.g., Heckman 1980; Wrobel 1984; Slee et al. 1994), and vi) the detection of hard X-ray continuum as well as Fe K emission (Iyomoto et al. 1996; Ishisaki et al. 1996; Terashima et al. 1998a, 1998b, 2000; Roberts, Warwick, & Ohashi 1999). Despite these firm lines of evidence for the presence of pure AGN in a non-negligibly large number of LINERs (e.g., 20% of LINERs have the BLR: Ho et al. 1997d), the majority of LINERs have no firm evidence for the presence of pure AGN, suggesting that LINERs are heterogeneous (Heckman 1986).
In this paper, we investigate whether or not there are plausible poststarburst models for the ionization mechanism of LINERs taking account that intermediate-mass stars ( several ) are also formed in nuclear starbursts (Joseph 1991). Binette et al. (1994) showed that old post-AGB stars provide sufficient ionizing photons to account for the observed H luminosity of LINERs associated with elliptical galaxy nuclei. In their model, it was assumed that post-AGB stars were formed in the early phase of the galaxy evolution (i.e., the initial starburst). On the other hand, in our paper, our interest is addressed to starbursts occurred in recent pasts in nuclei of spiral galaxies. Therefore, our model presented in this paper is different from theirs.
2. STARBURST AND POSTSTARBURST EVOLUTION
In order to investigate the evolution of a star cluster formed in a starburst, it is necessary to know both the initial mass function (IMF) and the star formation rate (SFR). The SFR for nuclear starbursts can be estimated using observed H luminosities and so on (Kennicutt 1998). Although it is generally difficult to derive the IMF accurately, it seems reasonable to adopt a power-law form of IMF; (e.g., Scalo 1986). In this formulation, there are three free parameters; the power index (), and the upper and lower mass limits of the IMF ( and ). The following values are often adopted for the evolution of the solar neighborhood; = 1.35, , and . On the other hand, summarizing various kinds of observational constraints, Joseph (1991) suggests that 30 – 60 and 3 – 6 for typical nuclear starbursts. Although the top-heavy IMF is suggested for the nuclear starbursts (i.e., is smaller than 1.35; e.g., Scalo 1990), we adopt =1.35, , and as a modest combination. Another parameter is the duration of the starburst, ; we adopt yr because the negative feedback from supernova explosions to star-forming gas clouds is expected to occur yr (i.e., the lifetime of B stars) after the onset of the starburst (e.g., Larson 1987). The lifetime of a starburst can also be estimated as a gas consumption timescale, where is the gas mass available for the starburst, is the star formation efficiency, and is the star formation rate. If we adopt , , and yr-1, we obtain y. We will discuss the SFR later.

Now let us consider the evolution of the star cluster with the above parameters. Phase I ( yr): We assume that the starburst lasts for yr. The star formation rate is assumed to be constant. In this phase, main photoionization sources are most massive stars. Dynamical effect of supernova explosions may be weak in this phase. Phase II ( yr): Since the star formation ceases at a time yr in our model, main photoionization sources change from O stars to B stars as time goes. Wolf-Rayet stars also work in the photoionization (Vacca & Conti 1992; Conti 1999). Phase III ( yr): Continuous supernova explosions develop a superwind and then shock heating also works in this phase (Heckman, Armus, & Miley 1990; Ohyama, Taniguchi, & Terlevich 1997; Alonso-Herrero et al. 2000). Phase IV [ yr]: Intermediate-mass stars with mass of several play a role as the photoionization sources. The bolometric luminosity of each star in the main sequence phase is . Each star evolves from the main sequence to the asymptotic giant branch (AGB). Following this AGB phase, each star will lose its gaseous envelope and then a hot stellar core appears and ionizes the surrounding gas, making a so-called planetary nebula (Kaler 1985; Vassiliadis, & Wood 1994). Since this core (i.e., a planetary-nebula nucleus; hereafter PNN) is so hot (i.e., K), they become to be major photoionization sources. Finally, stars with mass of die at yr222Note that the ages of intermediate-mass stars are estimated as yr, yr, and yr for stellar masses of , , and , respectively using a relation of yr for (Theis, Burkert, & Hensler 1992). and then the effect of the nuclear starburst disappears unless stars less massive than 3 were formed in the starburst. The starburst evolution is summarized schematically in Figure 1.
In many previous studies, Phase IV has not been taken into account seriously. However, the temperature of PNNs is hot (i.e., K) enough to ionize the surrounding nebula. More importantly, this higher temperature can be responsible for the formation of partly-ionized regions in which [O i] emission is thought to arise. If the ionization parameter is as low as that for typical LINERs, the optical spectrum of such a nebula is expected to be quite similar to those of LINERs. Note that each PNN has a bolometric luminosity of (e.g., Vassiliadis, & Wood 1994), being comparable to that of a hot O star (Filippenko, & Terlevich 1992; Shields 1992).
2.1. Poststarburst evolution model
In order to demonstrate the importance of the PNN cluster, we investigate the poststarburst evolution for the star cluster discussed in section 2.1 using luminosity evolution models of Kodama & Arimoto (1997). In Figure 2, we show the time evolution of H luminosity which is normalized by a unit gas mass, . Here we assume that stars are formed from the gas with the solar metallicity for simplicity. The H luminosity is estimated from the number of Lyman continuum photons; ergs s-1 (Leitherer & Heckman 1995). Note that the lower mass cutoff is fixed at 0.1 in Kodama & Arimoto’s models. Therefore, the H luminosity shown in Figure 2 is corrected for the case of by us.
According to Kennicutt (1998), the SFR is related to as for the IMF with , , and . This relation can be replaced by for the Salpeter IMF with and . Balzano (1983) found – ergs s-1 for her sample of Markarian starburst nuclei with a Hubble constant of = 75 km s-1 Mpc-1 (see also Kennicutt, Keel, & Blaha 1989; Ho, Filippenko, & Sargent 1997b). Since the duration of H-bright phase is very short (e.g., yr; see Figure 2) in the starbursts, it seems rarer to detect starbursts with such a bright phase from a statistical point of view. For example, the age of the starburst occurring in Mrk 1259, which is one of the brightest starburst nuclei studied by Balzano (1983), is estimated to be yr (Ohyama et al. 1997). Although the observed H luminosity of this galaxy is ergs s-1, this galaxy would be observed as a less luminous starburst if it will be observed yr after now. Typical H luminosities listed in Balzano’s catalog are - ergs s-1. If the above statistical effect is taken into account, their initial H luminosities may be of the order of - ergs s-1. Furthermore, since the mean reddening correction is about a factor of 4-5 for H (e.g., Balzano 1983), the reddening-corrected, initial H luminosities seem to be as luminous as ergs s-1 on average and some brightest nuclear starbursts may have H luminosities of ergs s-1. These values lead to 10 – 100 yr-1. Then, we estimate for the nuclear starbursts. Indeed, the molecular gas mass in circumnuclear regions of typical starburst nuclei is (Devereux et al. 1994). As shown in Figure 2, the H luminosity density per unit mass at yr is ergs s-1 . Therefore, we estimate typical H luminosities of poststarburst nuclei with yr as ergs s-1 for a typical LINER powered by PNNs, and ergs s-1 in exceptionally bright cases.
It should be mentioned that our poststarburst models cannot be applied to on-going starburst galaxies because most starburst nuclei have ergs s-1 (Balzano 1983; Kennicutt et al. 1989; Ho et al. 1997b). Namely, if a nuclear starburst occurs, the photoionization should be dominated by massive stars in the starburst even if there is a cluster of PNNs left from the recent past nuclear starburst.
2.2. Optical emission-line properties of the ionized nebula
Next we investigate optical emission-line properties of the gaseous nebula photoionized by the PNN cluster. We use the photoionization code CLOUDY version 90.05 (Ferland 1996), which solves the equations of statistical and thermal equilibrium and produces a self-consistent model of the run of temperature as a function of depth into the nebula. Here we assume that a uniform-density gas cloud with plane-parallel geometry is irradiated by the star cluster formed in the starburst. The parameters for the calculations are 1) the hydrogen density of the cloud (), 2) the ionization parameter (Osterbrock 1989); where is the number of ionizing photons, is the distance from the ionizing source, and is the light velocity, 3) the spectral energy distribution (SED) of the ionizing radiation, and 4) the chemical compositions.
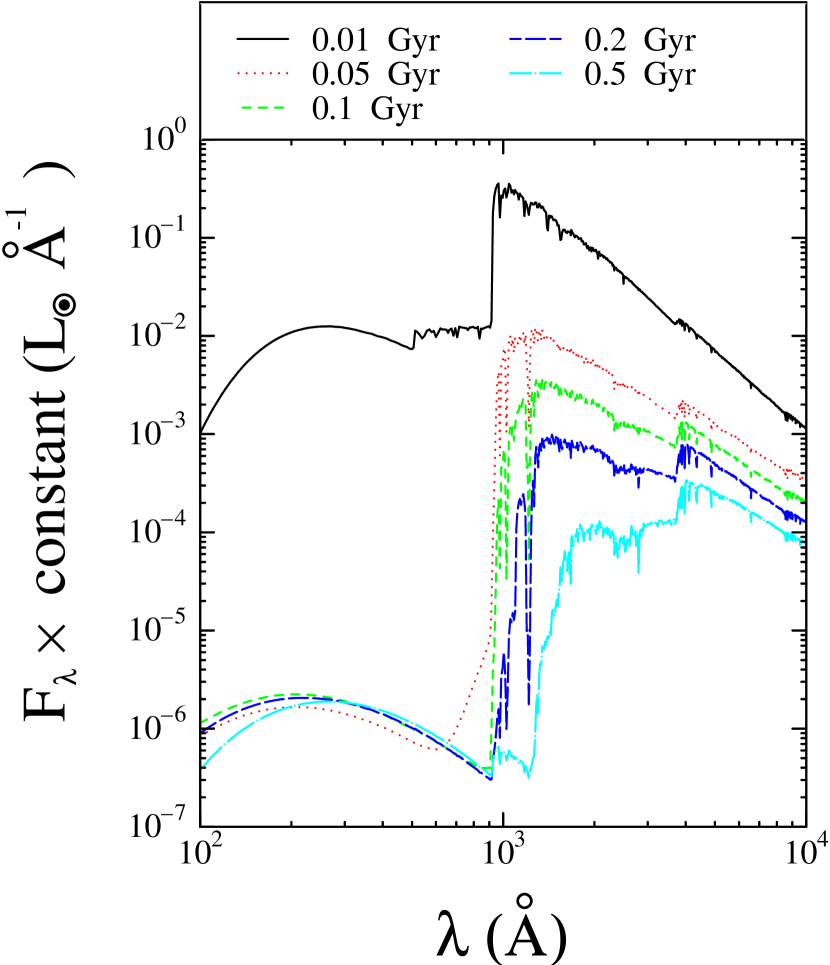
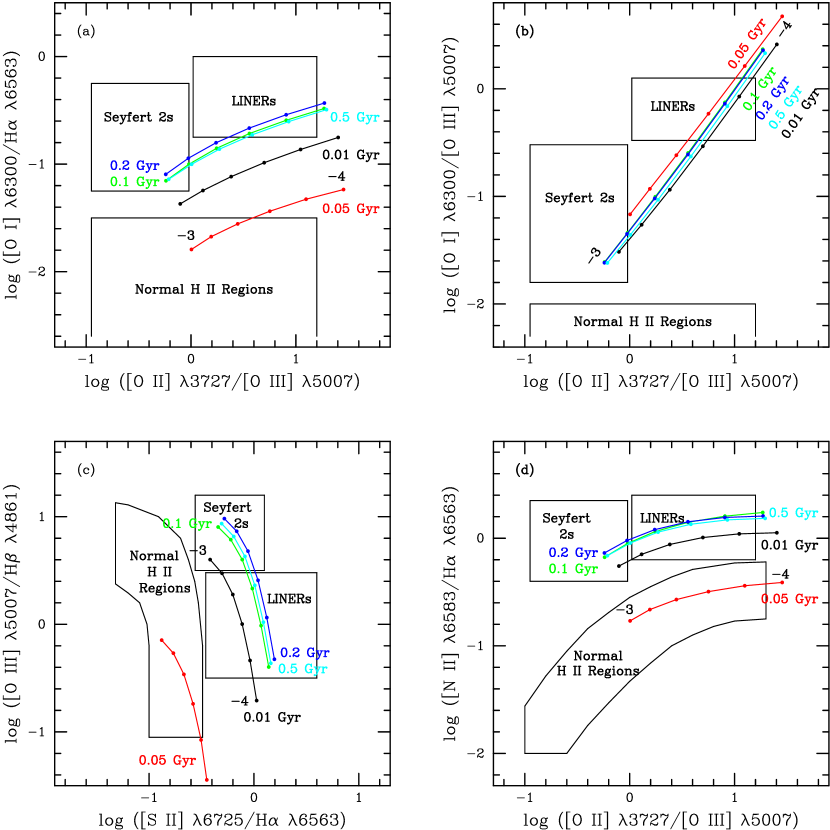
The SED of the ionizing radiation is calculated during the course of the starburst evolution using Kodama & Arimoto’s models. The SED evolution is shown in Figure 3. Note that the ordinate is the flux in units of Å-1, corresponding to the case that the total gas mass is . We perform our photoionization calculations as a function of the ionization parameter between log and log with a logarithmic interval of 0.2. Following Filippenko & Terlevich (1992), we adopt cm-3. In order to examine the effect of dust grains on emission-line intensity ratios, we perform photoionization calculations for the following two cases; a) the dust-free gas with the solar abundances, and b) the gas with the Orion Nebula abundances where effects of dust grains are taken into account. For both the cases we simply adopted the abundance sets available in CLOUDY. The solar composition is taken from Grevesse & Anders (1989) and Grevesse & Noels (1993). The Orion Nebula abundances are a subjective mean of the abundances determined by Baldwin et al. (1991), Rubin et al. (1991), and Osterbrock, Tran, & Veilleux (1992). The grains are the large-R grains described by Baldwin et al. (1991). The calculations were stopped when the temperature fell to 3000 K, below which little optical emission is expected.
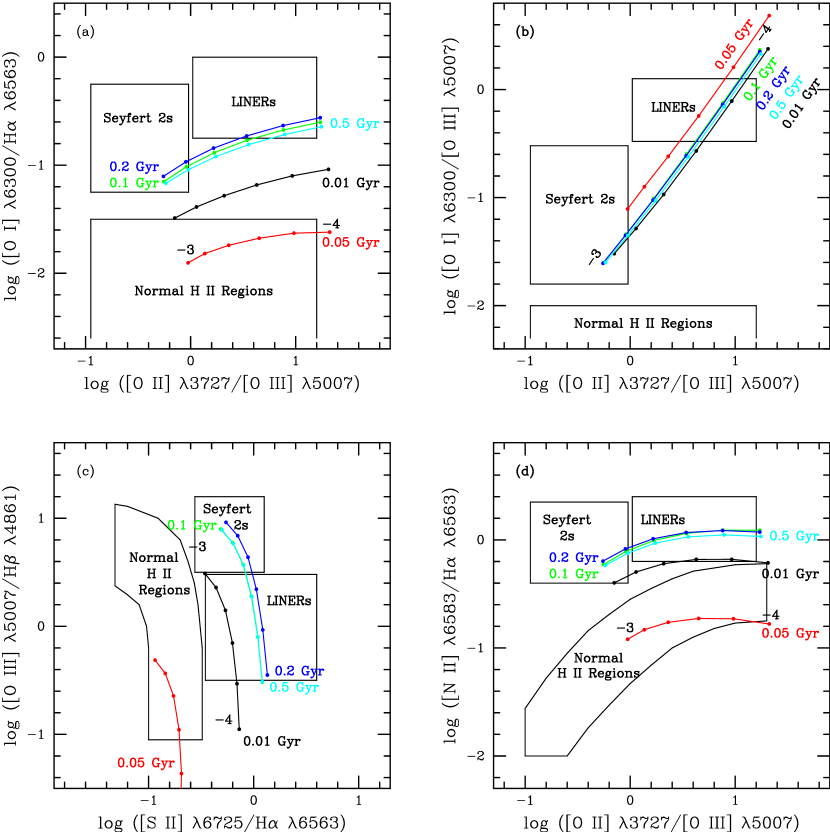
The results are shown in Figures 4 and 5 for the above two cases, respectively. Here we use the same emission-line diagnostic diagrams as those used in Filippenko & Terlevich (1992). It is shown that our poststarburst models with age of – yr appear consistent with the observed emission-line properties of LINERs; the depletion of metals into dust grains leads to higher relative intensities of low-ionization lines such as [O i] and [S ii], being more consistent with the observations. However, it should be noted that the [O i]/H ratio barely touches the LINER region of the diagnostic diagram in both Figure 4 and 5. In this respect, our models are similar to the previous O-star models for weak [O i] LINERs proposed by Filippenko & Terlevich (1992) and Shields (1992); i.e., the weak [O i] LINERs are defined as LINERs with ([O i]6300)/(H) . However, since PNNs are hot enough to supply such high-energy photons, the other emission-line ratios appear more consistent with the observations (see Figures 4 and 5) than those of the O-star models. The weakness of [O i] emission in our models may be attributed to the fact that the production rate of high-energy photons is lower than that of the non-thermal continuum radiation from an AGN.
In order to demonstrate this quantitatively, we show the time evolution of the number of ionizing photons which are capable of ionizing He0 (i.e., 24.6 eV) in Figure 2 (see the dotted line). Although high-energy photons are supplied by O stars in Phase I, they decrease in number significantly in Phase III. However, they increase in number again in Phase IV because of the supply from high-temperature PNNs. This makes our models more consistent with the observations than the previous O-star photoionization models.
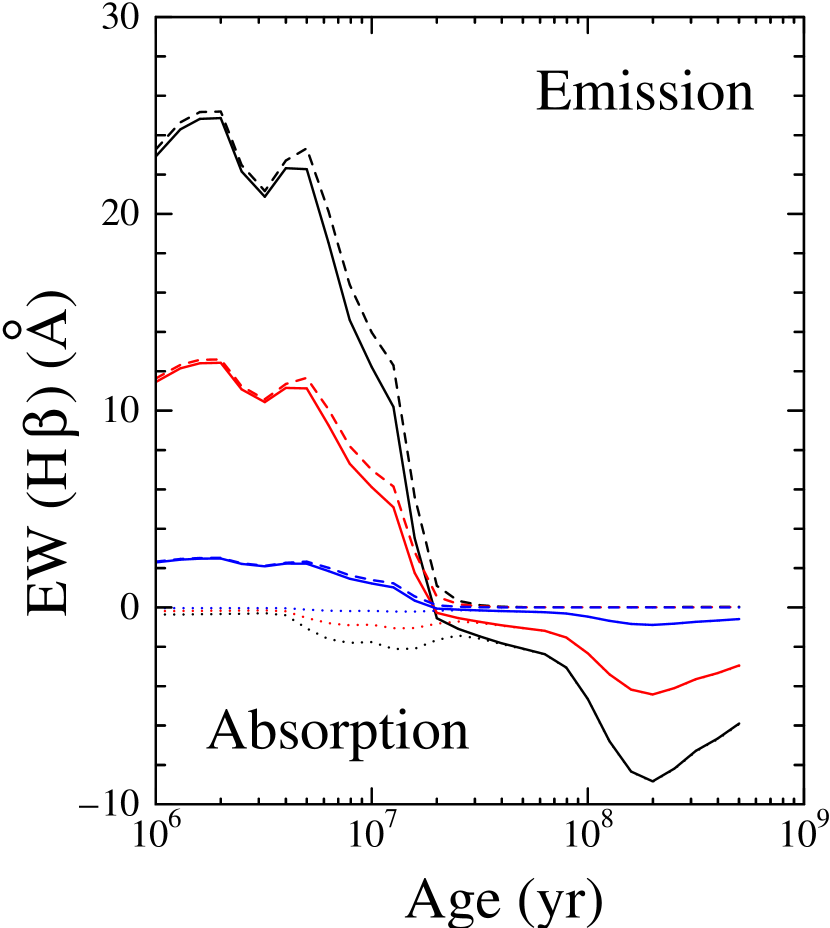
It is known that intermediate-mass stars produce strong Balmer absorption lines in their stellar atmospheres and thus the Balmer emission lines arising from the ionized nebulae are sometimes quenched by the Balmer absorption. In order to investigate this effect quantitatively along the starburst evolution, we show time variations of the equivalent width () of both Balmer emission and absorption for the case of H in Figure 6. The H emission dominates in the first a few times yr while the H absorption does after this age. This comparison suggests that LINERs whose Balmer lines are observed as absorption are more popular by about one order of magnitude than those with the Balmer emission. On the other hand, observations show that the fraction of the former LINERs is significantly smaller than that of the latter ones (Ho et al. 1997a). However, if the Balmer emission has a narrower line width on average than the Balmer absorption, the Balmer emission can be seen even if the . This trend is actually seen in the observed spectra of many LINERs (Ho et al. 1997a).
3. CONFRONTATION WITH OBSERVATION
3.1. Frequency of occurrence of poststarburst LINERs
We estimate the frequency of occurrence of poststarburst LINERs. Since LINERs are very common (Ho et al. 1997a), any models are required to explain this property. The lifetime of the poststarburst LINER would be as long as yr if is less than 1 (Binette et al. 1994). However, this case is beyond our scope and should be applied to the nuclear emission-line regions of long-lived elliptical galaxies. Here we adopt that the lifetime of LINER in our poststarburst model is yr given that the lowest mass of stars formed in the starburst is 3 . On the other hand, the lifetime of the starburst is yr where is the sum total of the durations of both Phase I and II. Therefore, the expected number ratio between starbursts and poststarburst LINERs is . Since typical nuclear-starburst galaxies are observed in 1% of nearby galaxies (e.g., Balzano 1983), poststarburst LINERs are expected to share 25% of nearby galaxies, being consistent with the observation (Ho et al. 1997a). However, we should mention why nuclear starbursts with yr are observed in % of nearby galaxies because the comparison between and the Hubble time, yr, would give statistically a frequency of occurrence of starbursts of 0.2%. The difference between this estimate and the actual frequency may be reconciled if every galaxy experiences starbursts several times in its life.
We mention that the above estimate is based on an assumption that there has been no star formation activity since the recent past starburst. If the galaxy currently experiences nuclear star formation at a level of even times the star formation rate of the starburst, then the young stellar population would dominate over PNNs by an order of magnitude, and the emission-line spectrum would be that of an H ii region, not a LINER. If there is any current or very recent star formation, the frequency of LINERs generated by this poststarburst mechanism may be significantly lower than the above estimate. However, it has been argued that the negative feedback from supernova explosions to star-forming gas clouds prevent from new intense star formation for yr after the onset of the starburst (e.g., Larson 1987). Therefore, our assumption seems reasonable.
3.2. Morphological-type segregation
First of all, we mention that our models cannot be applied to LINERs associated with the nuclei of elliptical galaxies and most of S0 in which nuclear starburst occurs seldom although some S0 galaxies have a lot of molecular gas together with a moderate level of star-formation activity (e.g., Thronson et al. 1989).
It is known that there is a morphological-type segregation between nuclear starbursts and LINERs (Ho et al. 1997a); i.e., starbursts appear preferentially in late-type spirals while LINERs do in early-type ones. As for this issue, we give the following three comments. 1) A possible activity classification bias: If one finds evidence both for an AGN and for a nuclear starburst in a galaxy, one tends to classify it as an AGN. It is noted that infrared evidence for nuclear starbursts has been found even in a significantly large number of early-type spiral galaxies Devereux 1987, 1994). 2) A possible spectroscopic bias: Emission-line classification based on optical spectroscopy with a large aperture may be sometimes unreliable. For example, even if a galaxy has a pure AGN, it may be misclassified as a nuclear-starburst galaxy if it has very luminous circumnuclear star-forming regions (Yoshida et al. 1993). This means that one may misidentify activity types of late-type spirals with an AGN. And, 3) a morphological-evolution effect: It seems likely that a strong nuclear starburst may modify the appearance of a galaxy so that the host tends to be classified as an earlier-type spiral (Alonso-Herrero et al. 2000; Wada, Habe, & Sofue 1995). If starbursts were triggered by minor-mergers of satellite galaxies, the morphology of host galaxies could be altered (Mihos & Hernquist 1994; Hernquist & Mihos 1995; Taniguchi & Wada 1996).
4. SUMMARY
We have presented a new poststarburst model of LINERs. In this model, the ionization sources are planetary nebula nuclei (PNNs). Our main point is that the ionization sources are planetary nebula nuclei (PNNs) with temperature of K which appear in the late-phase evolution of intermediate-mass stars with mass between and . Our models are able to reproduce the observed optical narrow emission-line ratios of LINERs although the [O i] emission is underpredicted to some extent.
We give a summary of the limitations of our models. 1) Our models cannot be applied to LINERs associated with nuclei of elliptical galaxies and most of S0 galaxies in which nuclear starbursts occur seldom. 2) Our models cannot be applied to LINERs with direct evidence for AGN such as broad-line emission, radio jets, hard X-ray emission, and so on (mostly type 1 LINERs). 3) Our models cannot be applied to on-going starburst nuclei because the photoionization is dominated by massive stars in the starburst rather than a cluster of PNNs left from a recent past starburst. 4) Accordingly, our models are applied to a subset of type 2 LINERs located in nuclear regions of spiral galaxies. Since the H luminosity in the poststarburst LINER phase is less luminous by 4 orders of magnitude than the initial H luminosity at the onset of the starburst, our models are preferentially applied to low-luminosity LINERs; e.g., (H) ergs s-1.
Our models are constructed to explain the observed optical narrow emission-line ratios and we have not examined properties at other wavelengths (e.g., radio continuum, hard X rays, and so on). However, since the ionization sources are PNNs, poststarburst LINERs will not show any evidence for the presence of AGNs such as radio jets, hard X-ray emission and so on. As shown in Figure 3, our models predict that the X-ray emission is much weaker than that of typical AGNs, being consistent with some type 2 LINERs (Terashima et al. 2000 and references therein; see also for AGN-like SEDs of LINERs, Ho 1999). One interesting prediction of our models is that the ionization sources may be spatially extended because massive stars in nuclear starbursts are often distributed within central 100-pc regions (Meurer et al. 1995; see also Sugai & Taniguchi 1992). Recently, Pogge et al. (2000) have shown that some LINERs have spatially-extended emission-line regions with sizes of tens to hundreds parsecs. However, since they have either a compact UV source or no bright UV source, they may be not poststarburst LINERs but genuine low-ionization AGNs. In conclusion, in order to examine how many poststarburst LINERs are really present, we need systematic investigations of radio-continuum and X-ray properties of low-luminosity LINERs as well as UV continuum imaging in future.
We would like to thank an anonymous referee for many useful comments and suggestions. YS and TM are supported by JSPS. This work was financially supported in part by Grant-in-Aids for the Scientific Research (Nos. 10044052, and 10304013) of the Japanese Ministry of Education, Culture, Sports, and Science.
References
- (1) Alonso-Herrero, A., Rieke, M. J., Rieke, G. H., & Shields, J. C. 2000, ApJ, 530, 688
- (2) Baldwin, J. A., Ferland, G. J., Martin, P. G., Corbin, M. R., Cota, S. A., Peterson, B. M., & Slettebak, A. 1991, ApJ, 374, 580
- (3) Balzano, V. A. 1983, ApJ, 268, 602
- (4) Barth, A. J., Filippenko, A. V., & Moran, E. C. 1999, ApJ, 525, 673
- (5) Binette, L., Magris, C. G., Stasinśka, G., & Bruzual, A. G. 1994, A&A, 292, 13
- (6) Bruzual, A. G., & Charlot, S. 1993, ApJ, 405, 538
- (7) Conti, P. S. 1999, in Wolf-Rayet Phenomena in Massive Stars and Starburst Galaxies, eds. Karel A. van der Hucht, Gloria Koenigsberger, and Philippe R. J. Eenens, 507
- (8) Daltabuit, E., & Cox, D. P. 1972, ApJ, 173, L13
- (9) Devereux, N. A. 1987, ApJ, 323, 91
- (10) Devereux, N. A. 1994, in Mass-Transfer Induced Activity in Galaxies, ed. I. Shlosman (Cambridge University Press: Cambridge), 155
- (11) Devereux, N. A., Taniguchi, Y., Sanders, D. B., Nakai, N., & Young, J. S. 1994, AJ, 107, 2006
- (12) Dopita, M. A., & Sutherland, R. S. 1995, ApJ, 455, 468
- (13) Dopita, M. A., & Sutherland, R. S. 1996, ApJS, 102, 161
- (14) Ferland, G. J. 1996, University of Kentucky Department of Physics and Astronomy Internal Report
- (15) Ferland, G. J., & Netzer, H. 1983, ApJ, 264, 105
- (16) Filippenko, A. V., & Halpern, J. P. 1984, ApJ, 285, 458
- (17) Filippenko, A. V., & Sargent, W. L. W. 1985, ApJS, 57, 503
- (18) Filippenko, A. V., & Terlevich, R. 1992, ApJ, 397, L79
- (19) Fosbury, R. A. E., Mebold, U., Goss, W. M., & Dopita, M. A. 1978, MNRAS, 183, 549
- (20) Grevesse, N., & Anders, E. 1989, in Cosmic abundances of matter, proceedings of the AIP Conference, Minneapolis, 1
- (21) Grevesse, N., & Noels, A. 1993, in Origin & Evolution of the Elements, ed. N. Prantzos, E. Vangioni-Flam, & M. Casse (Cambridge Univ. Press), 15
- (22) Halpern, J. P., & Steiner, J. E. 1983, ApJ, 269, L37
- (23) Heckman, T. M. 1980, A&A, 87, 152
- (24) Heckman, T. M. 1986, PASP, 98, 159
- (25) Heckman, T. M., Armus, L., & Miley, G. K. 1990, ApJS, 74, 833
- (26) Hernquist, L., & Mihos, C. J. 1995, ApJ, 448, 41
- (27) Ho, L. C. 1999, ApJ, 516, 672
- (28) Ho, L. C., Filippenko, A. V., & Sargent, W. L. W. 1993, ApJ, 417, 63
- (29) Ho, L. C., Filippenko, A. V., & Sargent, W. L. W. 1997a, ApJ, 487, 568
- (30) Ho, L. C., Filippenko, A. V., & Sargent, W. L. W. 1997b, ApJ, 487, 579
- (31) Ho, L. C., Filippenko, A. V., & Sargent, W. L. W. 1997c, ApJS, 112, 315
- (32) Ho, L. C., Filippenko, A. V., & Sargent, W. L. W. 1997d, ApJS, 112, 391
- (33) Ishisaki, Y., et al. 1996, PASJ, 48, 237
- (34) Iyomoto, N., Makishima, K., Fukazawa, Y., Tashiro, M., Ishisaki, Y., Nakai, N., & Taniguchi, Y. 1996, PASJ, 48, 231
- (35) Joseph, R. 1991, in Massive Stars in Starbursts, ed. C. Leitherer et al. (Cambridge: Cambridge University Press), 259
- (36) Kaler, J. B. 1985, ARA&A, 23, 89
- (37) Keel, W. C. 1983a, ApJ, 269, 466
- (38) Keel, W. C. 1983b, ApJS, 52, 229
- (39) Kennicutt, R. C. Jr. 1998, ARA&A, 36, 189
- (40) Kennicutt, R. C. Jr., Keel, W. C., & Blaha, C. A. 1989, AJ, 97, 1022
- (41) Kodama, T., & Arimoto, N. 1997, A&A, 320, 41
- (42) Koski, A. T., & Osterbrock, D. E. 1976, ApJ, 203, L49
- (43) Larson, R. B. 1987, in Starbursts and Galaxy Evolution, eds. T. X. Thuan, T. Montmerle, and J. Tran Thanh Van (Editions Frontieres: Gif-sur-Yvette), 467
- (44) Leitherer, C., et al. 1996, PASP, 108, 996
- (45) Leitherer, C., & Heckman, T. M. 1995, ApJS, 96, 9
- (46) Maiolino, R., & Rieke, G. H. 1995, ApJ, 454, 95
- (47) Maoz, D., Koratkar, A., Shields, J. C., Ho, L. C., Filippenko, A. V., & Sternberg, A. 1998, AJ, 116, 55
- (48) Maoz, D., Filippenko, A. V., Ho, L. C., Rix, H.-W., Bahcall, J. N., Schneider, D. P., & Macchetto, F. D. 1995, ApJ, 440, 91
- (49) Meurer, G. R., Heckman, T. M., Leitherer, C., Kinney, A., Robert, C., & Garnett, D. R. 1995, AJ, 110, 2665
- (50) Mihos, C. J. & Hernquist, L. 1994, ApJ, 425, L13
- (51) Ohyama, Y., Taniguchi, Y., & Terlevich, R. 1997, ApJ, 480, L9
- (52) Osterbrock, D. E. 1989, Astrophysics of Gaseous Nebulae and Active Galactic Nuclei (San Francisco: Freeman)
- (53) Osterbrock, D. E., Tran, H. D., & Veilleux, S. 1992, ApJ, 389, 305
- (54) Phillips, M. M., Jenkins, C. R., Dopita, M. A., Sadler, E. M., & Binette, L. 1986a, AJ, 91, 1062
- (55) Phillips, M. M., Jenkins, C. R., Dopita, M. A., Sadler, E. M., & Binette, L. 1986b, AJ, 92, 503
- (56) Pogge, R. W., Maoz, D., Ho, L. C., & Eracleous, M. 2000, ApJ, 532, 323
- (57) Roberts, T. P., Warwick, R. S., & Ohashi, T. 1999, MNRAS, 304, 52
- (58) Rubin, G. B., Simpson, J. R., Haas, M. R., & Erickson, E. F. 1991, ApJ, 374, 564
- (59) Scalo, J. M. 1986, Fund. Cosmic Phys., 11, 1
- (60) Scalo, J. M. 1990, in Windows on Galaxies, ed. G. Fabbiano et al. (Klewer Academic Publishers: Dordrecht), 125
- (61) Shields, J. C. 1992, ApJ, 399, L27
- (62) Slee, O. B., Sadler, E. M., Reynolds, J. E., & Ekers, R. D. 1994, MNRAS, 269, 928
- (63) Stauffer, J. R. 1982, ApJ, 262, 66
- (64) Sugai, H., & Malkan, M. A. 2000, ApJ, 529, 219
- (65) Sugai, H., & Taniguchi, Y. 1992, AJ, 103, 1470
- (66) Taniguchi, Y., Ohyama, Y., Yamada, T., Mouri, H., & Yoshida, M. 1996, ApJ, 467, 215
- (67) Taniguchi, Y., & Wada, K. 1996, ApJ, 469, 581
- (68) Terashima, Y., Ho, L. C., Ptak, A. F., Mushotzky, R. F., Serlemitsos, P. J., Yaqoob, T., & Kunieda, H. 2000, ApJ, 533, 729
- (69) Terashima, Y., Ptak, A., Fujimoto, R., Itoh, M., Kunieda, H., Makishima, K., & Serlemitsos, P. J. 1998a, ApJ, 496, 210
- (70) Terashima, Y., Kunieda, H., Misaki, K., Mushotzky, R. F., Ptak, A. F., & Teichert, G. A. 1998b, ApJ, 503, 212
- (71) Terlevich, R., & Melnick, J. 1985, MNRAS, 213, 841
- (72) Theis, Ch., Burkert, A., & Hensler, G. 1992, A&A, 265, 465
- (73) Thronson, H. A. Jr., Tacconi, L., Kenney, J., Greenhouse, M. A., Margulis, M., Tacconi-Garman, L., & Young, J. S. 1989, ApJ, 344, 747
- (74) Vacca, W. D., & Conti, P. S. 1992, ApJ, 401, 543
- (75) Vassiliadis, E., & Wood, P. R. 1994, ApJS, 92, 125
- (76) Véron-Cetty, M.-P., & Véron, P. 1986, A&AS, 66, 335
- (77) Veilleux S., & Osterbrock D. E. 1987, ApJS, 63, 295
- (78) Wada, K., Habe, A., & Sofue, Y. 1995, PASJ, 47, 1
- (79) Wilkes, B. J., Schmidt, G. D., Smith, P. S., Mathur, S., & McLead, K. K. 1995, ApJ, 455, L13
- (80) Wrobel, J. M. 1984, ApJ, 284, 531
- (81) Yoshida, M., Yamada, T., Kosugi, G., Taniguchi, Y., & Mouri, H. 1993, PASJ, 45, 761