X-ray observations of the starburst galaxy NGC 253:
Abstract
Spatial and spectral analysis of deep ROSAT HRI and PSPC observations of the near edge-on starburst galaxy NGC 253 reveal diffuse soft X-ray emission, which contributes 80% to its total X-ray luminosity (L erg s-1, corrected for foreground absorption). The nuclear area, disk, and halo contribution to the luminosity is about equal. The starburst nucleus itself is highly absorbed and not visible in the ROSAT band.
The emission from the nuclear area stems from a heavily absorbed source with an extent of 250 pc (FWHM) about 100 pc above the nucleus along the SE minor axis (“nuclear source”, X34), and the “X-ray plume”. The nuclear source is best described as having a thermal bremsstrahlung spectrum with a temperature of T = 1.2 keV (N cm-2) and L erg s-1 (corrected for Galactic foreground absorption). The spectrum of the hollow-cone shaped plume (opening angle of 32° and extent of 700 pc along the SE minor axis) is best modeled by a composite of a thermal bremsstrahlung (Ncm-2, T = 1.2 keV, L erg s-1) and a thin thermal plasma (Galactic foreground absorption, T = 0.33 keV, L erg s-1). The diffuse nuclear emission components trace interactions between the galactic super-wind emitted by the starburst nucleus, and the dense interstellar medium of the disk.
Diffuse emission from the disk is heavily absorbed and follows the spiral structure. It can be described by a thin thermal plasma spectrum ( T = 0.7 keV, intrinsic luminosity L erg s-1), and most likely reflects a mixture of sources (X-ray binaries, supernova remnants, and emission from H ii regions) and the hot interstellar medium. The surface brightness profile reveals a bright inner and a fainter outer component along the major axis with extents of 3.4 kpc and 7.5 kpc.
We analysed the total halo emission separated into two geometrical areas; the “corona” (scale height kpc) and the “outer halo”. The coronal emission (T = 0.2 keV, L erg s-1) is only detected from the near side of the disk (in the SE), emission from the back (in the NW) is shadowed by the intervening interstellar medium unambiguously determining the orientation of NGC 253 in space. In the NW we see the near edge of the disk is seen , but the far component of the halo, and vice versa in the SE. The emission in the outer halo can be traced to projected distances from the disk of 9 kpc, and shows a horn-like structure. Luminosities are higher (10 and erg s-1, respectively) and spectra harder in the NW halo than in the SE. The emission in the corona and outer halo is most likely caused by a strong galactic wind emanating from the starburst nucleus. As an additional contribution to the coronal emission floating on the disk like a spectacle-glass, we propose hot gas fueled from galactic fountains originating within the boiling star-forming disk. A two temperature thermal plasma model with temperatures of 0.13 and 0.62 keV or a thin thermal plasma model with temperature of 0.15 keV and Gaussian components above 0.7 keV and Galactic foreground absorption are needed to arrive at acceptable fits for the NW halo. This may be explained by starburst-driven super-winds or by effects of a non-equilibrium cooling function in a plasma expanding in fountains or winds.
We compare our results to observations at other wavelengths and from other galaxies.
Key Words.:
X-rays: galaxies – Galaxies: individual: NGC 253 – Galaxies: spiral – Galaxies: starburst – Interstellar medium: jets and outflows1 Introduction
A hot gaseous component in the interstellar medium with a temperature around 106 K is expected to originate from SNRs in the disk of spiral galaxies. The medium might emerge via galactic fountains into the halo of these galaxies (e.g. Spitzer 1956; Cox & Smith 1974; Bregman 1980a,b; Corbelli & Salpeter 1988). Supernovae and winds from massive stars in a central starburst might even drive a large-scale outflow that can shock heat and accelerate ambient interstellar or circumgalactic gas in form of a galactic super-wind (e.g. Heckman et al. 1990). This component (e.g. Cox & Reynolds 1987) was detected by Snowden et al. (1994) in the plane and halo of the Milky Way during the all sky survey and in pointed observations performed by the Röntgen observatory satellite (ROSAT). Hot interstellar gas in the LMC originally detected by observations of the Einstein observatory (e.g. Wang et al. 1991) was confirmed in the ‘first light’ observations with ROSAT (Trümper et al. 1991). Outside the local group, Einstein upper limits to the diffuse emission from hot gas were determined for edge-on galaxies (Bregman & Glassgold 1982) and for the large face-on galaxy M101 (McCammon & Sanders 1984). For the starburst galaxies M82, NGC 253, and NGC 3628 however, Watson et al. (1984), Fabbiano & Trinchieri (1984), Fabbiano (1988) and Fabbiano et al. (1990) resolved extended emission that was attributed to gaseous clouds ejected from the starburst nuclei, with temperatures in the K range.
Deep PSPC and HRI observations of the prototypical starburst galaxy NGC 253, due to its low Galactic foreground absorption and big optical extent, are ideal exploiting the ROSAT virtues (Trümper 1983, Aschenbach 1988, Pfeffermann et al. 1987). The low Galactic foreground absorption (N cm-2, Dickey & Lockman 1990) allows soft X-rays from NGC 253 to reach the detector with little attenuation. Pietsch (1992) reported first results based on some early ROSAT PSPC observations. Read et al. (1997) presented X-ray parameters of NGC 253 in a homogeneous analysis of archival ROSAT PSPC data of nearby spiral galaxies, and Dahlem et al. (1998) investigated archival ROSAT and ASCA data in an X-ray mini-survey of nearby edge-on starburst galaxies including NGC 253.
| Ref. | ||
|---|---|---|
| Type | Sc | ∗ |
| Assumed distance | 2.58 Mpc | 2 |
| (hence 1 pc) | ||
| Position of | 3 | |
| center (2000.0) | ||
| 254 | 1 | |
| Corrected | 188 | 1 |
| Axial ratio | 0.23 | 1 |
| Position angle | 52° | 4 |
| Inclination | 78.5° | 5 |
| Galactic foreground | 1.3 cm-2 | 6 |
References: (1) Tully (1988); (2) Puche & Carignan (1988); (3) Forbes et al. (1991); (4) SIMBAD data base, operated at CDS, Strasbourg, France; (5) Pence (1980) (6) Dickey & Lockman (1990)
In this paper we present a detailed analysis of the diffuse X-ray emission of NGC 253, characterizing in detail the different emission components of the area close to the nucleus (“nuclear source” and “X-ray plume”), of the disk, and the halo hemispheres. The point source contributions were separated with the help of the point source catalog presented by Vogler & Pietsch (1999, Paper I). Galaxy parameters used throughout this paper are summarized in Table 1. Our analysis is restricted to ROSAT data. Results of ASCA or BeppoSAX are hampered by the limited spatial resolution of these instruments which does not allow the separation of the very different surface brightness components, present in NGC 253. We compare our findings with results from other X-ray investigations (including ASCA and BeppoSAX) and with other wavelengths and discuss the emission components in view of starburst driven super-wind models.
2 Observations and point source analysis
| Energy | off-axis angle | ||||
|---|---|---|---|---|---|
| (keV) | 0′ | 5′ | 10′ | 15′ | 20′ |
| 0.3 | 38″ | 38″ | 41″ | 50″ | 65″ |
| 1.0 | 24″ | 24″ | 29″ | 40″ | 58″ |
NGC 253 was observed with the ROSAT HRI and PSPC for 57.7 ks and 22.8 ks, respectively. For the analysis all available ROSAT observations of the PSPC and HRI have been merged. Details of the observations and methods used to derive the X-ray point source catalog are described in Paper I. The analysis of extended emission components is based on the corrected event files and images created for Paper I’ and on additional procedures using the ESO-MIDAS/EXSAS (ESO-MIDAS 1997, Zimmermann et al. 1997) software package. While the higher resolution of the HRI detector allows us to resolve the bright nuclear and X-ray plume area, the lower instrumental background, the energy resolution and the high collecting area in the 0.1–0.4 keV band makes the PSPC best suited for studying large-scale diffuse emission in the disk and halo of the galaxy.
Separating diffuse emission components from point source contributions is an ambitious task keeping in mind the limited spatial resolution of the ROSAT PSPC detector. To lose as little area as possible, point sources contained in the source catalog of Paper I were cut out with radii optimized to the point spread function (PSF) of the telescope/detector at the relevant energy (see Table 2). Details on rejected sources and corresponding cut radii are mentioned below when describing the methods used to characterize diffuse emission. To keep the uncertainty low, the derived diffuse fluxes and luminosities are not extrapolated for the full area in the standard procedure. To improve the estimates for the nuclear area we use the higher resolution data of the HRI (see Sect. 3.2.1).
The point source catalog of Paper I contains 73 sources in the NGC 253 field, 32 of which are associated with the disk of the galaxy. Though 27 of these sources are detected with the HRI (some being resolvable with the PSPC), the remaining 5 PSPC-only detected sources are most likely due to fluctuations within the diffuse X-ray emission (see Figs. 2 and 4 of Paper I). The area around the nucleus is resolved into a bright, mildly absorbed point source (X33, most likely a black hole X-ray binary) and a more highly absorbed, slightly extended nuclear source embedded in bright diffuse X-ray emission from the X-ray plume (already detected in Einstein observations, see Fabbiano & Trinchieri 1984, Fig. 2). The halo of NGC 253 is filled with diffuse, filamentary X-ray emission (cf. Fig. 1). While four of the sources detected within this region are most likely background active galactic nuclei (AGN, as suggested by time variability arguments and proposed optical identification), two PSPC-only detected sources (X24 and X27 of Paper I) are most likely spurious detections caused by local enhancements in the diffuse emission. X10, another PSPC-only detected extended source in the NW halo, might be a background cluster of galaxies, as it shows a harder spectrum than the surrounding diffuse emission.
3 Analysis of diffuse emission and results
Several methods are used to characterize the diffuse X-ray emission components of NGC 253. Iso-intensity contour maps exhibit the point sources and diffuse emission with high resolution for the HRI. The maps are split up in several energy bands, however with lower spatial resolution for the PSPC. The images in different PSPC energy bands can be combined to a “true” colour image of the galaxy. We further investigate the emission components with respect to spatial distribution (box profiles along major and minor axis and azimuthal profiles for different energy bands and the X-ray plume region) and spectral behavior (e.g. integrated spectra of nuclear component, X-ray plume, disk, and halo, temperature profiles of the halo). In the following subsections we describe the procedures used for the analysis and we present a first discussion of results.
3.1 Iso-intensity contour and ”true” colour maps
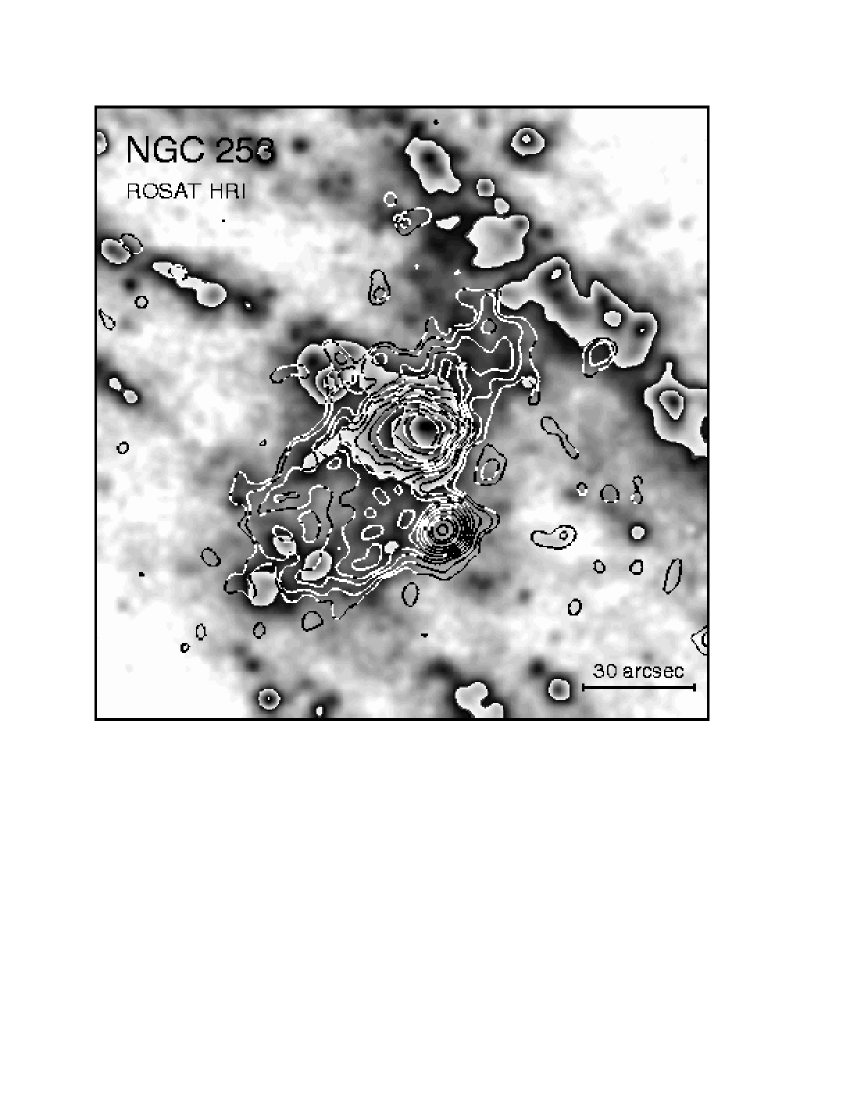
The central area is best imaged with a contour plot from the HRI data. We have used an image with a bin size of 1″, selecting only raw channels 2–8 to reduce the background caused by UV emission and cosmic rays, and smoothed it with a Gaussian filter of 5″ FWHM, corresponding to the on-axis HRI PSF (cf. Fig. 3 of Paper I and Fig. 7). The image shows two bright point-like sources, the central source X34, and X33, embedded in a complex bright diffuse emission structure that is elongated in NW–SE direction with a maximal width of 45″ (560 pc) protruding 60″ (750 pc) from the nuclear source X34 to the SE, and 40″ (500 pc) to the NW. While the source 20″ south of the nucleus (X33) is a time variable point source (FWHM 5″, see Paper I), the source close to the nucleus (X34) is extended (FWHM 23″ and 19″, i.e. 290 pc and 240 pc in east/west and north/south directions, respectively), with the intensity maximum offset by 83 to the SE of the nucleus, possibly representing the hottest part of the gas out-flowing from the nuclear starburst region (cf. Paper I).
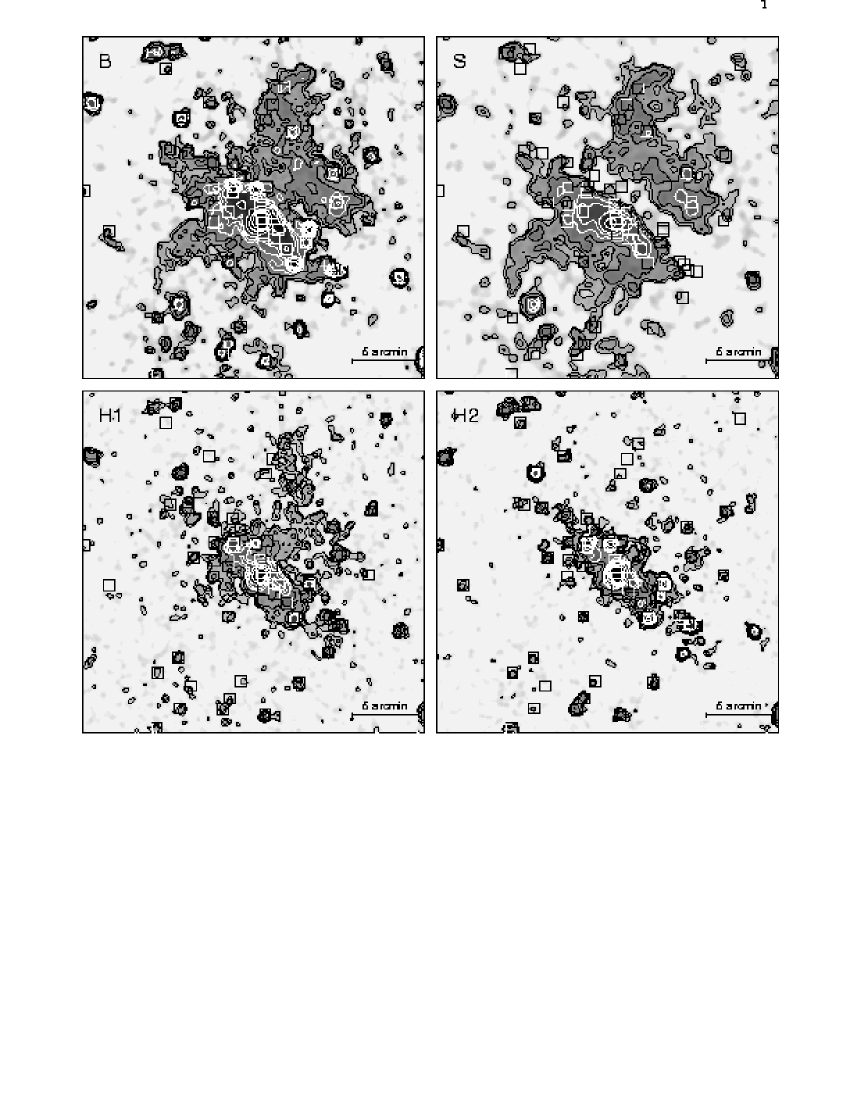
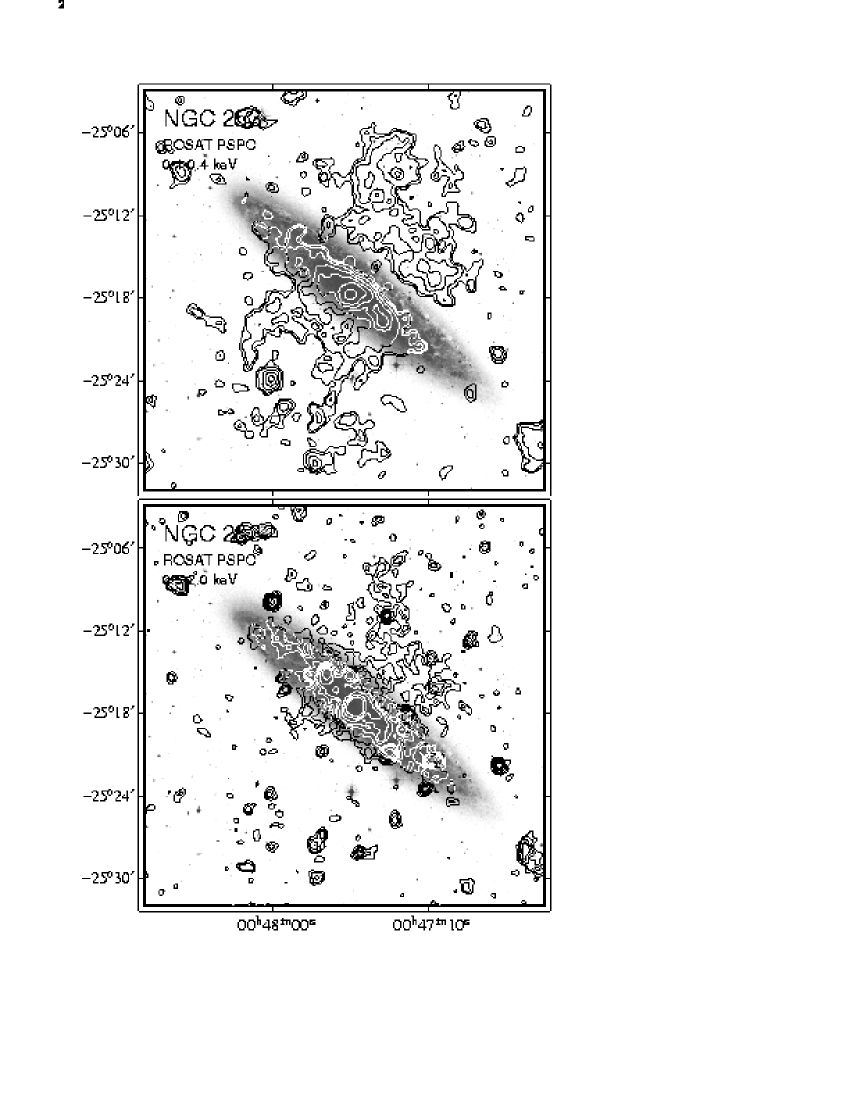
For the PSPC data, contour plots were obtained from images constructed by the superposition of sub-images with 5″ pixel size in the 8 standard bands (R1 to R8, cf. Snowden et al. 1994). All sub-images were corrected for exposure, vignetting, and dead time, and were smoothed with a Gaussian filter of a FWHM corresponding to the on-axis point spread function (PSF) of that particular energy band. The FWHM values used a range from 52″ to 24″. In Fig. 1 contour plots are overlaid on grey scale images of the X-ray emission for the broad (0.1–2.4 keV, upper left), soft (0.1–0.4 keV, upper right), hard1 (0.5–0.9 keV, lower left), and hard2 (0.9–2.0 keV, lower right) band, respectively.
Visual inspection of the sub-images reveals several components of diffuse emission:
-
•
Emission outside of the disk is absent in the hard2 map, and only present in the NW hemisphere in the hard1.
-
•
The soft emission in both halo hemispheres suggests a filamentary structure that cannot be fully resolved due to the limitations of the ROSAT PSPC PSF.
-
•
The diffuse emission in the soft band in the SE shows a flat maximum (projected distance of about 45″ SE of the NGC 253 nucleus) and seems to floats on the disk like a spectacle-glass (diameter of 16′ 12 kpc), from which two “horns” protrude (separation at the connection with the diffuse disk emission about 5′ 3.7 kpc) reaching into the SE halo out to a projected distance of more than 7′ (5.2 kpc), being turned inward. The horn emanating from the northern half of the disk is more pronounced.
-
•
The soft emission in the NW (extent 12′ 9 kpc parallel to the disk and 88 6.6 kpc in perpendicular direction) is separated from the emission in the SE by 12 900 pc and also exhibits an inward turned horn-like structure. Again, the horn emanating from the northern half of the disk is more pronounced.
-
•
The emission in the hard bands shows – besides point sources – a strong extended filamentary component from the inner disk that protrudes from a hardly resolved bright nucleus and traces the inner spiral arms. In addition, there is a less structured diffuse component of the disk. From inspection of the sub-bands R6 (0.9–1.3 keV) and R7 (1.3–2.0 keV) we find that the diffuse components vanish in the R7 band.
-
•
Both hard bands reveal emission protruding into the NW halo along the minor axis. While in the hard2 band this component can only be traced for about 1′ 750 pc (mainly in the area with highly reduced emission in the soft band), it extends along the northern horn as far as the soft emission in the hard1 band.
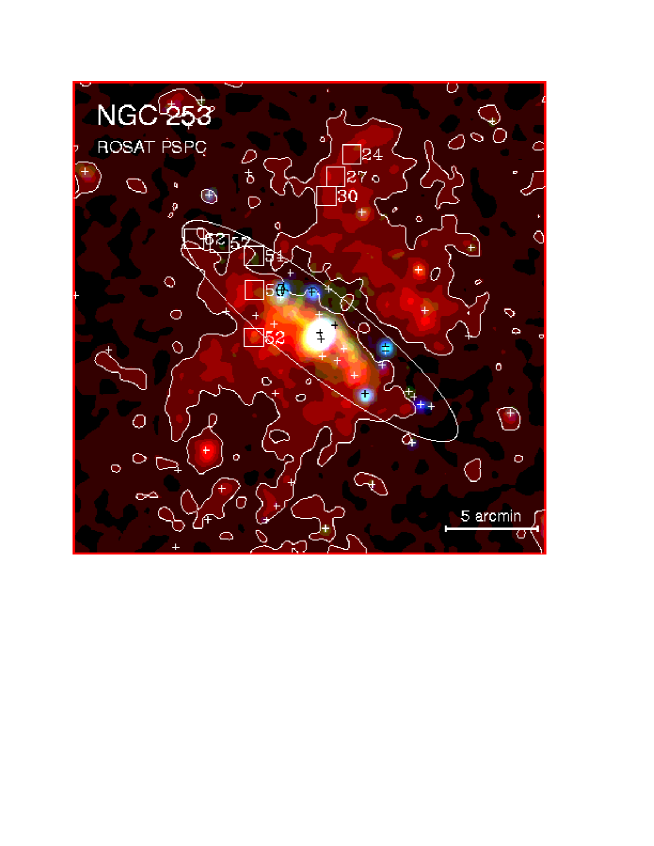
This complex structure manifests itself in the true colour image (Fig. 2) built up from the PSPC soft (red), hard1 (green) and hard2 (blue) band images displayed in Fig. 1. The output image is made up of “pointers” to a special colour look-up table, representing 216 colour blends spanning the possible combinations of 6 intensity levels for each of the basic colours red, green and blue. With this method soft sources appear in red, with a “red” intensity proportional to the intensity in the soft image, harder sources in green and blue. The point sources in the disk area are hard, the greenish colour of the diffuse disk emission suggests a hotter or more strongly absorbed gaseous component compared to that in the halo. The NW rim of the disk is bluer than the SE part which is most probably due to the fact that in the NW one mainly detects hot gas absorbed in the disk while the emission in the SE is a superposition of the softer halo emission in the near halo hemisphere and the disk component from the SE. The greenish colour connecting to the red NW halo again suggests emission from highly absorbed hot gas. Due to the cut values used, the nuclear area is over-exposed.
3.2 Separating diffuse emission components
To quantify the findings of the last subsection, we now derive spatial distributions, spectra and luminosities for the individual diffuse components. Simple power law (POWL), thermal bremsstrahlung (THBR), or thin thermal plasma (THPL) models (Raymond & Smith 1977 and updates) and combinations are fitted to the different components as detailed below. Fits using MEKAL thin thermal plasma models (Mewe et al. 1985 and updates) did not give significantly different results. For the thin thermal plasma model we assume cosmic abundances as the starburst should have enriched the interstellar material with processed material. The statistics of the data and the restricted energy range of the ROSAT PSPC prohibit more detailed modeling.
3.2.1 Diffuse emission from nuclear area and X-ray plume
| Spectrum | Source region | Area | Net counts | Surface brightness | HR1 | HR2 |
|---|---|---|---|---|---|---|
| (arcmin2) | (cts) | (10cts s-1 | ||||
| arcmin-2) | ||||||
| X34 | circle with radius of 20″ around | 0.28 | 100832 | 1585 | 0.920.01 | 0.350.03 |
| nucleus, X33 sector screened | ||||||
| X34_local | as above, but local background | 0.28 | 62838 | 986 | 1.000.03 | 0.430.06 |
| X-ray plume | ring sector around nucleus with | 0.70 | 55325 | 34.61.6 | 0.490.04 | -0.120.05 |
| inner and outer radii of 20″ and | ||||||
| 675 opening angle 90° along SE | ||||||
| minor axis, X33 screened with | ||||||
| radius 26″ | ||||||
| disk | box enclosing the ellipse, | 64.3 | 269083 | 1.830.06 | 0.230.03 | -0.100.03 |
| nuclear area screened | ||||||
| with radius 675 | ||||||
| halo NW | box adjacent to disk | 147.2 | 2590110 | 0.770.03 | -0.330.04 | -0.310.06 |
| along NW minor axis | ||||||
| halo SE | box adjacent to disk | 141.9 | 1437103 | 0.440.03 | -0.750.06 | -0.390.23 |
| along SE minor axis |
| Spectrum | Model | DOF | NH | Index | T | f | f | L | L | |
|---|---|---|---|---|---|---|---|---|---|---|
| (1020 cm-2) | (keV) | (10-13 erg cm-2 s-1) | (1038 erg s-1) | |||||||
| X34 | POWL | 1.53 | 31 | 5.6 | 70 | 4.5 | 56 | |||
| (S/N5) | THBR | 1.53 | 31 | 5.6 | 17 | 4.5 | 13 | |||
| THPL | 2.78 | 31 | (4.5) | (130) | (3.6) | (110) | ||||
| THBR | 1.09 | 30 | 4.8 | 16 | 3.8 | 13 | ||||
| +THPL | 0.8 | 0.8 | 0.7 | 0.7 | ||||||
| X34_local | POWL | 0.93 | 12 | 3.8 | 54 | 3.0 | 43 | |||
| (S/N5) | THBR | 0.94 | 12 | 3.7 | 13 | 3.0 | 10 | |||
| THPL | 1.22 | 12 | 3.2 | 120 | 2.6 | 96 | ||||
| X-ray plume | POWL | 1.67 | 17 | 3.2 | 22 | 2.6 | 17 | |||
| (S/N5) | THBR | 1.64 | 17 | 3.0 | 6.2 | 2.4 | 4.9 | |||
| THPL | 4.4 | 18 | (2.2) | (2.2) | (1.8) | (1.8) | ||||
| THBR | 1.37 | 16 | 1.5 | 2.3 | 1.2 | 1.8 | ||||
| +THPL | 1.1 | 1.1 | 0.9 | 0.9 | ||||||
| disk | POWL | 1.46 | 44 | 14.8 | 75 | 11.9 | 60 | |||
| (S/N5) | THBR | 1.31 | 44 | 13.8 | 23 | 11.0 | 18 | |||
| THPL | 5.8 | 45 | (10.1) | (10.1) | (8.1) | (8.1) | ||||
| THPL1 | 1.07 | 42 | 4.2 | 15.3 | 3.4 | 12.2 | ||||
| +THPL2 | 9.8 | 9.8 | 7.8 | 7.8 | ||||||
| halo NW | POWL | 1.50 | 18 | 12.3 | 75 | 9.8 | 60 | |||
| (S/N5) | THBR | 1.14 | 18 | 12.3 | 18 | 9.8 | 14 | |||
| THPL | 3.8 | 19 | (12.7) | (12.7) | (10.1) | (10.1) | ||||
| THPL1 | 1.18 | 17 | 9.1 | 9.1 | 7.2 | 7.2 | ||||
| +THPL2 | 3.2 | 3.2 | 2.5 | 2.5 | ||||||
| halo SE | POWL | 2.1 | 9 | (9.2) | (9.2) | (7.3) | (7.3) | |||
| (S/N4) | THBR | 2.2 | 9 | (7.0) | (7.0) | (5.6) | (5.6) | |||
| THPL | 2.9 | 9 | (6.2) | (6.2) | (5.0) | (5.0) | ||||
| THPL1 | 2.6 | 7 | (6.1) | (6.1) | (4.9) | (4.9) | ||||
| +THPL2 | (0.8) | (0.8) | (0.6) | (0.6) | ||||||
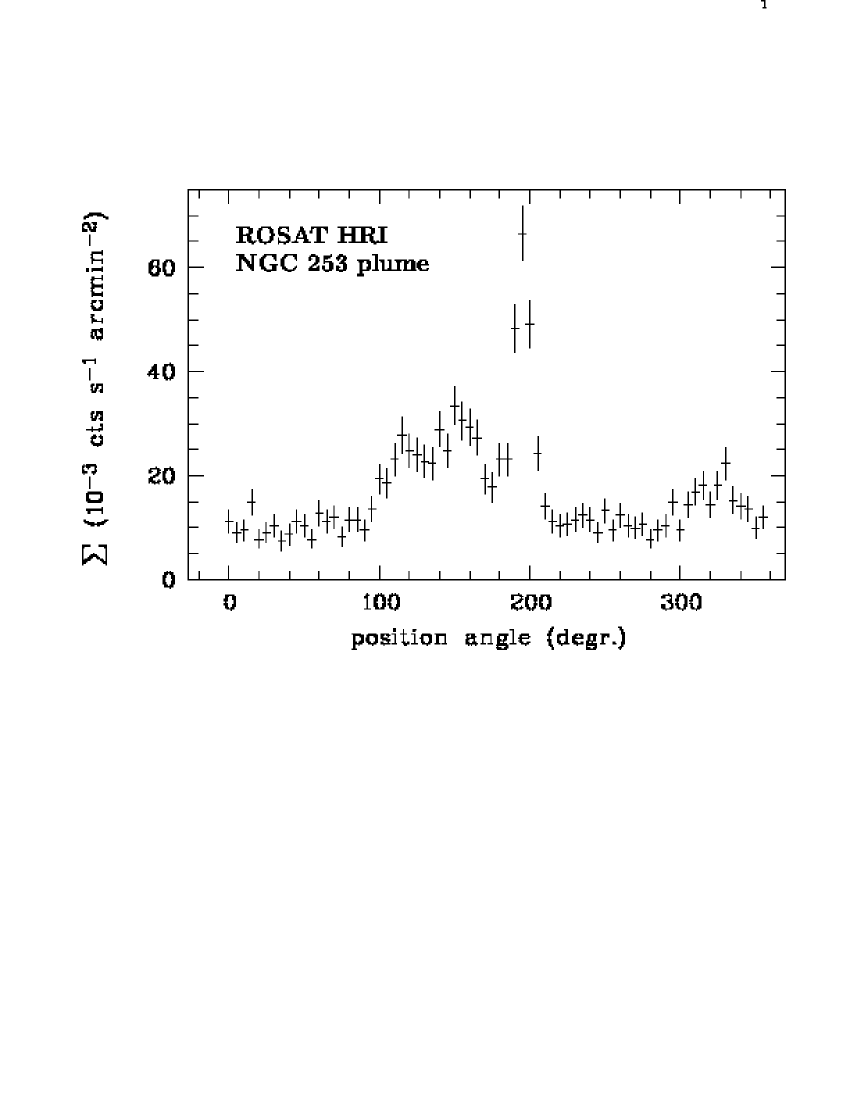
As demonstrated in Paper I, the nuclear source (X34) peaks at , with a 90% error radius (including systematics) of , and that it is clearly extended. Outside a radius of 15″ there is a continuous transition to the diffuse emission along the minor axis (cf. Fig. 3 of Paper I). The angular distribution of the emission components resolved with the HRI with respect to the position of the nucleus can be viewed in the azimuthal plot of the surface brightness in the central area (radius 1′, Fig. 3), integrated over sectors of 5°. In order to avoid the bright emission, the nuclear source was cut out with a radius of 15″. Above a background level of counts per sector (determined in sectors 0°–90° and 210°–300°) cts s-1 arcmin-2 , three excesses can be identified:
-
1.
A bright peak ( integrated counts above background) at 195° represents the point source X33. The number of counts extracted for X33 by this method is consistent with the results reported in Sect. 3.2 of Paper I ( cts) derived with a different method.
-
2.
A broad, slightly asymmetric double-peak structure (FWHM 75°, excess counts in sector 100°–175°) centered at position angle 145° is due to the extended emission to the SE along the minor axis. The two peaks at position angles 120° (FWHM of 35°, excess counts in sector 100°–135°) and 150° (FWHM of 45°, excess counts in sector 140°–175°) may reflect a cone-like emission structure along the minor axis of NGC 253 (position angle 142°), with an opening angle of 30° originating from the galaxy nucleus.
-
3.
A broad peak (FWHM 35°, excess counts in sector 305°–345°) centered at position angle 325° is due to the extended emission to the NW along the minor axis and pointing directly opposite to component two. According to Fig. 3 of Paper I the emission is less extended than that originating from the nuclear area. This may be explained by higher absorption in this direction (see discussion below).
To further characterize the diffuse nuclear emission components, we made use of the spectral capabilities of the PSPC. This investigation, however, is hampered by the larger PSF of the PSPC compared to the HRI. Especially in the soft energy band (FWHM of PSF 40″) the emission components separated by the HRI are difficult to resolve,and therefore only crude spectral parameters and luminosities can be derived. A better estimate of the luminosities of the nuclear source (X34) and the X-ray plume can be obtained by converting count rates from the ROSAT HRI detector to fluxes using the PSPC-derived spectral parameters (see below). Detailed results for the point source X33 south of the nucleus were already discussed in Paper I.
Here we present source spectra for the extended nuclear source (X34) and the X-ray plume. The spectrum of X34 was extracted with a cut diameter of 40″. To suppress contributions from the nearby source X33, a 70° sector in the direction of the source was excluded from the integration. We have used both, the background from the field outside the galaxy, used for all other spectral investigations, and a locally defined background. The spectrum of the extended emission along the SE minor axis (X-ray plume) was extracted from a sector with opening angle 90° outside the nucleus excluding X33 (with a circle radius of 26″, corresponding to twice the expected FWHM of the PSF of a hard source). Table 3 summarizes the regions for source and background and gives net counts and hardness ratios HR1 and HR2 (see Paper I for definitions). The hardness ratios indicate a highly absorbed and rather steep spectrum for the nuclear source, while the X-ray plume is less absorbed and much softer (cf. Pietsch et al. 1998). We then used simple absorbed spectral models to fit the data in the different regions, as indicated in Table 4. Reduced , number of degrees of freedom (DOF), absorption column, photon index for power law and temperature for thermal spectra are given. Raw spectra were rebinned to obtain at least the signal to noise level per bin given in Col. 1 of Table 4. We give fluxes and luminosities outside the Galaxy (f and L, measured NH minus Galactic NH), as well as intrinsic to the source (f and L, i.e. absorption zero). Rough errors for the fluxes and luminosities in Table 4 are indicated by the statistical errors of the net counts (see Table 3). Additional uncertainties arise from the poor knowledge of the spectrum, as can be seen by comparing the fluxes derived for different models.
When the field background is used, simple power law (POWL), thermal bremsstrahlung (THBR), or thin thermal plasma (THPL) spectra with cosmic abundances (Raymond & Smith 1977 and updates) do not allow a proper description of the nuclear spectrum (X34). If, however, the spectrum is corrected for the local background, the first two models fit the nuclear spectrum quite well, and also a THPL approximation cannot be totally rejected. All models indicate high absorption (NH of a few times 1021 to more than 1022 cm-2) and rather soft spectra (photon index 2.9 or temperatures from 0.4 to 1.2 keV). This suggests that with the local background the soft extended emission above the nuclear area is properly subtracted. We have therefore attempted to take it into account by fitting a more complex model to the data derived using the field background. We have assumed a two-component model composed of a THBR spectrum with the temperature fixed to 1.2 keV (the value determined using local background) and a THPL spectrum using cosmic abundance with fixed Galactic absorption. This resulted in an acceptable fit. For the THBR component flux and absorption are consistent with the values for the local background spectrum, and for the THPL component we derive a temperature of 0.44 keV.
For the X-ray plume, POWL and THBR spectra yield and therefore are hardly acceptable, while a THPL with cosmic abundance clearly has to be rejected (). Assuming a two-component model of a THBR with the temperature fixed to 1.2 keV - the value fitted for the nucleus using local background - and additionally a THPL spectrum with cosmic abundance, fixed to Galactic absorption, leads to an acceptable fit. The THBR component is much less absorbed than for the nucleus and the temperature of the THPL with 0.3 keV a bit cooler than for the nuclear spectrum.
As mentioned above, the spatial resolution of the ROSAT HRI allows us to separately estimate the contribution from X34, the X-ray plume, and the point source X33. From the numbers given in Paper I we determine ROSAT HRI count rates of () and () cts s-1 for the nuclear source (local background subtracted) and the X-ray plume, respectively. Using the X34_local THBR model parameters from the PSPC, the count rates for the nuclear source give an intrinsic luminosity of erg s-1, slightly higher than the PSPC value. For the X-ray plume, the soft and hard component of the PSPC-based two-component model lead to contributions to the HRI count rates that are a factor of 1.3 higher for the THBR than for the THPL component. Also the soft component of the X34 spectrum - that is even hotter than the X-ray plume component - has to be added to the HRI flux. Therefore we estimate that the THBR and THPL component contribute with a ratio of 3 to 4 and we assume a THPL temperature of 0.4 keV (average of X34 and X-ray plume values). With these assumptions we calculate intrinsic luminosities of 4.6 and 4.0 erg s-1 for the THBR and THPL components of the X-ray plume spectrum, respectively. These values are about a factor of four above those derived with the PSPC. The difference is caused by the PSPC extraction strategy: We used only part of the PSF area of X34 for the spectrum to reject contributions for X33. Also the rejection radii for X33 and X34 strongly reduce the area for the X-ray plume spectrum.
However, we have to place a caveat here. It is clear from the structured HRI and energy-resolved PSPC images that more than two components contribute to the spectra. They originate from the nuclear area, X-ray plume, disk and halo and certainly are seen through different amounts of absorbing matter. Using a local background for the nuclear spectrum allows us to reduce the influence of the surrounding components. Nevertheless, the assumed spectral models will be a simplification. The fact that a thermal bremsstrahlung or power law spectrum fit best for the absorbed nuclear component and also for the absorbed component of the X-ray plume, should not be over-interpreted but may only reflect that several thin thermal components of differing temperature add up to the spectrum. This may be an artefact of the limited energy coverage and resolution of the ROSAT PSPC, and can hopefully be resolved with the next generation of X-ray instruments.
3.2.2 Diffuse emission from disk and halo
To investigate the diffuse emission from the disk and halo we make use of the nearly homogeneous sensitivity of the PSPC for low surface brightness features in the area within the ring of the window support structure (21′ radius). We examine box profiles along the galaxy axes, azimuthal profiles, and spectra integrated over different areas. To suppress contributions from point sources we follow a different strategy in creating profiles for the individual energy bands and in extracting spectral files.
When creating profiles in the soft band, we cut out only sources outside the disk and X15 using a cut radius of FWHM of the PSF at 0.30 keV, since no source from the point source catalog coincides with a point source in the soft band in the disk area (within corrected D25). Furthermore, X24, X27, and X30 (see Fig. 2) in the NW halo are not cut out as they are most likely “spurious” sources (local enhancements in the diffuse emission, X24 and X27), or were not visible during the PSPC observations (X30).
In the hard band, we cut out sources both in and outside of the disk. Outside we followed the same procedure as for the soft band, inside we cut out all sources from the catalog, with the exception of the extended nuclear source (X33) and the PSPC only detected sources X50, X51, X52, X57, and X62 (see Fig. 2), most likely representing local enhancements in the diffuse emission in the disk. For the cut radius in the hard band we used FWHM of the PSF at 1.0 keV.
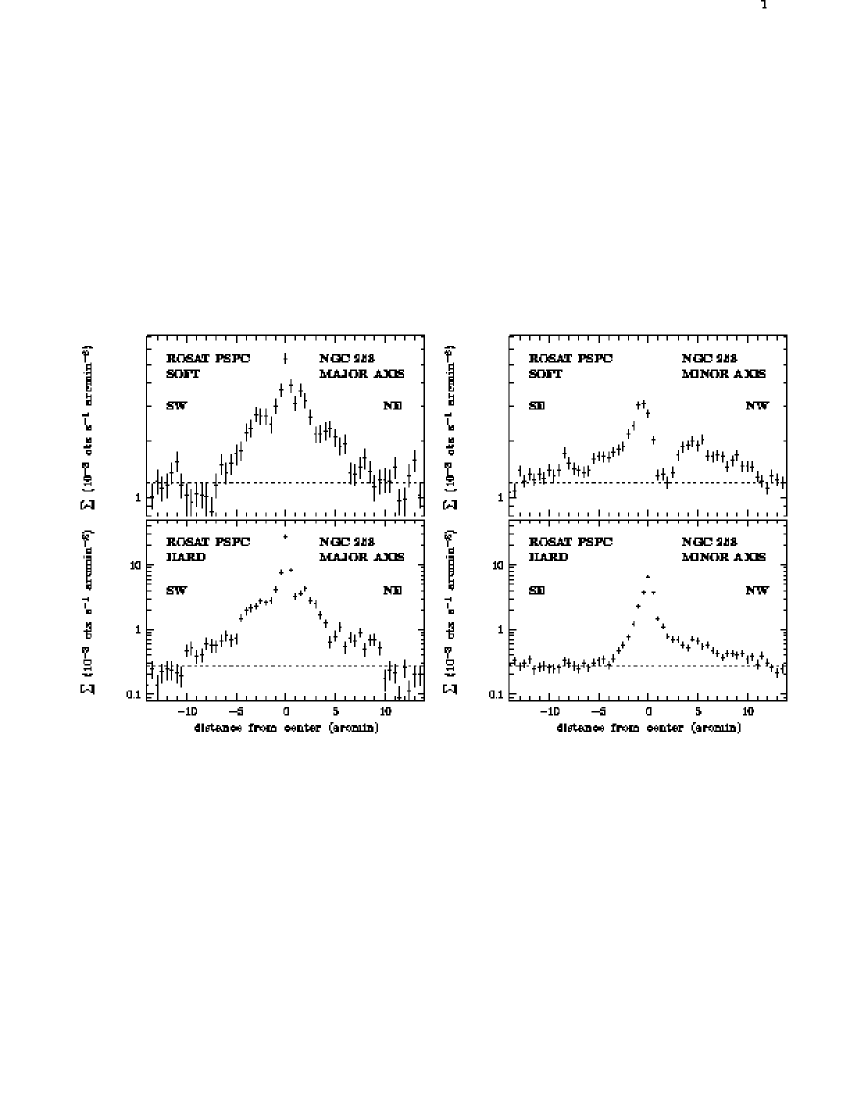
The spatial variation of the surface brightness distribution along the major axis of NGC 253 (Fig. 4) was derived by integrating counts in the soft and hard band in boxes of 30″ width along this axis. The boxes cover perpendicular to the axis which corresponds to the maximum extent along the minor axis of the inclination corrected D25 ellipse of NGC 253 (see Fig. 2). It is clear from Figs. 1 and 2 that by using this size of box perpendicular to the major axis of the edge-on galaxy, one only traces emission components from the disk and/or from the halo immediately above or below the disk. The neglected emission from the outer halo hemispheres is covered in the profile along the minor axis (boxes of 30″ width along the minor axis and the corrected D25 of 188 in the direction of the major axis, Fig. 4), and in profiles along axes parallel to the major axis but offset to the SE and NW such that the covered strips are adjacent to the major axis profile (boxes of , Fig. 5). The background surface brightness is determined from the minor axis count rates at distances . In this way, we utilize the high count statistics due to the biggest box size used for the different profiles and avoid a possible reduction of the extragalactic background due to absorption by an H i disk extending further along the major axis than the galaxy’s X-ray emission, as observed in some other galaxies (e.g. M101, Snowden & Pietsch 1995; NGC 55, Barber et al. 1996; NGC 4559, Vogler et al. 1997).
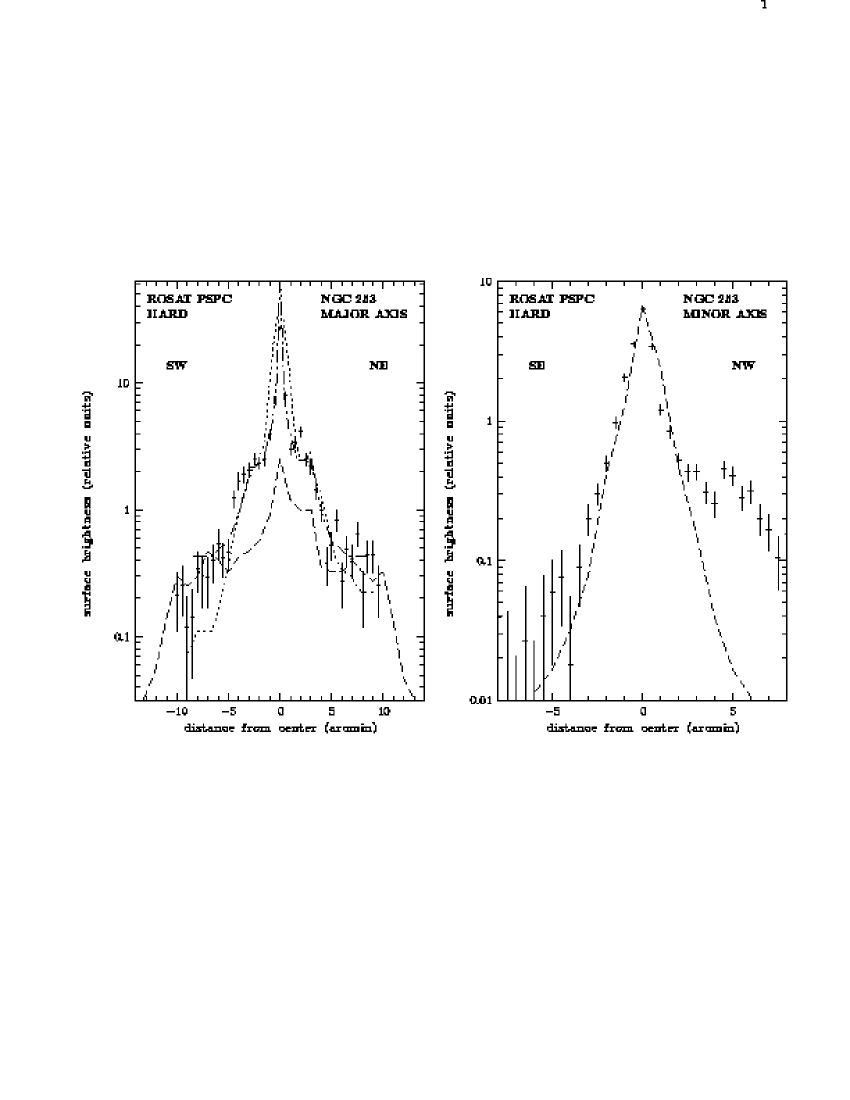
Along the major axis, the soft- and hard-band profiles show a bright nuclear component on top of a distribution that declines more or less symmetrically with distance from the nucleus (Fig. 4). In the hard band the distribution is composed of two distinct components with extents of 45 and 10′ (3.4 kpc and 7.5 kpc) from the nucleus. By way of contrast the soft-band distribution is made up of just one component with an extent of 6′ (4.5 kpc), which can be accounted for by absorption due to interstellar material within the disk. This is why we detect more emission from a plane above the disk that is facing the line-of-sight (SE disk corona). The hard band profile is less effected by absorption and traces emission from within, above and below the disk.
Along the minor axis, the soft and hard band profiles differ drastically (Fig. 4). The hard-band profile is dominated by a bright core, positioned symmetrically about the nucleus that can be traced out to 4′ (3 kpc) to the SE, while to the NW is masked by a second component, with an exponential decline out to 12′ (9 kpc). In the soft band the maximum is shifted to the SE by 45″ relative to the hard maximum, and it is not symmetric. To the SE, the bright core component drops within 3′ (2.2 kpc) and then decreases more or less exponentially out to 12′ (9 kpc) from the nucleus. In the NW, the profile first drops within 1′ (750 pc) from the nucleus to just above the background level. Then, starting at a distance of 2′ (1.5 kpc), the emission gradually recovers to a maximum at 4′ (3 kpc), before it finally fades exponentially to background level at a similar distance from the nucleus as in the SE. Apart from the trough, the intensity in the NW is about 1.5 times that in the SE at similar offsets from the nucleus.
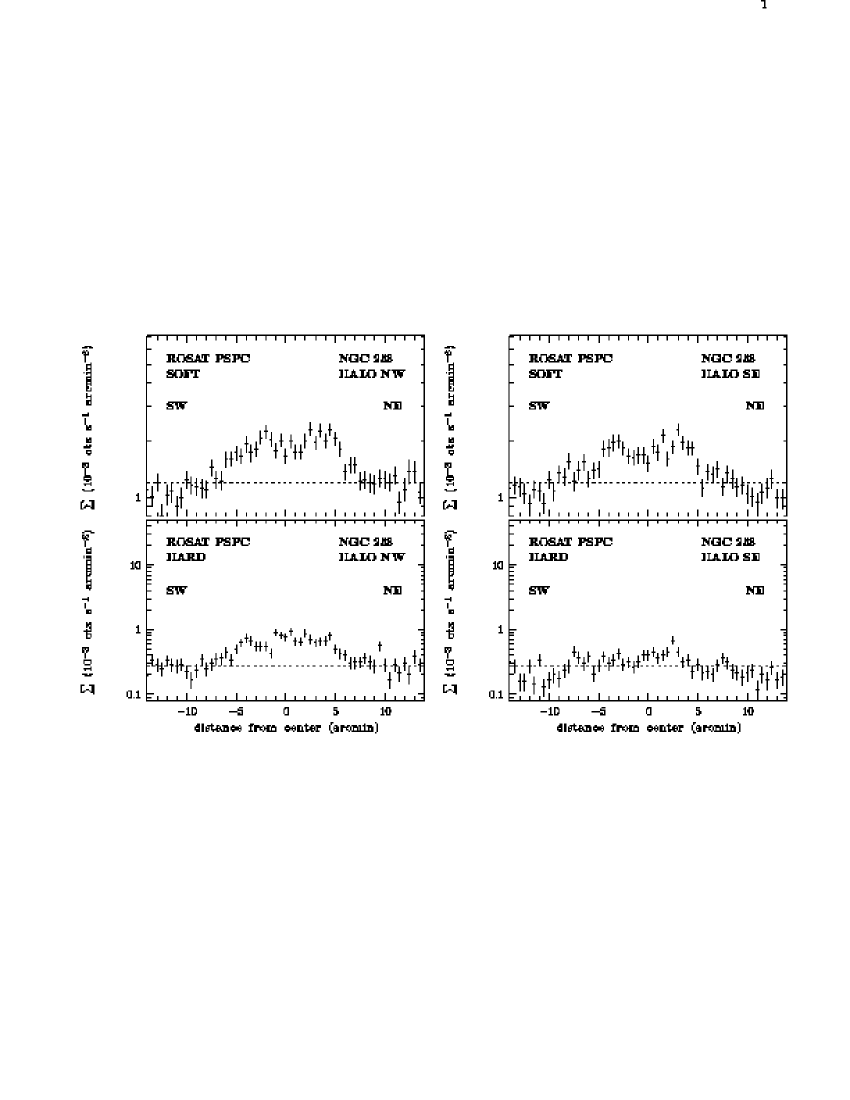
Parallel to the major axis to the NW and SE (Fig. 5), the soft profiles show emission above the background out to projected distances from the nucleus of 6′ (4.5 kpc). The profiles are double-peaked (broad maxima at offsets from the nucleus of 35 2.6 kpc), reflecting the horn-like structure of the soft halo emission seen in Figs. 1 and 2. In the hard band, excess emission is clearly seen in the NW out to similar distances as in the soft band. In the SE hard profile there is only a slight excess at a projected distance of 25 (1.9 kpc) from the nucleus to the NE, at the base of the corresponding horn-like structure in the images.
To further characterize the diffuse emission components from the disk and halo, we analyzed PSPC spectra, integrated over areas summarized in Table 3. In preparing the spectral files, we removed photons from source areas that were rejected from the soft and hard profiles (see above) using cut radii of FWHM of PSF at 0.3 or 1.0 keV (depending on wether the sources were cut out in both bands or just in the hard one). Results of fitting simple models are also given in Table 4.
For the disk spectrum, POWL and THBR models yield and therefore are hardly acceptable, while a single-temperature THPL with cosmic abundance clearly has to be rejected (). However, a two-temperature cosmic abundance THPL model with the absorbing column of the softer component fixed to the Galactic foreground results in an acceptable fit. In this model, one would assign the unabsorbed 0.20 keV ( K) component to the hot gas above the disk and the absorbed 0.7 keV ( K) component to the hot interstellar medium within the disk. A even better approximation to reality would certainly require models with more temperatures and absorbing columns. However, due to the limited statistics and spatial and spectral resolution of the ROSAT PSPC data, more detailed modeling proves impossible.
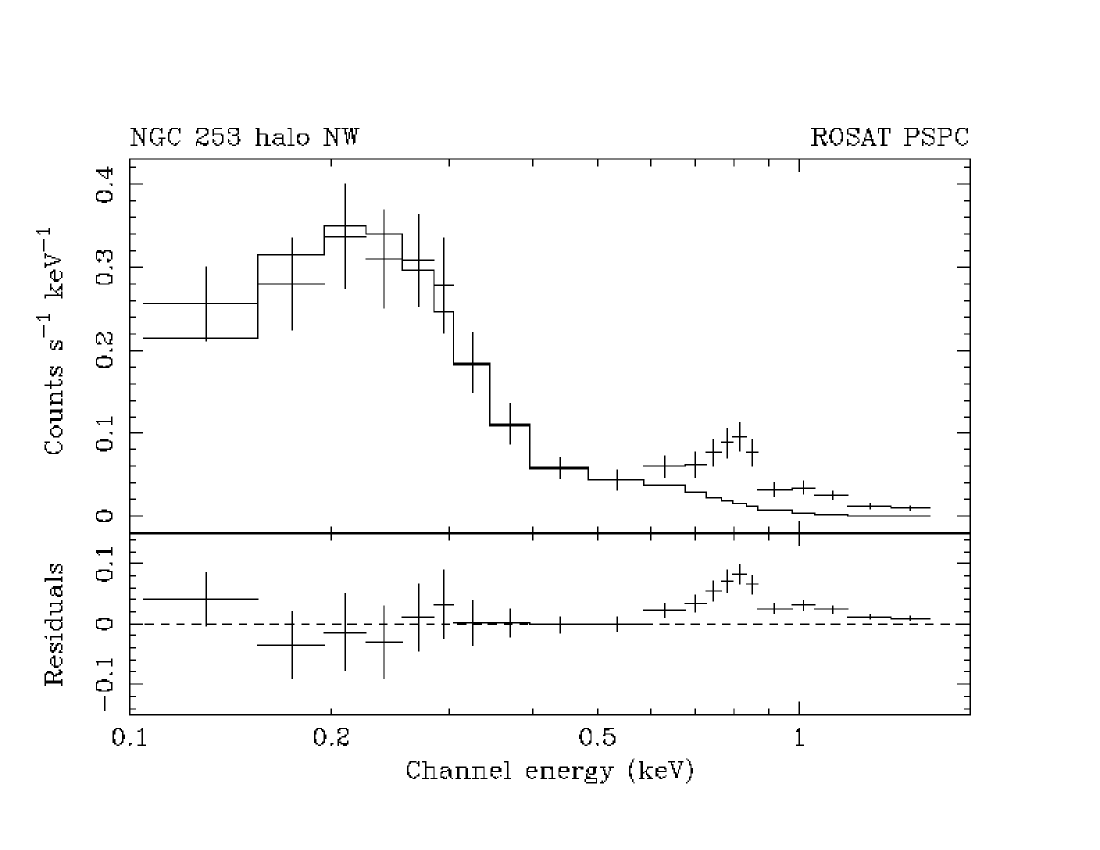
For the NW halo spectrum, POWL and THBR model approximations result in barely acceptable fits not just from but also from systematics in the residuals between models and data. A cosmic abundance THPL model approximation is not acceptable (). If restricted to the energy range 0.1 – 0.5 keV, a cosmic abundance THPL model with absorption fixed to the Galactic foreground and a temperature of 0.15 keV results in an acceptable fit (see Fig. 6). Acceptable fits in the full 0.1 – 2.4 keV range can be achieved by adding additional emission components such as a second (hotter) thin thermal gas component or Gaussian lines at around 0.8 and 1.1 keV to such a spectrum.
For the SE halo spectrum we obtain similar results. However, due to the poor photon statistics, the findings are less significant. Opposite to the NW halo, also a two temperature THPL model doesn’t give an acceptable fit. Without acceptable fits we cannot provide confidence regions for the fitted temperatures to compare them to the NW halo hemisphere. This problem can be overcome in using the X-ray hardness ratios as a crude information on the spectral shape. For the SE halo, HR1 is smaller than for the NW halo (HR1 = -0.420.10) while the HR2 values coincide within the errors (see Table 3). This clearly indicates a significantly softer spectrum in the SE halo (see Fig.1 in Pietsch et al. 1998).
To make sure that the problems with fitting simple models to the halo spectra were not caused by the special selection of the halo regions we subdivided both halo areas into five boxes of 2′ width along the minor axis. Within the limits of the reduced statistics we obtained similar results. Specifically the residuals at 0.7 keV and above were present in all regions in the NW halo. This is consistent with the detection of hard-band emission from the entire NW halo region that was already reported following the brightness profile analysis above. No significant temperature change could be established within the individual halo hemispheres.
4 Discussion
In the following we will compare the diffuse emission components of NGC 253 presented in Sect. 3 to previously reported X-ray results for this galaxy. The individual diffuse emission components are compared to observations of NGC 253 at other wavelength regimes, as well as to results from other spiral galaxies. We also derive parameters for the dense interstellar material in the disk of NGC 253 from its apparent shadowing of X-ray emission in the NW halo. The findings are discussed in view of starburst and super-wind models.
4.1 X-ray luminosity of NGC 253 emission components
| Component | Spectral model | NH | T | count rate | L | L | L | |
| (1020 cm-2) | (keV) | (10-3cts s-1) | (1038 erg s-1) | |||||
| X34_local | THBR | 30 | 1.2 | 28 | 3.0 | 3.0 | 11 | |
| X-ray plume | THBR | 3 | 1.2 | 46 | 4.1 | 4.6 | 6.9 | |
| +THPL | 1.3 | 0.33 | 47 | 3.3 | 4.0 | 4.0 | ||
| disk | diffuse | THPL1 | 95 | 0.7 | 37 | 3.3 | 3.4 | 12.2 |
| +THPL2 | 1.3 | 0.20 | 78 | 5.7 | 7.8 | 7.8 | ||
| halo NW | THPL1 | 1.3 | 0.13 | 93 | 6.0 | 7.2 | 7.2 | |
| +THPL2 | 1.3 | 0.62 | 22 | 2.1 | 2.5 | 2.5 | ||
| halo SE | THPL1 | 1.3 | 0.10 | 55 | 1.9 | 4.9 | 4.9 | |
| +THPL2 | 1.3 | 0.52 | 6 | 0.5 | 0.6 | 0.6 | ||
| total | diffuse | 412 | ||||||
| disk | point sources | 94 | 8 | 10 | (130) | |||
| total | 506 | (190) | ||||||
As described in Paper I and in the previous section, the complex X-ray emission of NGC 253 can be separated into contributions from point sources and diffuse emission. The diffuse emission originates from the nuclear area, the X-ray plume, the disk and from both halo hemispheres. In Table 5 we summarize the contributions of these components to the ROSAT PSPC count rate and give luminosities in the ROSAT band, derived from the best fitting spectra (see Table 4). For the halo emission we use parameters derived for the two temperature thin thermal plasma models. L is the absorbed luminosity as measured at the detector surface, L the luminosity corrected for Galactic foreground absorption of 1.3 1020 cm-2, and L the intrinsic luminosity assuming no absorption at all. While the results for the first two are rather robust against model uncertainties due to the low Galactic foreground absorption, the values for the intrinsic luminosity – especially for the highly absorbed components – are very sensitive to changes in the model parameters and therefore have to be taken with care.
It is evident from the overall count rate budget in Table 5, that to first order, all components contribute similar amounts. Due to the spatial resolution of the PSPC, it was possible to separately characterize each component’s spectrum. As discussed below, most of the components were already suggested in Einstein observations. However, they could not be investigated in detail due to lack of statistics, and spatial and spectral resolution of the Einstein IPC. In previous publications, ROSAT data for NGC 253 were analyzed in investigations of samples of spiral and nearby edge-on starburst galaxies. The special merits of ASCA and BeppoSAX observations of the galaxy are the improved spectral resolution and range to higher energies covered. However, due to the comparatively low spatial resolution, the missing response below 0.5 keV and the limited statistics, not all components identified above can be spectrally resolved. Within these limitations, the results of the other investigations support ours.
A detailed analysis of the Einstein HRI data of NGC 253 by Fabbiano & Trinchieri (1984) already revealed emission from several point sources in the galaxy as well as diffuse emission from the nucleus, along the minor axis to the SE and from the inner disk. Assuming a 5 keV thermal bremsstrahlung spectrum with Galactic foreground absorption for the nucleus and disk and a 0.5 keV thermal plasma spectrum for the X-ray plume, they derived luminosities in the 0.2–4 keV band (corrected to the NGC 253 distance of 2.58 Mpc used here) of (8, 3.3 and 10) erg s-1, respectively. Taking into account the difference in the model spectra and energy band, these values are consistent with our results. The analysis of the Einstein IPC observations of the galaxy by Fabbiano (1988) demonstrated that the emission profile from the inner disk of NGC 253 along the major axis closely follows the radio continuum emission. In addition extended emission was found from the northern side of the galaxy and attributed to gaseous clouds ejected from the starburst nucleus (luminosity erg s-1). From the southern halo no emission was detected with the Einstein instruments. This, however, is not surprising since the collecting area of the Einstein IPC was very low in the ROSAT PSPC soft band, where all emission for this component is detected. The limited spatial and spectral resolution as well as the lack of statistics hindered detailed spectral investigations with the Einstein IPC.
Earlier analysis of ROSAT data did not discern the different emission components of NGC 253 in greater detail and therefore the results were still preliminary. The galaxy was e.g. analyzed as part of a sample of nearby spiral galaxies observed with the ROSAT PSPC (Read et al. 1997). For the sample galaxies, one- ore two-component spectra were fitted to the emission as a whole and to the point sources and diffuse emission, individually. For NGC 253, the authors found an integral and diffuse luminosity of (8.1, 5.9) erg s-1 (0.1-2 keV, corrected for a distance of 2.58 Mpc), respectively. The fraction of diffuse emission of 74% for the luminosity escaping the galaxy compares well to % quoted in Table 5. A one-component thermal plasma only poorly fits the diffuse emission, leading to an absorption compatible with the Galactic foreground, a temperature of 0.47 keV and heavy-element abundances of 0.02 solar. A two-component model, comprising a thin thermal plasma and an absorbed, hard (10 keV) unresolved source component, improved the fit to the diffuse component and indicated that most (90%) of the ’diffuse’ emission is truly cool (0.39 keV), low-metallicity (0.08 solar), diffuse gas, while the rest could be attributed to highly absorbed, hard sources. However, the fit is still not good (), and the authors argued that “a much more complex model, beyond the scope of this work, may be necessary to explain the halo emission from NGC 253 (and, indeed, other starbursts), as a large temperature gradient is believed to exist within the halo of NGC 253”. In our detailed analysis, we could not establish a temperature gradient within the halo as postulated by Read et al.. However we found differing temperatures for the diffuse emission components from the disk, the region immediately above the disk, and the individual halo hemispheres.
Ptak et al. (1997) report on the complex X-ray spectrum of NGC 253 as measured with the ASCA instruments in the energy range 0.5–10 keV, which shows strong emission lines from O, Ne, Fe, Mg, S, and Si above the continuum. Unfortunately, with ASCA it is not possible to spatially resolve point sources from diffuse emission or the different diffuse emission components. The integral spectrum can be fitted by two components, a “soft” component described by a temperature of 0.8 keV and an absorbed “hard” component with a photon index of 2.0 or a temperature of 7 keV. They find that different models (with different continua) yield absolute abundances that differ by more than an order of magnitude, while relative abundances are more robust and suggest an under-abundance of Fe (inferred from the Fe-L complex) relative to -burning elements. The authors also try to derive element abundances from the individual line intensities and argue that for the hard component, they have to be significantly sub-solar (if thermal), or that there is a significant non-thermal or non-equilibrium contribution. The ASCA spectral fit is confirmed by BeppoSAX observations that, similar to ASCA, do not spatially resolve the components, though were, for the first time, able to detect the Fe K line at 6.7 keV (Persic et al. 1998).
ROSAT and ASCA observations of NGC 253 are also included in an X-ray mini-survey of nearby edge-on starburst galaxies (Dahlem et al. 1998). A ROSAT HRI image of the central area of NGC 253 is superimposed onto an H image (see Pietsch (1994) for an overlay onto an optical one), PSPC images in three energy bands, with and without point sources, indicate diffuse emission up to the highest ROSAT band. Spectral results include a joint ROSAT and ASCA spectral study, and an investigation of individual areas with the ROSAT PSPC. Detailed discussions are deferred to a specific paper on NGC 253. In modeling the joint ROSAT ASCA spectrum, integrated over the galaxy as a whole, Dahlem et al. find that the difficulty of measuring multiple absorbing columns causes the largest uncertainty. As an example, they point out that it is impossible to measure the absolute or relative abundances or Fe with the integral spectrum, because NH (which is at least a few times 1021 cm-2 in the direction of the core) trades off directly against the Fe abundance – stronger absorption for Fe L energies than for Si and S lines at higher energies. They therefore conclude that for NGC 253 the absolute and relative abundances derived from the integrated ASCA and PSPC X-ray spectrum are not reliable indicators of the physical properties of the gas. They also briefly discuss spectral modeling of compact sources, core, disk and halo emission. However, the exact procedure is difficult to reproduce. For the core, they do not separate the components of X33, X34, and the X-ray plume, and therefore, the results cannot be directly compared. For the spectrum of the diffuse emission of the disk after point source subtraction, they reduce a local background, and they achieve an acceptable fit for a model that consists of an absorbed power law and a thin thermal (0.25 keV) plasma with solar abundance (which corresponds to our two-component fit). The halo spectrum and three concentric sub-spectra are accumulated, averaging over both halo hemispheres. Their halo spectrum is well fitted with a single temperature thin thermal plasma model with very low abundance. However, they prefer a two-temperature plasma, with temperatures of 0.14 and 0.65 keV and solar abundance with a flux ratio of 4:1 and find no temperature dependence over the halo. The hard spectral component is present in all three halo regions and not just close to the disk. These results are confirmed by our findings for the NW halo. Due to the higher count rate, this hemisphere dominates the averaged spectra and probably masks in their analysis the significantly differing intensity and shape, we found in our analysis of the halo hemispheres.
4.2 Emission from the area of the starburst nucleus and X-ray plume of NGC 253
Following to Sect. 3.2.1 the X-ray emission from the nuclear region of NGC 253 can be separated into at least three components:
-
•
the bright point source X33 about 25″ south of the nucleus, most likely a moderately absorbed black hole X-ray binary within NGC 253 discussed in detail in Paper I
-
•
highly absorbed slightly extended emission SE of the nucleus (X34)
-
•
extended cone-like emission along the minor axis mainly to the SE of the nucleus – the X-ray plume
To compare the nuclear emission components to the structures that are thought to trace the nuclear outflow of NGC 253, we superimposed in Fig. 7 the HRI contours of the central area (contours as in Fig. 3 of Paper I) onto a continuum-subtracted Hα + [N ii 6548, 6583 emission line image kindly provided by H. Schulz (cf. Schulz & Wegner 1992). X34 coincides with the central H peak, and the cone-like diffuse emission covers the ”H fan”. Based on Einstein HRI data with lower statistical significance this fact was already noted by McCarthy et al. (1987). They also pointed out that the H bright emission regions to the SE, near the end of the X-ray emission, are most likely ordinary H ii regions in the disk of NGC 253. In the following we discuss the diffuse central X-ray components individually.
4.2.1 Source X34: extended emission from the starburst nucleus of NGC 253?
While Fabbiano & Trinchieri (1984), using Einstein HRI observations, identified the extended source with the nucleus, the ROSAT HRI observations (cf. Paper I) demonstrate that it is offset by 54 to the east and by 64 to the south from the position of the nucleus as defined by radio observations (Ulvestad & Antonucci 1997, ). This total offset of 83 to the SE clearly exceeds the uncertainty in the X-ray position of 25, including statistical and systematic errors. The maximum of the emission of X34 is also clearly separated from the radio-bright SNRs and H ii regions (e.g. Ulvestad & Antonucci 1997), which are centered on the nucleus, and from the bright near-infrared emission originating from dense dust clouds and molecular material in the same region (Sams et al. 1994). We therefore conclude that X34 is not emission originating from the nucleus of NGC 253 but represents the position, where emission from gas, ejected along the minor axis, can penetrate into our line of sight through the dense absorbing interstellar medium surrounding the nucleus.
The spectral results for X34 support this view, too. The NH values of cm-2 derived for the X34 spectrum (subtracting a local background) are more than a factor of 10 below column densities of cm-2 expected for emission from the NGC 253 nucleus. Such a high absorption is put forward by the visual extinction of A mag estimated for the nucleus by Prada et al. (1999) based on Br velocity curves along the SW side of the major axis, and the conversion to NH of Av cm-2 (Predehl & Schmitt 1995). A source with a power-law spectrum with photon index 2.9 as measured for X34 would be suppressed in the ROSAT 0.1–2.4 keV band by a factor of compared to zero absorption, and still by a factor of compared to the NH derived from the X34 fit. If the spectrum of X34 was intrinsically flatter (e.g. power-law of photon index 1.9), the attenuation in the ROSAT band due to absorption might be reduced by just a factor of ten, but would still be substantial. Therefore, if hot gas is ejected from the nuclear area along the minor axis of the galaxy as a super-wind into the halo hemisphere facing us, soft band X-ray emission from this component will be heavily absorbed close to the nucleus and should become less absorbed along its path through the interstellar medium.
The X-ray absorption is usually characterized by the hydrogen column density NH made up mostly of H i and H2. To calculate the absorption as function of X-ray energy one then uses the effective absorption cross section per hydrogen atom as e.g. tabulated by Morrison & McCammon (1983) based on atomic cross sections and cosmic abundance. These abundances are derived in the solar neighborhood, and even within the Galaxy there is evidence for an radial abundance gradient for elements heavier than helium (Shaver et al. 1983). The X-ray absorption above 0.5 keV is primarily produced by heavier elements, mostly by oxygen and iron and therefore dependent on the metal abundance of the interstellar medium which may significantly differ from solar in various regions of a starburst galaxy like NGC 253. Direct radio measurements of the H i column in the direction of the NGC 253 nucleus were hampered twofold, by the limiting beam resolution of 30″, and by H i absorption. Therefore, the H i column of cm-2 for the nucleus of NGC 253 obtained by the interpolation of the H i maps of Puche et al. (1991) and Koribalski et al. (1995), can only be interpreted as a lower limit. Mauersberger et al. (1996) investigate the distribution of molecular gas in the direction of the NGC 253 nucleus and derive based on a conservatively low value, a maximum H2 column density of cm-2 which (if half in the front and half in the back of the nucleus) contributes this amount to the NH towards the nucleus. The NH determined in this way, nicely compares to the value based on the Br velocity curves above. Fits to broad band nuclear X-ray spectra with good statistics that will be derived with XMM-Newton or Chandra, should offer another method to determine the absorption column and possibly even abundances of the interstellar medium towards the nucleus of NGC 253.
With decreasing X-ray energy, the maximum of the emission should be further separated from the position of the nucleus. This effect is indicated in the PSPC images of the different energy bands in Fig. 1. However, one needs observations with high spatial resolution (as good as or better than those provided by the ROSAT HRI) for several energy bands to trace the increasing absorption down to the nucleus and investigate its nature. As can be seen from the numbers given above, an active nucleus with an intrinsic X-ray luminosity of more than a few times erg s-1, would still have been undetectable with ROSAT.
The spatial displacement of X34 from the nucleus can be used to determine the height above the plane of the galaxy from which the emission originates. We assume a positional displacement along the minor axis and take into account the inclination of NGC 253 (78.5°, Pence 1980). An offset of then transforms to a height of () pc above the nucleus. The extended nuclear source (″ FWHM) can be interpreted as hot gas being part of a super-wind from the nuclear region. The THBR fit indicates a temperature of K. Its extent of 250 pc is similar in size to the bright nuclear radio emission detected with the VLA at wavelengths ranging from 1.3 to 20 cm, where a large number of compact radio sources were revealed, embedded within the diffuse radio structure (16″ 200 pc along major axis, Ulvestad & Antonucci 1997, and references therein), and more extended by a factor of two than the bright nuclear near infrared emission (Sams et al. 1994).
ASCA and BeppoSAX observations (see Sect. 4.1) do not provide the resolution to spatially resolve the nucleus. However, if the hard component fitted to ASCA spectra is identified with emission from the nucleus, its intrinsic luminosity should not exceed erg s-1 (Ptak et al. 1997). As discussed before, this assumption oversimplifies the situation since several sources with different absorptions contribute to the ASCA hard spectrum, the highly absorbed nuclear component representing just the one suffering the highest absorption. Its intrinsic luminosity may therefore be well in excess of the number given above and does not really restrict the limits derived from the ROSAT observations. The same arguments hold for the BeppoSAX observations, that show extended emission best modeled by a hot thermal plasma ( keV) with the inclusion of an Fe K line and have been tentatively identified with a starburst-driven galactic super-wind (Persic et al. 1998). There are, however, also some similarities to the X-ray emission from the Galactic Ridge (Cappi et al. 1999).
The situation should change with the detectors on board the next generation of X-ray observatories, XMM-Newton and Chandra, that will allow observations at higher energies with good spatial resolution, strongly reducing the effects of absorption, and allowing the nucleus to become directly visible. With the help of X-ray variability studies it should then be possible to decide on the nature of the radio-bright nuclear source which, according to Ulvestad & Antonucci (1997), can still be either an AGN or a very compact supernova remnant. Recently, time variability was detected in the highly absorbed hard X-ray component of the nearby starburst galaxy M82 using ASCA data (Ptak & Griffiths 1999, Matsumoto & Tsuru 1999) which leads to the conclusion that M82 hosts a low luminosity AGN. M82 shows X-ray emission from a strong galactic wind and the halo (e.g. Strickland et al. 1997). If indeed such a low-luminosity AGN were also confirmed for NGC 253, the other nearby prototypical starburst galaxy with galactic wind and X-ray emission from the halo, this might strengthen the view of an intrinsic connection of these phenomena as proposed by Pietsch et al. (1998), based on observations of the starburst galaxy NGC 3079, a galaxy which also hosts an active nucleus and a pronounced X-ray halo.
Forbes et al. (2000) present new HST data of the central region of NGC 253 and compare it to other wavelengths. They find that the majority of optical/IR/mm sources are young star clusters which trace a pc ring that defines the inner edge of a cold gas torus. In X-rays they identify the extended nuclear ROSAT HRI emission with the nucleus and argue that not all of the X-ray emission can be associated with the AGN, suggested from the radio, nor with an ultra-luminous supernova. Instead, they associate the emission with the out-flowing super-wind and find the size scale consistent with the idea of collimation by the gas torus. This analysis in principle does conform with our above interpretation. The main difference is that by careful positioning (see Paper I) we demonstrate that the emission in the ROSAT band is not originating from the nucleus but from a height above the plane of NGC 253 where the extinction is already significantly reduced and transparent to radiation in the ROSAT band. At this height, the X-ray beam which may be collimated in the inner disk by the cold gas torus as suggested above, may already have widened by a factor as indicated from the extent reported in Sect. 3.1.
4.2.2 X-ray plume along SE minor axis
Demoulin & Burbidge (1970) were the first to suggest from spectrographic observations of NGC 253 that gas might be flowing out of the nucleus and outside the equatorial plane. In 1978, Ulrich confirmed the outflow along the minor axis with the help of velocity curves derived from measurements of optical lines using slit spectra across the center of the galaxy with different orientations (to distances of 25″ from the nucleus). She explained the origin of the outflow in terms of a nuclear starburst. McCarthy et al. (1987) and Schulz & Wegner (1992) used long-slit spectra and narrow-band images and interpreted them as emission from the surface of a kiloparsec-sized outflow cone driven by the starburst wind. The cone opening angle of 65 ° and outflow speed along the cone of 339 km s-1 given by Heckman et al. (1990), compares well with values determined by Schulz & Wegner (50° and 390 km s-1, respectively).
The overlay of the ROSAT HRI contours onto the H image (Fig. 7) shows a rather close correspondence of the diffuse X-ray emission and the H structures connected with the outflow. The X-ray emission can be traced to a similar distance ( 1′) from the nucleus to the SE as the weak H and shows a clear cone-like structure with an opening angle of 30°, and brightened limbs in the ROSAT band (see Sect. 3.2.1) originating from the nucleus, which is also observed in the H images but less pronounced. The opening angle defined by the maxima in Fig. 3 is smaller than that based on optical radial velocities. This can be explained by the near edge on viewing geometry, and as expected, the width of 75° of the emission structure as determined from Fig. 3 in Sect. 3.2.1 compares more favorably. The cone-like structure can be understood in terms of models of galactic super-winds driven by a nuclear starburst (e.g. Tomisaka & Ikeuchi 1988, Suchkov et al. 1994). According to these models the cone surface may represent the interaction zone of the emerging wind with the interstellar medium surrounding the nucleus. In H and X-rays we do not see the wind itself which is expected to be hotter than this medium and radiating predominantly at energies outside the ROSAT band. In this picture the relatively sharp cut-off of the X-ray emission to the SE can be understood as representing the scale height of the dense interstellar medium in the galactic disk.
According to the models, a nuclear starburst should produce a bipolar flow along the minor axis. On the other hand, circumnuclear and disk material – as discussed above – will suppress soft X-rays from the starburst wind emerging into the far, NW hemisphere. The HRI images still reveal some emission NW of the nucleus. The morphology, however, is not that of a hollow-cone as in the SE. Therefore, we cannot decide whether this emission leaks through from the back of NGC 253 through areas of reduced absorption (inter-arm region) in the galactic disk, or whether it originates in front of the disk. In principle one could try to settle this question using the spectral capabilities of the PSPC, as we did for the nuclear source and X-ray plume. Unfortunately, the emission is not strong and extended enough and is too close to the bright central sources to allow this kind of analysis.
However, the existence of a flow of gas into the NW halo hemisphere is demonstrated by the observation of an OH-plume pointing in this general direction, with a strong component to the north (Turner 1985). No OH emission (originating from molecular gas, radio 18 cm) is detected in the SE, adding to the arguments that the outflow into the NW halo must even be stronger than that to the SE. This might be explained by a less strong blocking to the NW caused by inhomogeneities in the interstellar medium or an asymmetric position of the starburst with respect to the nucleus. The intensities and spectra of the X-ray emission from the halo hemispheres (see below) further support this picture.
The extended source above the nucleus (X34) and the X-ray plume can be directly compared to the X-ray emission from the nuclear super-bubble in the edge-on starburst LINER/Seyfert 2 galaxy NGC 3079. There the central component extends over 1.7 kpc with a luminosity of erg s-1 and is not only detected in H images but also in the 20 cm radio continuum (see Pietsch et al. 1998). Similar to the NGC 253 X-ray plume, the central bright X-ray and H emission is only seen in the east due to absorption in interstellar medium of this galaxy. Another example of X-ray sources that may reflect emission from hot gas in super-bubbles emerging from galactic nuclei are reported by Read et al. (1995) for the merging galaxy pair NGC 4038/9 – the Antennae. There, the sources are offset by 1 kpc from the nuclei, are best fitted by absorbed, low temperature plasma models indicating intrinsic luminosities of a erg s-1.
4.3 Diffuse emission from the NGC 253 disk and the flat SE halo component immediately above (coronal emission)
In Sect. 3.2.2, we identified at least three components to the diffuse emission of the NGC 253 disk and the flat SE halo using the surface brightness distributions along the major and minor axes (Fig. 4) that are seen to differ in spatial extent:
-
1.
a bright component that originates from the nuclear region was discussed in the previous section and is connected to the extended source X34 and the X-ray plume
-
2.
a soft component most likely originating from hot gas immediately above the layer of the dense interstellar medium of the disk as can be inferred from the shift of its maximum to the SE by 45″. It rises to a maximum height of 2.2 kpc above the galaxy plane with an extent of 4.5 kpc along the major axis (coronal emission above the disk)
-
3.
in the hard band, a bright central and a fainter extended component (extents of 3.4 kpc and 7.5 kpc, respectively) becomes visible centered on the plane of the galaxy and most likely originating from within the disk
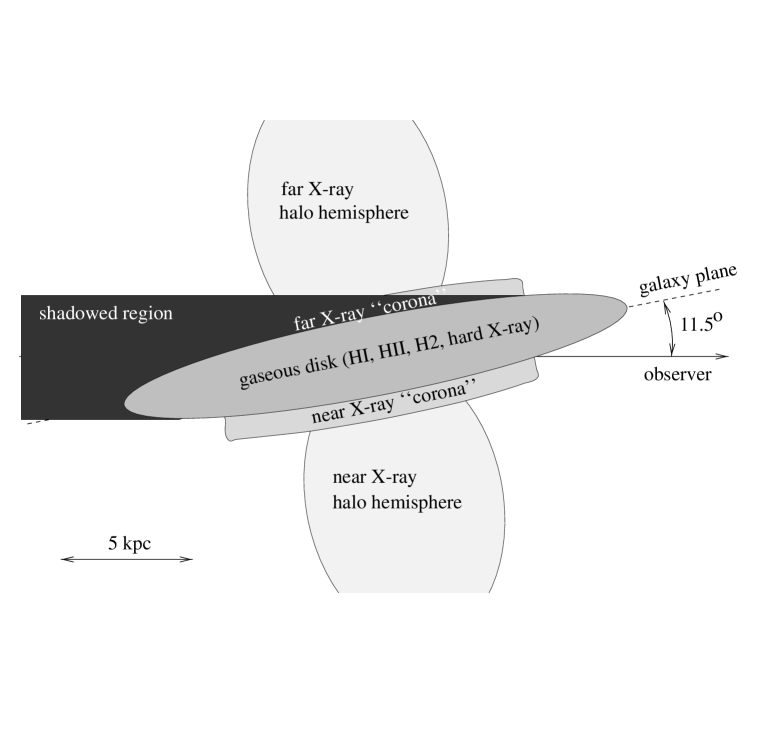
Components 2 and 3 can clearly be identified in the overlays of the soft and hard PSPC X-ray contours on an optical image of NGC 253 (Fig. 9). Component 2 may be further subdivided into emission connecting component 1 with the horn-like structure in the outer halo hemisphere (as indicated by the curvature of the soft band contours close to the nuclear area), reflecting the strong galactic wind emanating from the starburst nucleus, and a component floating on the disk like a spectacle-glass. The latter most likely originates from hot gas fueled from galactic fountains (see below). The proposed location and viewing geometry of the different halo components is sketched in Fig. 10.
The presence of these bright components hinders the detection of X-ray emission – if present – from the bar of NGC 253 (seen e.g. in infrared data with position angle 70°, extent 150″; Forbes & DePoy 1992). On the other hand, there is a clear correspondence in the brightness distribution of the diffuse hard band emission with the spiral structure in the inner and the outer disk of NGC 253 (Fig. 9). South of the nucleus the inner spiral arm is located to the north and the brighter part of the outer spiral arm to the south within the projected elliptical shape of the disk. North of the nucleus, the spiral arm moves outward from south to north (compare optical and H i analysis by Pence 1980 and Koribalski et al. 1995, respectively).
The X-ray surface brightness distributions (Fig. 4) can be compared to the emission at other wavelengths. The soft band profile originates from above the disk, therefore one expects little similarities with emission at optical continuum and infrared wavelengths. The hard band, however, traces diffuse emission in the disk, and correlations with other wavelengths are expected. Thus, for Einstein IPC data Fabbiano (1988) reported a good correlation with the radio profile along the major axis. In Fig. 8 we compare the background corrected ROSAT PSPC hard-band profiles along the major and minor axes to optical, infrared, and radio profiles.
The optical (blue light) profiles were extracted from Pence (1980, Fig. 8) and normalized to the wings of the major axis X-ray profile (75 offset) and to the maximum of the minor axis profile. Along the major axis the optical brightness shows a bright plateau out to a galacto-centric distance of 10′ and coincides nicely with the faint extended X-ray component. The bright central and the nuclear component seem less pronounced or totally missing, which may be explained by extinction effects. Along the minor axis, X-ray and optical brightness profiles are comparable within the disc. However, the optical data do not indicate halo emission, as can be most clearly followed in the X-ray profiles in the NW.
Infrared profiles were published by Scoville et al. (1985). We have compared 2.2 m data (their Fig. 1) obtained with a 10″ beam from scans along the major axis, and normalized their profile to match our bright central component (25 offset). The NIR profile follows the X-ray brightness of the bright central component and of the wings quite well. The larger X-ray extent to the SW of the bright central component may be explained by the differences in the infrared beam size and the X-ray slit length. As these systematic effects should be much stronger along the minor axis, we did not include these data in the figure. The excess 2.2 m radiation, if compared with colours normally seen in disk galaxies, cannot be entirely explained by heavy extinction, but is most likely a contribution from clouds of hot dust associated with star formation regions.
While the radio 1.46 GHz radio emission (Hummel et al. 1984) emphasizes the disk emission, the 330 MHz emission (Carilli et al. 1992, see Fig. 11) discloses the true halo emission. As we are here comparing disk distributions, we compare the 1.46 GHz profile (Hummel et al. 1984) collected with a beam size of 68″36″. It is normalized to match the bright central component at the same offset as the infrared. A similar profile was reported by Klein et al. (1983) based on 10.7 GHz observations. While in 1.46 GHz, the nuclear component along the major axis is more extended than the X-ray or infrared emission, the central component is similar in width to the infrared. The extended wings, however, decline faster than X-rays and infrared. A detailed comparison of radio and X-ray properties and especially of the distribution along the minor axis will be given in a separate paper (Ehle et al., in preparation).
How can we explain the similarities and the differences in the different wavelength regimes? The strong emission from the central source in all wavelengths reflects the presence of the strong nuclear starburst. In addition, the bright inner disk emission in the radio, infrared and X-rays is most likely caused by enhanced star formation in this region. The star-forming regions, however, are located in H ii regions well within the disk and are most likely heavily obscured in the optical. This may explain why the bright central disk is not as obvious in this band compared to other wavelengths. However, in a detailed analysis of the morphology of dark lanes and filaments in the dust-rich disk, Sofue et al. (1994) identified arcs with heights of about 100 to 300 pc, connecting together two or more dark clouds, as well as loops and bubbles expanding into the disk-halo interface with diameters of a few hundred pc to 1 kpc, and vertical dust filaments, almost perpendicular to the galactic plane and extending almost coherently 1 to 2 kpc into the halo. Sofue et al. propose a boiling disk model, in which the filamentary structures develop due to star-forming activity in the disk combined with the influence of magnetic fields. There is clearly enhanced activity in the inner disk. This picture of the boiling disk, with indications of outflow of hot gas into the low halo (corona of the disk), connects naturally with the relatively soft X-ray emission floating on top of the disk of the galaxy in the SE like a spectacle-glass. In galaxies with starforming activity distributed over several areas in the disk, galactic fountains may be the mechanism to fuel the halo with hot gas (see e.g. the X-ray halo of NGC 891, Bregman & Pildis 1994). In NGC 253, however, the superwind from the nuclear starbursts clearly dominates.
Analyzing the X-ray spectra, a two-temperature thin thermal plasma model was sufficient to describe the integral disk spectrum. The low-temperature component (temperature 0.2 keV, extra-Galactic luminosity erg s-1) could be fitted assuming no absorption from within NGC 253, and can therefore be identified with the soft-band emission above the disk as deduced from the surface brightness profiles attributed to the disk corona. The component with the higher temperature of 0.7 keV is heavily absorbed ( cm-2 in addition to Galactic foreground) as expected if it originates from sources within the disk, and has an intrinsic luminosity of erg s-1. The spectrum certainly represents a mixture of sources. Unresolved point sources below the point source detection threshold (X-ray binaries, SNRs) will contribute, as well as diffuse emission from H ii regions and from the hot component of the interstellar medium. In principle, these components might be separated utilizing their characteristic spectra. However, due to the location in the disk, their spectra suffer from different levels of absorption so that observations with much better statistics and spatial and spectral resolution are required to resolve them.
Mean physical parameters for the flat SE halo component immediately above the disk can be inferred from the above results if we make some assumptions about the geometry of the emission. Here we choose the simple geometry of a disk corona, an circular cylinder with a thickness of 1 kpc and a diameter of 9 kpc with the central area cut out to a radius of 0.8 kpc. This approximates the extraction area of the disk spectrum and the extent of the soft emission along the major axis. The results are not strongly dependent on these geometrical parameters.
| Region | (cm-3) | (M | (y) |
|---|---|---|---|
| SE disk corona | |||
| NW halo soft | |||
| hard | |||
| SE halo soft | |||
| hard |
In this coronal model, the hot gas with the fitted temperature of 0.2 keV K (cooling coefficient of erg cm3 s-1 according to Raymond et al. (1976)) and the unabsorbed luminosity of erg s-1 is distributed in a volume of cm3, assuming a relative volume filling factor of the hot gas in clouds. Assuming thermal cooling and ionization equilibrium (Nulsen et al. 1984), the electron density , mass and cooling time of the coronal gas are given in Table 6.
Neglecting effects of differing filling factors (which, however, would only contribute with the square root) the density of the soft and hard components in the outer halo hemispheres are lower by factors of 2 to 3 and more than 5, respectively, than that of the disk coronal hot gas. The contributing mass in the hard components of the halo is similar to that in the disk corona while it is higher by a factor of 2 to 3 in the soft halo components. The cooling time of the soft halo components is a factor of 2 and that of the hard components more than a factor of 10 longer than in the disc corona. The scale height and properties of the coronal emission can be explained by galactic fountains (e.g. Breitschwerdt & Komossa 1999 and references therein), created due to the heating of the hot intercloud medium by explosions of supernovae while the emission in the outer halo most likely originates from the galactic super-wind (e.g. Heckman et al. 1990, see Sect. 4.5).
4.4 Shadowing of halo emission by the disk
An eye-catching structure in the ROSAT PSPC soft band image (Figs. 1 and 9) and the surface brightness profile along the minor axis (Fig. 4) is the depression/gap in the diffuse emission between the galaxy disk and the NW halo hemisphere. The explanation for this novel effect is straight forward. The diffuse emission from the corona and outer halo hemisphere on the far side of the galaxy is shadowed by the dense interstellar medium of the intervening disk. In addition, in the gap area no emission from the other hemisphere contributes, due to the near edge-on view (see Fig. 10). Therefore this shadowing effect not only unequivocally reveals the geometry of the system (i.e. the NW edge is the near side of NGC 253), but also allows us to determine lower limits to the column density of the intervening material.
| NH | T = 0.2 keV | T = 0.3 keV | T = 0.4 keV | |||
| soft | hard | soft | hard | soft | hard | |
| (1020 cm-2) | ||||||
| 2.5 | 2.6 | 1.2 | 2.6 | 1.1 | 2.6 | 1.1 |
| 5 | 5.1 | 1.4 | 5.1 | 1.3 | 5.2 | 1.2 |
| 10 | 17 | 1.9 | 16 | 1.6 | 16 | 1.5 |
| 20 | 120 | 3.4 | 100 | 2.6 | 100 | 2.3 |
| 40 | 3400 | 10 | 2700 | 6.1 | 2900 | 4.8 |
To estimate the effects of absorption, we could assume for the unabsorbed flux in the NW an identical profile as observed in the SE and calculate the amount of absorption from the reduction factor determined from the profile really measured. However, we already pointed out in Sect. 3.2.2 that the fluxes in the unabsorbed parts in the NW are 1.5 times brighter than in the SE at similar nuclear distances. Also, the spectrum in the outer halo is significantly harder. In Table 7 we put together reduction factors with respect to pure Galactic foreground absorption for the 0.1–0.4 keV and 0.5–2.0 keV ROSAT PSPC bands, calculated for thin thermal plasma spectra, with temperatures of 0.2, 0.3 and 0.4 keV and increasing additional shadowing columns of cold gas (NH of 2.5 to cm-2). While, for a given absorbing column, the reduction factors for soft band emission do not vary strongly for the temperature range investigated, for a fixed temperature there is strong variation with increasing absorption (factors of 1.2 and , respectively). The corresponding hard band variations are stronger for changing temperatures, but much weaker with absorption (2 and 10, respectively).
| Offset | 1′ | 2′ | 3′ | 4′ |
|---|---|---|---|---|
| Soft | 4 | 2 | ||
| Hard | 8 | 6 | 3 | 2 |
The theoretically expected reduction factors can be compared to factors determined from the minor axis profiles (Fig. 4), by dividing count rates extrapolated from larger off-axis angles to the inner disk by the measured count rates (Table 8). At an off-axis angle of 4′ the factors still indicate absorbing columns of cm-2 and at 3′ of cm-2 using the soft-band information. The less reliable extrapolation of the hard band would indicate even higher absorption.
These results can be compared with H i measurements. Puche et al. (1991) present data obtained with a beam of 68″ diameter. Their lowest contour of cm-2 is offset from the nucleus along the minor axis to the NW by 3′. With a beam diameter of 30″ the lowest contour of cm-2 in the map of Koribalski et al. (1995) shows the same offset. As explained in detail in Sect. 4.2.1, NH is determined by contributions from H i and H2. The H2 distribution of NGC 253 can be inferred from CO maps (Houghton et al. 1997). While these maps have less resolution than the H i maps, they more or less coincide in general extent and imply a significant contribution to NH. Using our X-ray absorption technique, we can determine absorption columns in the NW outer disk with similar accuracy. Unfortunately, the X-ray shadowing method is not generally applicable to measure the density of the interstellar medium in galaxies, but NGC 253 reflects a case of special luck. Galactic foreground NH needs to be rather low ( cm-2), the galaxy inclination has to be close to edge on, and – the most important requirement – the galaxy halo must emit soft X-rays to allow this kind of study.
Even for our NGC 253 analysis one has to keep in mind that the count rates are averaged along the disk at varying absorption depths and X-ray brightnesses. Data with better statistics as expected from the upcoming XMM-Newton observatory will allow the determination of the absorbing column along the NW outer disk with good spatial resolution. Such data should also clearly uncover the geometry of the outflow to the NW. Its soft emission is hidden by the disk, however it shines through at energies above 0.5 keV (see the hard1 and hard2 images in Fig. 1), indicating that unfortunately the hemisphere with the more spectacular outflow is shadowed by the NGC 253 disk.
4.5 Extended soft X-ray halo of NGC 253
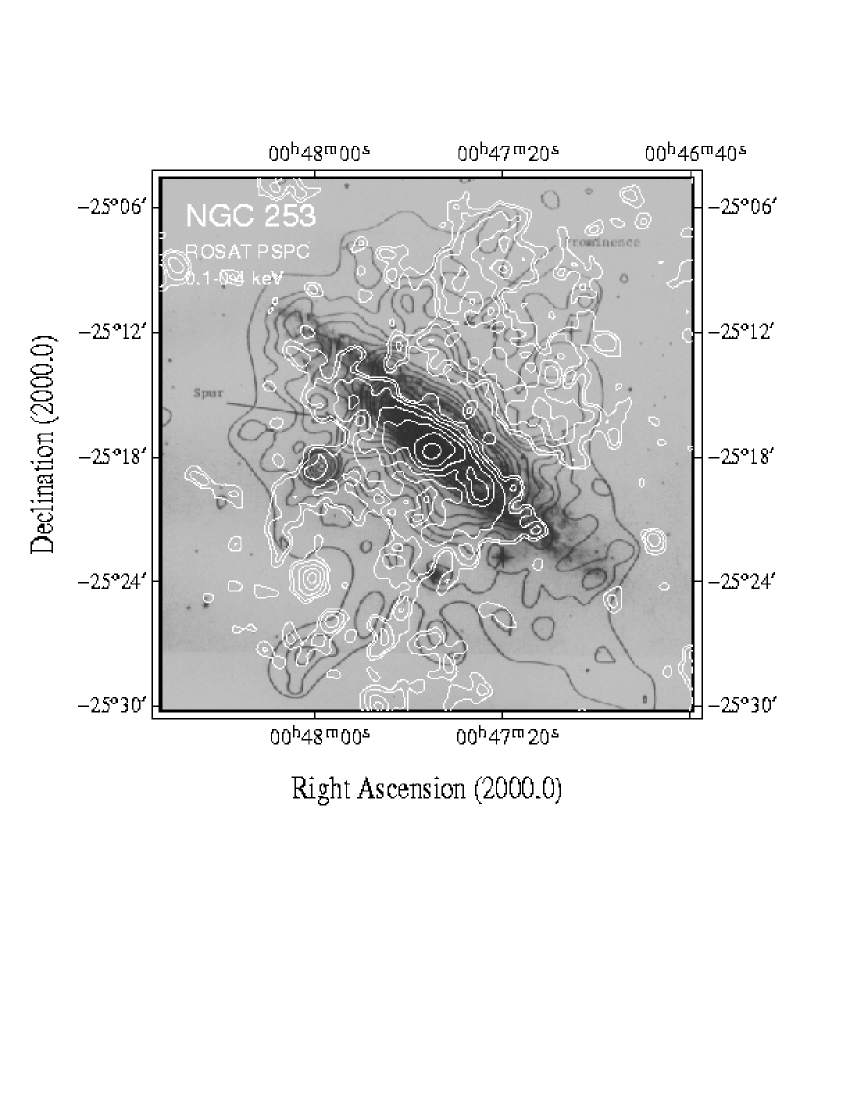
The detection of hot gas in the halo of NGC 253 extending to projected distances of 9 kpc from the galactic plain, allows us to investigate a component of the interstellar medium that cannot be accessed in optical observations. The X-ray structure (Sect. 3.2.2) clearly indicates that the emission is not filling the halo homogeneously. Instead, the soft image resembles a horn-like structure in both hemispheres, as would be expected if the emission regions were shaped like a hollow-cone. While the hemispheres look rather similar in the broad band image, they differ significantly in the hard band. This behavior is also reflected in the spectral parameters, the NW halo hemisphere being significantly hotter than the SE one. In addition to this difference between the two halo hemispheres, the northern most “horn” in both hemispheres is more pronounced.
Analogously to the corona above the disk (see Sect. 4.3), we can determine mean physical properties for the emitting medium. For simplicity we assume that the hot gas in both hemispheres is filling a cylinder of 4.5 kpc radius and 7 kpc height. It is evident from the images, that the filling factors and for the halo hemispheres differ. As discussed in Sect. 3.2.2, no simple model results in a good approximation for the individual halo spectra. Nevertheless, to derive halo gas parameters (cf. Table 6), we made use of the temperatures (0.19 keV K and 0.12 keV K) and corresponding unabsorbed luminosities ( erg s-1 and erg s-1), derived from a thin thermal plasma model fit to the NW and SE halo hemispheres, respectively. The significantly higher luminosity and temperature in the NW with respect to the SE halo hemisphere nearly cancel each other and only lead to slightly higher electron densities and masses, while the cooling time stays the same.
The ROSAT halo parameters in the NW are consistent with the parameters derived from Einstein observations (Fabbiano 1988), once corrected to our assumed distance and to the ROSAT measured temperature. The sum of our components differs, however, significantly from the parameters derived by Read et al. (1997) using integral properties of the diffuse emission of NGC 253; they find lower gas masses and shorter cooling times as well as allowing for lower electron densities in the radiating plasma.
If the hot gas in the outer halo represents nuclear and disk material transported into the halo by the super-wind with a velocity of 350 km s-1 as modeled for the optical emission cone close to the nucleus (cf. Sect. 4.2.2), we can calculate from the halo extent of 9 kpc a lower limit for the age of the wind of y. This time is comparable to the age of the rapid massive star formation in the nucleus of NGC 253, derived from evolutionary synthesis models ( y, e.g. Engelbracht et al. 1998), it is shorter, however, by at least an order of magnitude than the cooling time of the hot gas in the halo calculated above. From these considerations it is possible that the hot halo gas was heated in the starburst nucleus and transported into the halo by the wind. However, one could also consider that the wind is heating ambient gas in the halo.
The first scenario has been proposed by Tomisaka & Ikeuchi (1988). Their model of a galactic scale bipolar flow assumes a disk component to represent the interstellar medium of the starburst galaxy, which for some time confines the hot matter within a cool shell, which is further heated by supernova explosions of massive stars formed in the nuclear starburst. Eventually, the shell breaks up and releases the hot gas into the halo. Suchkov et al. (1994) improved the model by including an ambient two-component disk-halo interstellar medium and argued that this two-component representation is crucial for adequate modeling of starbursts. In their models, the bulk of the soft thermal X-ray emission from starbursts arises in the wind-shocked material of the halo and disk gas transported into the halo, rather than in the hot wind material itself. The super-wind itself is too hot and thin, to be visible in the ROSAT band and reaches speeds of 2000 km s-1. The models allow to produce X-ray geometries and filamentary structures similar to those observed in NGC 253 and propose a temperature distribution of the heated material of K. However, they neglect the role of cosmic rays, magnetic fields, and delayed recombination (Breitschwerdt & Komossa 1999).
The spectra from the halo hemispheres cannot be fitted by simple thin thermal plasma models. However, two temperature models or a one temperature model with additional emission components above 0.7 keV give reasonable fits to the data (Sect. 3.2.2). This confirms on a smaller scale results by e.g. Dahlem et al. 1998 and Strickland & Stevens 1998 who found observational evidence that the spectra of the diffuse soft X-ray emission in galactic winds or superbubbles suggest more than a single temperature. The temperatures and luminosities of the observed NGC 253 halo components are consistent with luminosities and the temperature distribution proposed by the models for the heated material in the halo.
Breitschwerdt & Schmutzler (1999) showed that the assumption of cooling via collisional ionization equilibrium used in the thin thermal plasma models are not correct if the dynamical time scale of the plasma, as for instance in an out-flowing wind, is much shorter than the intrinsic time scales (e.g. recombination, collisional excitation, ionization etc.). Therefore, the dynamical and thermal evolution of the plasma has to be treated self-consistently. First results show that the expected spectra of cooling wind material in the halo should exhibit enhanced emission in lines at energies above 0.7 keV (e.g. from O vii, O viii, and highly ionized Fe), compared to equilibrium models, as well as a lower plasma temperature due to adiabatic expansion. Since recombination of highly ionized species is delayed, the resulting X-ray line emission reflects the “initial temperature” of the plasma close to the disk, when it was much hotter. In these non-equilibrium models one cannot determine a single cooling timescale, “equilibrium cooling” due to expansion is likely to be much shorter than the equilibrium value given in Table 6 and the time scale for line recombination longer. Numerical simulations for a galactic outflow including non-equilibrium X-ray emission in a self-consistent fashion have been folded through the ROSAT PSPC instrumental response (Breitschwerdt & Freyberg 2000). Best fitting spectral models are two temperature thin thermal plasma or a one temperature model with an additonal Gaussian component similar to our finding. Breitschwerdt & Freyberg argue that the two fitted temperatures are not physical but mimic non-equilibrium X-ray emission.
Keeping in mind the super-wind origin of the halo emission, one can consider several explanations for the asymmetries in the halo X-ray emission. The asymmetry may either be caused by differing wind parameters in both hemispheres, originating for instance from a slight asymmetry of the driving starburst, or by a different structure of the ambient halo medium MacLow & McCray 1988). These explanations may well explain the asymmetry between the SE and NW halo, they also may account for the stronger “horns” in the north than in the south of both hemispheres. One can, however, think of other possibilities to generate the asymmetry of the “horns”. There could be more ambient material on the N side of the galaxy to shock-exite (perhaps due to an earlier fountain episode?), or even the interaction of the halo gas due to the relative motion with the intergalactic medium of the Sculptor group of galaxies, of which NGC 253 is a member (e.g. Puche & Carignan 1988), could be responsible. Unfortunately, neither the inter-galaxy medium nor the relative motions are known for the Sculptor group galaxies to strengthen or reject the latter hypothesis.
The X-ray halo has no equivalent in the optical continuum. The optical continuum halo mainly follows the elliptical shape of the galactic disk to distances along the major axis of 22.5 kpc (Pence 1980, Beck et al. 1982) and is most likely made up of late type stars. This situation is different for the H emission.
Radio images at 330 MHz (Carilli et al. 1992) show a synchrotron emitting halo which is more extended perpendicular to the disk and in general matches the soft X-ray halo (cf. Fig. 11). At radio frequencies of 1.5 GHz, the emission is box-shaped similar to the disk corona emission (Hummel et al. 1984, Carilli et al. 1992, Beck et al. 1994). Carilli et al. present evidence for outflow from the disk in a ”spur” which – corrected for the NGC 253 distance assumed in this paper – rises 2.5 kpc above the plane at about the position of the NE X-ray horn. Detailed comparison of the morphology of the halo emission is hampered by the poorer resolution of the 0.33 GHz radio (60″ and outermost contour 120″) with respect to the soft X-ray contours (40″). However, there is indication from the overlay that the radio emission does not show the horn-like structure which dominates the X-ray morphology. So in X-rays, the curvature of the NE horn points at a connection to the nucleus, while the NE radio spur seems to be directly connected to the disk and offset to the north. Radio and X-ray data with better resolution and statistics are urgently needed to clarify these differences, that can not be understood in terms of models put forward for the common origin of the X-ray and radio halo emission. For the NGC 253 radio halo, Beck et al. (1994) extracted magnetic fields and rotation measures using multi-frequency observations of the radio continuum emission. X-ray, radio and H measurements will be compared in detail in a separate paper (Ehle et al., in preparation) to determine the importance of magnetic and thermal effects for the interstellar medium in the galaxy disk and halo.
4.6 Comparison with diffuse X-ray emission detected in other spiral galaxies
| Galaxy | z | T | LX | Ref. | |
|---|---|---|---|---|---|
| (kpc) | (keV) | (∗) | ( M☉) | ||
| NGC 253 | 9 | 0.15 | (1) | ||
| M82 | 6 | 0.5 | (2) | ||
| NGC 3079 | 13.5 | 0.3 | (3) | ||
| NGC 3628 | 25 | 0.16 | (4) |
∗: in units of erg s-1
References: (1) this work; (2) Strickland et al. 1997; (3) Pietsch et al. 1998;
(4) Dahlem et al. 1996
With the help of the ROSAT satellite, diffuse emission from the disk and halo of several late-type spiral galaxies was separated, irrespective of their face-on or edge-on orientation. References for some galaxies analyzed in detail and used for comparison to our NGC 253 results have already been given or are given below. In addition, Read et al. (1997) present a homogeneous, however less deep, analysis of 17 nearby galaxies partly overlapping with our sample, and determine rough parameters for the diffuse emission. Detailed analysis of close to face-on galaxies (e.g. M 101, Snowden & Pietsch 1995; NGC 4258, Pietsch et al. 1994; NGC 4449, Vogler & Pietsch 1997; M 83, Ehle et al. 1998; NGC 7793, Read & Pietsch 1999) clearly show diffuse emission. The separation in disk and halo components proved difficult and was mainly based on the absorbing columns derived from spectral fits. The separation is much easier for (close to) edge-on galaxies due to the fact that in these systems disk and extended halo components spatially separate. Diffuse emission has not been detected from the halo of all “normal” edge-on galaxies. We list some examples with halo detection indicated in brackets: NGC 4565 (+), NGC 4656 (?), NGC 5907 (-) (Vogler et al. 1996); NGC 4631 (+) (Wang et al. 1995, Vogler & Pietsch 1996); NGC 4559 (-) (Vogler et al. 1997). However, the galaxies showing X-ray emission from the halo most convincingly, are really the nearby edge-on starburst galaxies like NGC 253, M82, NGC 3079, and NGC 3628.
While the halo of NGC 253 presents a spectacular image and clearly stands out compared to other normal galaxies, its properties do not at all beat other nearby edge-on starburst galaxies. In Table 9 we compare the z extent of the halo above the disk as well as the temperature T, absorption corrected luminosity (0.1-2.4 keV) LX of the halo gas and inferred gas mass . From Table 9 one would gather that in view of the halo extent, NGC 253 is not on the low side of the sample. Recently, however, Lehnert et al. (1999) reported emission at a distance of 11.6 kpc for the smaller M82 halo, which they interpret as being due to shock-heating of a massive ionized cloud by the starburst super-wind, which would clearly exceed the NGC 253 halo extent. Apart from NGC 3628, the temperatures of the halo gas of the other galaxies are higher by a factor of 2 to 3 and the luminosities by up to a factor of 10 implying gas masses larger by up to a factor of 20. Therefore, it is not the extreme halo properties of NGC 253, that have pushed it to the front of galaxy halo investigations, but its proximity and low Galactic foreground absorption. It is interesting to note that for the four galaxies in the above sample, besides starburst activity, LINER activity has also been discussed, pointing to the presence of an active nucleus. All four galaxies are members of dense groups, and at least for M82, NGC 3079 and NGC 3628 it is clear that interactions within the group have most likely initiated the starburst (and AGN) activity. For NGC 253, we cannot be sure that a recent encounter with neighboring galaxies of the Sculptor group has initiated the activity. As an alternative explanation for the starburst, bar activity has been put forward. However again, a ‘flyby’ of another Sculptor group galaxy might have caused the bar, which in turn may have caused the starburst.
5 Summary and conclusions
Following the detailed analysis of deep ROSAT HRI and PSPC observations for X-ray point sources (Paper I), we here have characterized the diffuse X-ray emission of this edge-on starburst galaxy. After subtraction of the point-source contribution we determined the geometry and spectra of the diffuse components and discuss our results in view of observations at other wavelengths and from other galaxies. In detail, X-ray, radio, and H measurements will be compared in a separate paper (Ehle et al., in preparation). Our main results can be summarized as follows:
-
•
The diffuse X-ray luminosity of NGC 253 is distributed in about equal emission components from nuclear area, disk, and halo and contributes 80% to the total X-ray luminosity of NGC 253 (L erg s-1, corrected for foreground absorption). The starburst nucleus itself is highly absorbed and not visible in the ROSAT band.
-
•
The “nuclear source” (X34) has an extent of 250 pc (FWHM) and is located about 100 pc above the nucleus along the minor axis on the near side of NGC 253. It is best described as having a thermal bremsstrahlung spectrum with a temperature of T = 1.2 keV (N cm-2) and L erg s-1 (corrected for Galactic foreground absorption). The nuclear source most likely marks the area where the line-of-sight absorption gets low enough that soft X-ray emission from the heated walls of the funnel drilled by the super-wind, can leak through.
-
•
The “X-ray plume” has a hollow-cone shape (opening angle of 32° and extent of 700 pc along the SE minor axis). Its spectrum is best modeled by a composite of a thermal bremsstrahlung (Ncm-2, T = 1.2 keV, L erg s-1) and a thin thermal plasma (Galactic foreground absorption, T = 0.33 keV, L erg s-1). It traces the interaction region between the galactic super-wind and the dense interstellar medium of the disk. The soft component with just Galactic foreground absorption stems from the halo above the disk.
-
•
Diffuse emission from the disk is heavily absorbed and follows the spiral structure. It can be described by a thin thermal plasma spectrum ( T = 0.7 keV, intrinsic luminosity L erg s-1), and most likely reflects a mixture of sources (X-ray binaries, supernova remnants, and emission from H ii regions) and the hot interstellar medium. The surface brightness profile, with a bright inner and a fainter outer component along the major axis with extents of 3.4 kpc and 7.5 kpc, resembles the 1.46 GHz radio profile.
-
•
The “coronal emission” originates from the halo immediately above the disk (scale height kpc). It is only detected from the near side of the disk (in the SE, T = 0.2 keV, L erg s-1), emission from the back (in the NW) is shadowed by the intervening interstellar medium causing a pronounced gap in the soft X-ray emission along the NW edge of the optical disk, unambiguously determining the orientation of NGC 253 in space. The X-ray corona is primarily due to the nuclear superwind that is also responsible for the emission in the outer halo. An additional component may be due to hot gas ejected by galactic fountains originating within the boiling star-forming disk.
-
•
The emission in the outer halo can be traced to projected distances from the disk of 9 kpc, and shows a horn-like structure. Luminosities are higher (10 and erg s-1, respectively) and spectra harder in the NW halo than in the SE. The emission most likely originates from a strong galactic wind emanating from the starburst nucleus. A two temperature thermal plasma model with temperatures of 0.13 and 0.62 keV or a thin thermal plasma model with temperature of 0.15 keV and Gaussian components above 0.7 keV and Galactic foreground absorption are needed to arrive at acceptable fits for the NW halo. This may be explained by starburst-driven super-winds or by effects of a non-equilibrium cooling function in a plasma expanding in a fountain or wind.
While NGC 253 does not beat other nearby edge-on starburst galaxies with its X-ray halo parameters, it stands out due to the low foreground NH, distance, and the favorable inclination, which all together allowed the detection of so many details with ROSAT. Of specific interest are three questions that only could be touched but not finally answered by ROSAT and ASCA/BeppoSAX:
-
1.
Is the X-ray emission in the outer halo caused by the nuclear super-wind or by hot gas transported into the halo via fountains that are fed from the star forming, boiling disk?
-
2.
Can the X-ray spectra of the halo really be described by a delayed recombination model?
-
3.
Is the nuclear starburst region responsible for the nuclear and X-ray plume emission or is there a contribution from jet-like activity of a hidden AGN?
These and more questions should be solved with the next generation of X-ray instruments on board XMM-Newton and Chandra, that will have a broader energy coverage, higher collecting area, and much better spatial and energy resolution. Therefore, NGC 253 promises to stay a key object to understand the formation and fueling of hot galaxy halos with future X-ray observations.
Acknowledgements.
Hartmut Schulz kindly provided us with the H images for the HRI overlays of the central field. We are very grateful to Dieter Breitschwerdt for discussions of the effects of non-equilibrium cooling, and Andy Read and Ginevra Trinchieri for a careful reading of the manuscript. This research has made use of the NASA/IPAC Extragalactic Database (NED) which is operated by the Jet Propulsion Laboratory, CALTECH, under contract with the National Aeronautics and Space Administration. To overlay the X-ray data we used an image based on photographic data of the National Geographic Society – Palomar Observatory Sky Survey (NGS-POSS), obtained using the Oschin Telescope on Palomar Mountain. The NGS-POSS was funded by a grant from the National Geographic Society to the California Institute of Technology. The plates were processed to the present compressed digital form with their permission. The Digitized Sky Survey was produced at the Space Telescope Science Institute under US Government grant NAG W-2166. The ROSAT project is supported by the German Bundesministerium für Bildung und Forschung (BMBF/DLR) and the Max-Planck-Gesellschaft (MPG).References
- (1) Aschenbach B., 1988, Appl. Opt. 27, 1404
- (2) Barber C.R., Roberts T.P., Warwick R.S., 1996, MNRAS 282, 157
- (3) Beck R., Hutschenreiter G., Wielebinski R., 1982, A&A 106, 112
- (4) Beck R., Carilli C.L., Holdaway M.A., Klein U., 1994, A&A 292, 409
- (5) Bregman J.N., 1980a, ApJ 236, 577
- (6) Bregman J.N., 1980b, ApJ 237, 681
- (7) Bregman J.N., Glassgold A.E., 1982, ApJ 263, 564
- (8) Bregman J.N., Pildis R.A., 1994, 1994, ApJ 420, 570
- (9) Breitschwerdt D., Komossa S., 1999, astro-ph/9908003
- (10) Breitschwerdt D., Freyberg M., 2000, A&A, in preparation
- (11) Breitschwerdt D., Schmutzler Th., 1999, A&A 347, 650
- (12) Cappi M., Persic M., Bassani L., et al., 1999, A&A 350, 777
- (13) Carilli C.L., Holdaway M.A., Ho P.T.P., De Pree C.G., 1992, ApJ 399, L59
- (14) Corbelli E., Salpeter E.E., 1988, ApJ 326, 551
- (15) Cox D.P., Smith B.W., 1974, ApJ 189, L105
- (16) Cox D.P., Reynolds R.J., 1987, ARA&A 25, 303
- (17) Dahlem M., Heckman T.M., Fabbiano G., Lehnert M.D., Gilmore D., 1996, ApJ 461, 724
- (18) Dahlem M., Weaver K.A., Heckman T.M., 1998, ApJS 118, 401
- (19) Demoulin M.-H., Burbidge E.M., 1970, ApJ 159, 799
- (20) Dickey J.M., Lockman F.J., 1990, ARA&A 28, 215
- (21) Ehle M., Pietsch W., Beck R., Klein U., 1998, A&A 329, 39
- (22) Engelbracht C.W., Rieke M.J., Rieke G.H., Kelly D.M., Achtermann J.M., 1998, ApJ 505, 639
- (23) Fabbiano G., 1988, ApJ 330, 672
- (24) Fabbiano G., Trinchieri G., 1984, ApJ 286, 491
- (25) Fabbiano G., Heckman T., Keel W.C., 1990, ApJ 355, 442
- (26) Forbes D.A., Ward M.J., Depoy D. L., 1991, ApJ 380, 63
- (27) Forbes D.A., DePoy D.L., 1992, A&A 259, 97
- (28) Forbes D.A., Polehampton E., Stevens I.R., Brodie J.P., Ward M.J., 2000, MNRAS 312, 689
- (29) Heckman T.M., Armus L., Miley G.K., 1990, ApJS 74, 833
- (30) Houghton S., Whiteoack J.B., Koribalski B., et al., 1997, A&A 325, 927
- (31) Hummel E., Smith P., van der Hulst J.M., 1984, A&A 137, 138
- (32) Klein U., Urbanik M., Beck R., Wielebinski R., 1983, A&A 127, 177
- (33) Koribalski B., Whiteoak J.B., Houghton S., 1995, Pub. Astron. Soc. Aust. 12, 20
- (34) Lehnert M.D., Heckman T.M., Weaver K.A., 1999, ApJ 523, 575
- (35) Matsumoto H., Tsuru T., 1999, PASJ 51, 321
- (36) McCammon D., Sanders W.T., 1984, ApJ 287, 167
- (37) McCarthy P.J., Heckman T., van Breugel, W., 1987, AJ 93, 264
- (38) MacLow M.-M., McCray R., 1988, ApJ 324, 776
- (39) Mauersberger R., Henkel C., Wielebinski R., Wiklind T., Reuter H.-P., 1996, A&A 305, 421
- (40) Mewe R., Gronenschild E.H.B.M., and van den Oord G.H.J. 1985, A&AS 62, 197
- (41) Morrison R., McCammon D., 1983, ApJ 270, 119
- (42) Nulsen P.E.J., Stewart G.C., Fabian A.C., 1984, MNRAS 208, 185
- (43) Pence W.D., 1980, ApJ 239, 54
- (44) Persic M., Mariani S., Cappi M., et al., 1998, A&A 339, L33
- (45) Pfeffermann E., Briel U.G., Hippmann H., et al., 1987, presented at SPIE, Berlin, West Germany 1986, cf. Proc. SPIE 733, 519
- (46) Pietsch W., 1992, X-ray emission of galaxies; ROSAT latest results. In: Physics of Nearby Galaxies: Nature or Nurture, Thuan T.X., Balkowski C., Van J.T.Th. (eds.), Editions Frontieres, Gif-sur-Yvette Cedex, p67
- (47) Pietsch W., 1994, ROSAT observations of nearby spiral galaxies. In: The nuclei of normal galaxies: Lessons from the Galactic Center, Genzel R., Harris A.I. (eds.), NATO ASI series C 445, 13
- (48) Pietsch W., Vogler A., Kahabka P., Jain A., Klein U., 1994, A&A 284, 386
- (49) Pietsch W., Trinchieri, G., Vogler, A., 1998, A&A 340, 351
- (50) Prada F., Manchado A., Canzian B., et al., 1996, ApJ 458, 537
- (51) Predehl P., Schmitt J.H.M.M., 1995, A&A 293, 889
- (52) Ptak A., Serlemitsos P., Yaquoob T., Mushotzky R., Tsuru T., 1997, AJ 113, 1286
- (53) Ptak A., Griffiths R., 1999, ApJ 517, 85
- (54) Puche D., Carnignan C., 1988, AJ 95, 1025
- (55) Puche D., Carnignan C., Van Gorkom J.H., 1991, AJ 101, 456
- (56) Raymond J.C., Cox D.P., Smith B.W., 1976, ApJ 204, 290
- (57) Raymond J.C., Smith B.W., 1977, ApJS 35, 417
- (58) Read A.M., Ponman T.J., Wolstencroft R.D., 1995, MNRAS 277, 397
- (59) Read A.M., Ponman T.J., Strickland D.K., 1997, MNRAS 286, 626
- (60) Read A.M., Pietsch W., 1999, A&A 341, 8
- (61) Sams III B.J., Genzel A., Eckart A., Tacconi-Garman L., Hofmann R., 1994, ApJ 430, L33
- (62) Schulz H., Wegner G., 1992, A&A 266, 167
- (63) Scoville N.Z., Doifer B.T., Neugebauer G., Young J.S., Matthews K., Yerka J., 1985, ApJ 289, 129
- (64) Shaver P.A., McGee R.X., Newton L.M., Danks A.C., Pottasch S.R., 1983, MNRAS 204, 53
- (65) Snowden S.L., Pietsch W., 1995, ApJ 452, 627
- (66) Snowden S.L., Hasinger G., Jahoda K., et al., 1994, ApJ 430, 601
- (67) Sofue Y., Wakamatsu K.-I., Malin D.F., 1994, AJ 108, 2102
- (68) Spitzer L.(Jr.), 1956, ApJ 124, 20
- (69) Strickland D.K., Ponman T.J., Stevens I.R., 1997, A&A 320, 378
- (70) Strickland D.K., Stevens I.R., 1998, MNRAS 297, 747
- (71) Suchkov A.A., Dinshaw S.B., Heckman T.M., Leitherer C., 1994, ApJ 430, 511
- (72) Tomisaka K., Ikeuchi S., 1988, ApJ 330, 695
- (73) Trümper J., 1983, Adv. Space Res. 2, 241
- (74) Trümper J., Hasinger, G., Aschenbach, B., et al., 1991, Nat 349, 579
- (75) Tully R.B., 1988, ‘Nearby Galaxy Catalog’, Cambridge University Press
- (76) Turner B.E., 1985, ApJ 299, 312
- (77) Ulrich M.-H., 1978, ApJ 219, 424
- (78) Ulvestad J.S., Antonucci R.R.J., 1997, ApJ 488, 621
- (79) Vogler A., Pietsch W., 1996, A&A 311, 35
- (80) Vogler A., Pietsch W., 1997, A&A 319, 459
- (81) Vogler A., Pietsch W., 1999, A&A 342, 101 (Paper I)
- (82) Vogler A., Pietsch W., Kahabka P., 1996, A&A 305, 74
- (83) Vogler A., Pietsch W., Bertoldi F., 1997, A&A 318, 768
- (84) Wang Q., Hamilton T., Helfand D.J., Wu X., 1991, ApJ 374, 475
- (85) Wang Q.D., Walterbos R.A.M., Steakley F.M., Norman C.A., Braun R., 1995, ApJ 439, 176
- (86) Zimmermann H.U., Becker W., Belloni T., et al., 1997, “EXSAS users guide”, July 1997 edition