Molecular gas in blue compact dwarf galaxies
Abstract
Blue compact dwarf galaxies (BCDGs) are currently undergoing strong bursts of star formation. Nevertheless, only a few of them have been clearly detected in CO, which is thought to trace the ”fuel” of star formation: H2. In this paper we present a deep search for CO and emission lines in a sample of 8 BCDGs and two companions. Only 2 of them (Haro 2 and UM 465) are detected. For the other galaxies we have obtained more stringent upper limits on the CO luminosity than published values. We could not confirm the previously reported “detection” of CO for the galaxies UM 456 and UM 462. We analyze a possible relation between metallicity, CO luminosity, and absolute blue magnitude of the galaxies. We use previously determined relations between (H and the metallicity to derive molecular cloud masses or upper limits for them. With these “global” -values we find that for those galaxies which we detect in CO, the molecular gas mass is similar to the HI mass, whereas for the non-detections, the upper limits on the molecular gas masses are significantly lower than the HI mass. Using an LVG (Large Velocity Gradient) model we show that depends not only on metallicity but also on other physical parameters such as, volume density and kinetic temperature, which rises the question on the validity of “global” -factors.
keywords:
Galaxies: dwarf – galaxies: ISM – galaxies: starburst – radio lines: ISM| Galaxy | Distance | Abundance | rms (1 ) | ||||||
| (1950) | (1950) | Mpc | 12+log O/H | [ km s-1] | [ km s-1] | [mK] | [K km s-1] | [106 K km s-1pc2] | |
| UM 422 | 11 17 37 | +02 48 16 | 21.3 | 1600 | – | 3.6 | |||
| 1600 | – | 7.5 | |||||||
| UM 439 | 11 34 02 | +01 05 38 | 14.7 | 1097 | – | 4.6 | |||
| 1097 | – | 11.6 | |||||||
| UM 446 | 11 39 02 | –01 37 26 | 24.0 | – | 1792 | – | 21.9 | ||
| 1792 | – | 44.7 | |||||||
| UM 452 | 11 44 26 | –00 00 57 | 19.2 | – | 1439 | – | 7.7 | ||
| 1439 | – | 11.6 | |||||||
| UM 456 | 11 48 01 | –00 17 23 | 23.3 | 1749 | – | 4.3 | |||
| 1749 | – | 8.7 | |||||||
| UM 456A | 11 48 00 | –00 15 30 | 23.3 | – | 1749 | – | 14.5 | ||
| 1749 | – | 27.1 | |||||||
| UM 456B | 11 47 53 | –00 17 00 | 23.3 | – | 1749 | – | 9.1 | ||
| 1749 | – | 18.2 | |||||||
| UM 462 | 11 50 13 | –02 11 26 | 13.9 | 1051 | – | 7.8 | |||
| 1051 | – | 14.4 | |||||||
| UM 465 | 11 51 38 | +00 24 56 | 15.4 | 1144 | 17 | 7.8 | 0.64 | 3.12 | |
| 1144 | 35 | 18.8 | 1.47 | 2.91 | |||||
| Haro 2a | 10 29 22 | +54 39 24 | 20.5 | 1401 | 19 | 9.3 | 4.2 | 36.7 | |
| 1452 | 70.0 | ||||||||
| 1401 | 18 | 14.0 | 6.44 | 22.7 | |||||
| 1452 | 70.0 | ||||||||
| Remarks: First line for each galaxy refers to the () transition, second line to the () transition. 3 upper limits to are obtained with km s-1. The distances are taken from Taylor et al. (1998) for most of the UM galaxies and from Loose & Thuan (1986) for Haro 2. The distance of UM 446 was obtained for a Hubble flow with H0=75 km s-1Mpc-1. The velocities indicated in Column 7 are derived from H I widths for the non-detections. Metallicitites are taken from Campos-Aguilar, Moles & Masegosa (1993) for UM galaxies, who give a general uncertainty for the values of better than 0.1 dex, and from Sage et al. (1992) for Haro 2. : Two components found. : Errors include only statistical errors, not systematic ones. |
| Source | Transition | rms | ||
| [] | [] | [mK] | ||
| UM 422 | 0 | 0 | 12CO(1-0) | 7 |
| 12CO(2-1) | 18 | |||
| –20 | 20 | 12CO(1-0) | 7 | |
| 12CO(2-1) | 13 | |||
| 20, | 0 | 12CO(1-0) | 8 | |
| 12CO(2-1) | 22 | |||
| –20 | 0 | 12CO(1-0) | 4 | |
| 12CO(2-1) | 4 | |||
| 0 | 20 | 12CO(1-0) | 3 | |
| 12CO(2-1) | 9 | |||
| UM 439 | 0 | 0 | 12CO(1-0) | 5 |
| 12CO(2-1) | 18 | |||
| 10 | –20 | 12CO(1-0) | 5 | |
| 12CO(2-1) | 13 | |||
| –10 | 20 | 12CO(1-0) | 7 | |
| 12CO(2-1) | 20 | |||
| 10 | 0 | 12CO(1-0) | 7 | |
| 12CO(2-1) | 9 | |||
| UM 446 | 0 | 0 | 12CO(1-0) | 16 |
| 12CO(2-1) | 22 | |||
| UM 452 | 0 | 5 | 12CO(1-0) | 5 |
| 12CO(2-1) | 7 | |||
| UM 456 | 0 | 0 | 12CO(1-0) | 8 |
| 12CO(2-1) | 13 | |||
| 10 | 10 | 12CO(1-0) | 5 | |
| 12CO(2-1) | 9 | |||
| 10 | 0 | 12CO(1-0) | 4 | |
| 12CO(2-1) | 9 | |||
| 20 | 20 | 12CO(1-0) | 7 | |
| 12CO(2-1) | 11 | |||
| UM 456 A | 5 | –5 | 12CO(1-0) | 11 |
| 12CO(2-1) | 13 | |||
| UM 456 B | 0 | 0 | 12CO(1-0) | 7 |
| 12CO(2-1) | 11 | |||
| UM 462 | 10 | 5 | 12CO(1-0) | 5 |
| 12CO(2-1) | 11 | |||
| UM 465 | 2 | 0 | 12CO(1-0) | 4 |
| 12CO(2-1) | 8 | |||
| –18 | 10 | 12CO(1-0) | 4 | |
| 12CO(2-1) | 9 | |||
| –8 | 10 | 12CO(1-0) | 7 | |
| 12CO(2-1) | 11 | |||
| Haro 2 | 0 | 0 | 12CO(1-0) | 18 |
| 12CO(2-1) | 24 | |||
| 10 | 0 | 12CO(1-0) | 20 | |
| 12CO(2-1) | 31 | |||
| 0 | 10 | 12CO(1-0) | 19 | |
| 12CO(2-1) | 33 | |||
| Remarks: : Offsets are relative to positions in Table 1. | ||||
1 Introduction
A particular class of dwarf galaxies named Blue Compact Dwarf Galaxies (BCDGs, Sargent & Searle, [Sargent & Searle, 1970]) has seen increasing interest among astrophysicists because of their extreme current star forming activity which is in contrast to their apparent “youth” in terms of chemical evolution. BCDGs represent about 5% of all dwarfs [Salzer 1989], [Sage et al., 1992] and are among the smallest star forming galactic systems known.
One of their outstanding properties is that their optical spectra are dominated by lines characteristic of HII regions, which is the reason why they are frequently termed “HII galaxies”. From optical spectroscopy we know that many HII galaxies have low heavy element abundances, typically down by a factor of three up to more than twenty compared to the solar neighbourhood [Kunth & Östlin, 2000].
It quickly became clear that these objects must form stars in what is called a burst, otherwise the observed star formation rate would be in conflict with their total gas masses as derived from HI observations [Thuan & Martin, 1981]. Such a burst may last some yrs, with a time span between bursts of the order of 109 yrs. It has been suggested that interaction with companions might trigger their star formation [Brinks, 1990], but Taylor et al. [Taylor et al., 1995] found that only about 60% of HII galaxies have companions, often with masses about of the main galaxy.
One of the most interesting and important issues which has not been settled so far is the molecular gas content of these galaxies. Molecular hydrogen is believed to be the preponderant seed for star formation, so it is a natural assumption that large amounts of H2 should be present in BCDGs. Yet the results have been anything but conclusive so far. Following early attempts to detect the CO line in BCDGs [Tacconi & Young, 1984], there have been a number of observations to confirm or reject those inconclusive measurements (e.g. Sage et al. [Sage et al., 1992], hereafter SSLH; Gondhalekar et al. [Gondhalekar et al., 1998]; Taylor, Kobulnicky & Skillman [Taylor et al., 1998], hereafter TKS). Surprisingly, the results remained partially contradictory, as for instance in the case of II Zw 40 (Arnault et al. [Arnault et al., 1988]; SSLH), although improved instrumentation had been involved.
Prompted by the difficulty to detect the CO line – relied upon as a good tracer of molecular hydrogen content – in BCDGs, some of the pertinent publications prematurely concluded that molecular gas is deficient in these systems. However, part of the difficulties to detect CO might have been due to beam filling and sensivitity problems. Taking e.g. 30 Dor in the LMC as a template giant star-forming complex, it is clear that, if placed at some larger distance and covered by the beam, it could have escaped detection, as CO brightness is rather low there, due to strong photo-dissociation in the high interstellar radiation field [Cohen et al., 1988]. The same might be true for BCDGs. In this case, high-sensitivity mapping might reveal previously undetected CO emission.
We have therefore conducted a search for CO in gas-rich (based on HI) HII galaxies, using the IRAM 30 m telescope. In contrast to previous projects (e.g. SSLH, Gondhalekar et al. [Gondhalekar et al., 1998]), our observations not only consisted of single pointings towards the brightest position in the galaxies, but involved mapping a number of positions in them, to detect possible gas concentrations away from photodissociation regions. Obtaining sensitive upper limits to the CO luminosity in these systems is as much a goal of this study as detecting emission.
In Section 2 we present details of our observations. In Section 3 we present our data, and compare it with previous results. In the subsequent section (Sec. 4) we discuss possible causes for the detections and non-detections. This section is divided into three subsections: Section 4.1 deals with the physical conditions of the gas derived from a LVG model; in Section 4.2 we analyze the relationship between metallicity and CO luminosity; finally, in Section 4.3 we discuss the factor problem, which has been heatedly debated in the past years and has not yet found a clear resolution. Our conclusions are presented in the last section (Sec. 5).
2 Observations
The CO observations were carried out in October 1996 with the IRAM 30 m Telescope on Pico Veleta in Spain. Our target galaxies – except Haro 2 – have been selected from the sample examined by [Taylor et al., 1995] in the 21 cm line of atomic hydrogen. Pointing positions were chosen from peak HI column densities, as seen in their high angular resolution VLA observations. The basic properties of the galaxies are listed in Table 1. In the transition (115 GHz) the HPBW is 22′′, whilst in the transition (230 GHz) it is 5. At the distance of the galaxies, 14.7 Mpc to 23.3 Mpc, the beam size at 115 GHz corresponds to 1.6 kpc to 2.5 kpc.
Two independent SIS receivers have been used simultaneously at each frequency. More than 90% of our observations had 600 K both at 230 and at 115 GHz. An autocorrelator with a spectral resolution of 0.625 MHz at 115 MHz and 1.25 MHz at 230 MHz and a filter spectrometer with 1 MHz resolution were used. A baseline of zeroth or first order was always subtracted, and the spectra were summed up to improve the signal-to-noise ratio; the spectra were finally smoothed to roughly the same velocity resolution (5.2 km s-1 for the and 4.8 km s-1 for the transition). Spectra were obtained with a wobbling secondary mirror with a wobbler throw of in azimuth. All temperatures throughout this article refer to main beam brightness with derived using and .
3 Results
Table 1 gives an overview of the observed galaxies and some of their known properties, and lists results of the galaxy-averaged CO spectra. We mapped most of the galaxies in our sample in order to cover most of the area where emission (perhaps in “hot spots”) might be present, and obtained low rms noise levels. Nevertheless, we detected CO only in Haro 2 and in UM 465. For all the other galaxies we obtained low upper limits. It is interesting to note that the SMC, with an H2 mass of M☉ would be just detectable with our sensitivity if placed at a distance of 15 Mpc.
In Table 2, all positions observed in all galaxies are listed, with the final rms obtained for single positions. In Fig. 1 and 3, the maps of Haro 2 and UM 465 are displayed.
In Table 1 we also give a summary of our results. For the detections, we give the parameters of a Gaussian fit which we obtained for the lines averaged over all positions. In all other cases, upper limits to the CO intensity were calculated, again based on the average of all positions. These upper limits were derived as , where is the rms noise level obtained in the baseline range, is the velocity width of each channel and is the number of channels involved. We always assumed a total line width of 70 km s-1, as this is the average velocity width one would expect from the CO detections in the literature (see for example SSLH and Gondhalekar et al. [Gondhalekar et al., 1998]). In the case of detections, has been calculated based on Gaussian fits to the spectra. Based on the values, CO luminosities () were calculated. Those for UM 465 and Haro 2 are lower limits, because we did not completely map the CO gas. The other values are upper limits for the galaxies.
| Galaxy | |||||
|---|---|---|---|---|---|
| [′′] | [′′] | [K km s-1] | [ km s-1] | [ km s-1] | |
| Haro 2 | 00 | 00 | |||
| 10 | 00 | ||||
| 00 | 10 | ||||
| UM 465 | –08 | 10 | |||
| 02 | 00 | ||||
| –18 | 10 | ||||
| no line | |||||
| Remarks: First line for each galaxy and position refers to the () transition, second line to the () transition. | |||||
In the following sections we sumarize briefly our main results for the individual galaxies in comparison to previously published data where applicable. We also give a short description of the galaxies as they appear on the Digitized Sky Survey (DSS).
3.1 Haro 2
Haro 2 is a relatively well studied BCDG. Its metallicity is about solar. It has the shape and the brightness profiles of an elliptical galaxy, but possesses a brilliant blue nucleus which shows intense star formation. The absolute blue magnitude is M [Loose & Thuan, 1986]. A comparison between the UV, optical and FIR spectra of Haro 2 with evolutionary population synthesis models has allowed to estimate the age of the youngest star formation episode to be 4 million years, followed by two older bursts, the younger of which was over 20 million years ago.

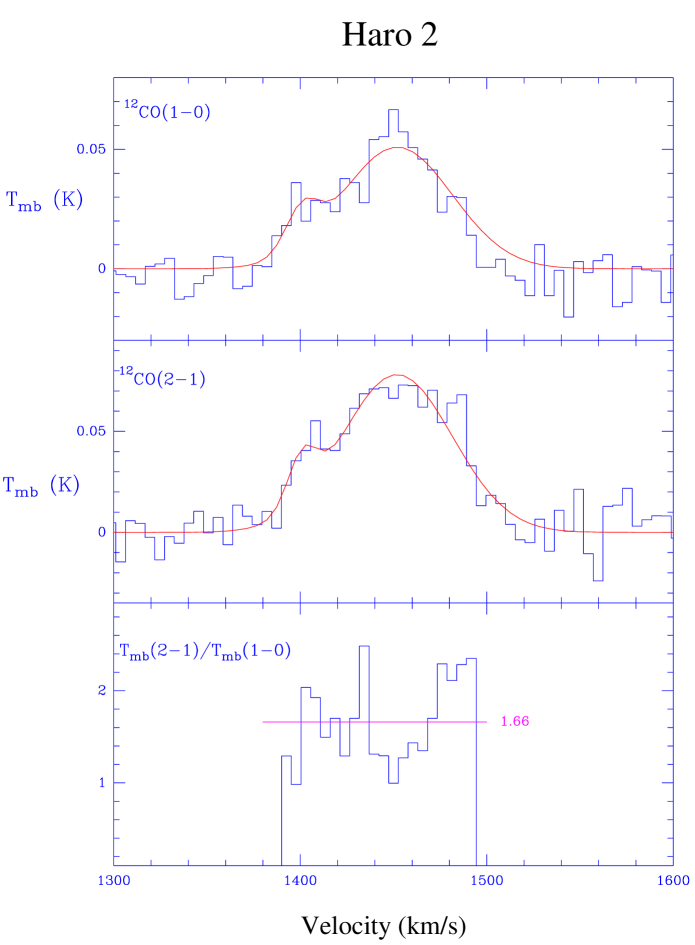
Our CO observations confirm the previous detection of CO in both the and transitions by SSLH and by Knapp & Rupen [Knapp & Rupen, 1996] in the latter transition. The emission is clearly extended, as seen in Fig. 1, with significant lines in all positions (see Tab. 3). Moreover, Fig. 2 suggests that the line in Haro 2 has two components which are seen at the same velocities in both transitions. Recently, observations with the IRAM interferometer fully confirmed this finding (Fritz et al., in prep.). The line ratio of the () to the () line seems to be independent of the velocity (see Fig. 2). Following the path of SSLH, we calculate two extreme line ratios, one assuming the source to be point-like, and one assuming a uniformly filled beam. In the latter case, since a beam filling factor of 1 is assumed, the ratio of the lines is effectively the ratio of integrated lines. This is also true if the filling factor is , but equal for both transitions (i.e. in the presence of large scale clumping). For a point source the other extreme is considered: one assumes that the (2-1)/(1-0) intensity ratio is overestimated by exactly the ratio of the two beam areas, so that the maximum line ratio must be divided by the ratio of the squares of the two beam widths (). The results are shown in Table 4 and range from 0.5 to 1.5. The differences between our ratios and those of SSLH might be partly due to different main beam efficiencies used for the two transitions (not specified by SSLH).
3.2 UM 422
The dominant HII region of this dwarf galaxy is embedded in an extended faint irregular stellar body. We have obtained 5 independent spectra; none of them shows significant CO emission. UM 422 has also been observed with a single pointing by TKS using the NRAO 12 m telescope. We confirm their non-detection with a significantly lower upper limit.
3.3 UM 439
In the optical, UM 439 has a slightly elongated compact appearance with one prominent HII region south of the center. High resolution HI observations by van Zee, Skillman & Salzer [Van Zee et al., 1998] reveal that the star formation is taking place in the peak of the extended gas distribution. It was observed in CO by SSLH and by Gondhalekar et al. [Gondhalekar et al., 1998]. We confirm their non-detections. Our upper limit to is a factor of 2.4 lower than that of SSLH obtained with the NRAO 12 m telescope and a factor of 2.5 lower than that obtained with the Onsala 20 m telescope. Because we additionally observed 4 independent positions with higher angular resolution than those just mentioned, our upper limit to is significantly lower than those previously published.
3.4 UM 446
The stellar component of this galaxy, as detected in optical imaging, is very faint. We have observed it only in the central position. Our upper limit for CO is the first one ever published.
3.5 UM 452
We have observed this galaxy towards one position only, where the optical emission is strongest. The optical extent of the galaxy looks much smaller as compared to the HI. The mass of HI is quite low, M☉ [Martin, 1999].
3.6 UM 456
The star forming regions in this galaxy are confined to the center of an extended and distorted stellar component. Taylor et al. [Taylor et al., 1995] have detected two companions of UM 456. UM 456 A seems to be a pure “HI cloud” with no optical counterpart, whereas UM 456 B is seen both in HI and on optical images. Both companions seem to be gravitationally bound to UM 456. None of them shows CO; with our better rms we do not confirm the “marginal detection” of UM 456 by SSLH; our upper limit is a factor of 6 lower than their claimed detection.
3.7 UM 462
The two BCDGs UM 461 and UM 462 seem to form a bound system with a linear separation of about 70 kpc at a distance of 13.9 Mpc. Two centrally located knots of star formation dominate the optical image of UM 462. They are associated with the peak of the HI column density [Van Zee et al., 1998]. The claimed detection of CO in UM 462 by SSLH could not be confirmed; our upper limit is a factor of 2 lower. This galaxy had also been observed by Gondhalekar et al. [Gondhalekar et al., 1998] with a higher upper limit obtained at lower angular resolution.
3.8 UM 465
The optical appearance of this dwarf galaxy is circular in shape with an exponential law brightness distribution [Doublier et al, 1997]. The nuclear starburst and extended dust lanes and patches are well resolved by HST imaging [Malkan et al., 1998]. A faint nearby object was not detected in HI [Taylor et al., 1995] but confirmed as a physical neighbour [Doublier et al, 1997] using 6 m telescope spectroscopy. The HST images of this companion reveal an irregular structure. While SSLH reported a marginal detection in UM 465 of CO, the present work delivers a clear one. The CO emission is extended in this galaxy (see Fig. 3), but with a lower intensity than Haro 2. Only in one of the three positions no line was detected. The calculated line ratios are listed in Table 4, and for this galaxy they range between 0.4 and 1.3.
| Source | Point source | Uniform filling | Reference |
|---|---|---|---|
| Haro 2 | 0.310.04 | 1.00.1 | SSLH |
| 0.490.03 | 1.510.07 | this worka | |
| UM 465 | 0.270.11 | 0.910.36 | SSLH |
| 0.420.11 | 1.300.35 | this work | |
| Remarks: The errors are derived formal errors of the fits. : The two components have been averaged. |

4 Discussion
Our deep observations corroborate the difficulty to detect CO in BCDGs. Only two of the galaxies observed show significant CO emission; in both cases it is extended in both transitions. We note here that these two sources are those with the highest metallicity in our sample. In the other sources, even with observations towards several positions, we were unable to find CO emission. One could be tempted to say that these galaxies are void of molecular gas, but this conclusion is premature because the relationship of CO emission and H2 content in a galaxy depends on many factors (Maloney & Black [Maloney & Black, 1988], Israel [Israel et al., 1997]), some of which are not fully understood. Therefore, one can only conclude from the detection of CO that H2 is present, whereas the absence of CO does not necessarily imply a lack of H2.
4.1 Physical conditions of the gas

As a first step in our analysis, we try to infer some information on the physical properties of the CO-emitting gas in BCDGs. We make use of a large velocity gradient (LVG) model to predict ratios for the lowest CO lines. The basic LVG assumption is that of a systematic monotonic velocity gradient, which allows to treat the molecular excitation as a local problem (see de Jong, Chu & Dalgarno, [De Jong et al., 1975] and White [White, 1977] for details). This is certainly an idealization of extra-galactic cloud complexes; however, an LVG code does not require detailed knowledge of the velocity field. As a first rough estimate this model further assumes constant density and kinetic temperature within the molecular cloud. In Fig. 4, we show an example of the dependence of line ratios on (H2) and . For this figure, ( km s-1pc has been assumed. This corresponds to a velocity gradient of 1 km s-1pc-1 and an abundance of [CO/H2] or, due to how the LVG code is constructed, to a velocity gradient of 5 km s-1pc-1 and [CO/H2]=10-4. The figure shows the ratios of the intensities of the to transitions, 2/1, and that of and the lines, 3/2.
As discussed above, for Haro 2 and UM 465 the line ratios are and , respectively, depending on the filling of the sources in our beam. From our limited mapping of the two galaxies, we know that the sources are extended and the “point source” limit can be firmly excluded. On the other hand, observations of Haro 2 obtained with the Plateu de Bure Interferometer (Fritz et al., in prep.) show that the galaxy does not fill the beam of the IRAM 30 m telescope uniformly. It is then reasonable to expect a value for the line intensity ratios in between those listed in Table 4, and may thus be close to unity.
Adopting a ratio between 0.8 and 1.0, we can derive from Fig. 4 that the gas is either at high temperatures with medium densities ( a few hundred cm-3) or at high densities ( cm-3) and low temperatures ( K). More stringent limits on volume density and kinetic temperatures require observations of higher 12CO transitions and/or 13CO transitions. These transitions are expected to be very weak though, and thus difficult and time-consuming.
4.2 Dependence of the CO luminosity on metallicity and absolute blue magnitude
We subsequently examine the relation of the CO emission and metallicity. Because only the two galaxies in our sample with the highest metallicities are detected in CO, one could expect that CO luminosity depends on metallicity. Therefore, we plot our CO luminosities () – listed in Table 1 – vs. the metallicities of the galaxies of our sample. Since not all of the galaxies have known metallicities, we are left with only 6 galaxies. These are shown in Fig. 5. In this figure we also include the data points given by TKS because they represent the most comprehensive sample of CO observations of dwarf galaxies with metallicity determinations. We only selected those dwarf galaxies from the sample with metallicities better determined than 0.1 dex; these galaxies are, however, not necessarily classical BCDGs.

We have chosen the CO luminosity because it is largely independent of distance, although the error in the distance determination enters as the square in the CO luminosity. Furthermore, the CO luminosity is directly proportional to the H2 mass corrected for helium (), with in M☉ and in K km s-1 pc2. (in units of molecules cm-2 (K km s-1)-1) is the well-known but poorly determined factor which relates the molecular hydrogen column density to the observed integrated CO line intensity ().
Fig. 5 shows a general trend that galaxies with higher metallicities have higher CO luminosities, although no functional correlation is visible. TKS have recently proposed that galaxies with metallicities below 7.9 are basically undetectable in CO. Our data do not contradict this finding. For galaxies close to that limit we were only able to derive upper limits. We note, however, that even above that limit there are galaxies not detected in CO.
Although it is qualitatively expected that a higher metallicity leads to a higher because of the availability of the building blocks of the CO molecule, Fig. 5 shows that the oxygen abundance cannot be the only factor influencing the CO luminosity. Because BCDGs are actively star-forming galaxies, the UV radiation field may be locally high. This plays two conflicting roles for CO: on the one hand, it heats the gas, so that the excitation temperature is higher and CO is brighter; on the other hand, if hard enough, it destroys CO via photodissociation, thus the CO emission becomes weaker. Pak et al. [Pak et al., 1998] and Bolatto, Jackson & Ingalls [Bolatto et al., 1999] have studied these effects and found that the CO emitting regions are effectively smaller in low-metallicity environments and most of the carbon is present in atomic form. The net effect in galaxies with low metallicities is that, due to low beam filling of the clouds, the molecular gas becomes invisible in the CO lines and might be better traced in the fine structure lines of CI and CII. This different beam filling might be the cause for the dependence of the integrated CO line intensity on the metallicity found by TKS.
To study the effect of the radiation field on the CO luminosity, we labelled the values in the CO luminosity-metallicity plane with the absolute blue magnitudes of the galaxies (right side of Fig. 5). Again there is no simple relation between any two of these quantities. However, there is evidence for an influence of both metallicity and absolute blue magnitude on the CO luminosity, meaning that higher blue magnitudes lead to higher CO luminosity for a given metallicity. It also appears that at lower metallicities a higher absolute blue magnitude is necessary to reach a certain CO luminosity. Clearly, more well-observed galaxies are necessary to study the relation between the three quantities.
4.3 Molecular gas masses and the factor
Directly linked to the question of the dependence of the CO luminosity on metallicity and radiation field is the question of which factor is applicable to low-metallicity galaxies. A number of studies have examined possible correlations between and the metallicity (e.g. Dettmar & Heithausen [Dettmar & Heithausen, 1989], Wilson [Wilson, 1995], Verter & Hodge [Verter & Hodge, 1995], Arimoto, Sofue & Tsujimoto [Arimoto et al., 1996]). Klein [Klein, 1999] has proposed an additional dependence of on the cosmic ray flux as judged from the radio continuum brightness.
An independent determination of the factor for our BCDG sample would be useful to determine their molecular masses; this is, however, beyond the scope of this paper. A reliable value for has been established for the disk of the Milky Way, . The currently best accepted value is molecules cm-2 K-1 km s-1 [Hunter et al., 1997]. factors determined for galaxies with lower metallicities are usually significantly higher (e.g. Cohen et al. [Cohen et al., 1988], Dettmar & Heithausen [Dettmar & Heithausen, 1989]).
| Source | H2) | (HI) | |
| M☉ | M☉ | ||
| UM 422 | 18.6 | 26 | |
| UM 439 | 18.6 | 3.5 | |
| UM 456 | 25.7 | 3.7 | |
| UM 462 | 21.4 | 2.9 | |
| UM 465 | 5.4 | 0.3 | 0.39 |
| Haro 2 | 7.9 | 4.7 | 4.8 |
| Remarks: factors are derived from the metallicity dependence as given by Arimoto et al. [Arimoto et al., 1996], using metallicities from Table 1. is given in units of molecules cm-2 (K km s-1)-1. HI masses for UM galaxies are from Taylor et al. [Taylor et al., 1995], for Haro 2 from SSLH. |
In the following, we assume that the correlation between , derived from a virialization analysis of several galaxies, and the oxygen abundance obtained by Arimoto et al. [Arimoto et al., 1996] gives factors applicable to our galaxy sample. H2 masses derived under this assumption are listed in Table 5. Also given are the HI masses as derived by [Taylor et al., 1995] for the UM galaxies and by SSLH for Haro 2. One remarkable result from this calculation is that those galaxies undetected in CO have upper limits on the molecular gas mass significantly below the HI mass, whereas in the two galaxies where CO is detected, HI and H2 masses are about the same.
The factors used here to derive molecular gas masses are global factors. Studying the CO emission of the Magellanic Clouds with different angular resolutions Rubio, Lequeux & Boulanger [Rubio et al., 1993] noted that the derived factor depends on the linear resolution, implying that the local value is lower than the global one.
In order to calculate the local we use an LVG approximation assuming that H2 and CO share the same volume. The LVG approximation can then be used to derive the H2 column density, , from , where is the H2 volume density, is the line width and is the velocity gradient. Since , one can derive from .

The dependence of the local on varying volume density and kinetic temperature is shown in Fig. 6. The velocity gradient is fixed to 2 km s-1pc-1. In the top panel, the abundance is [CO/H2]=10-4; in the bottom panel [CO/H2]= 10-5. These are extreme values for the metallicities of BCDGs. is indicated by the thick solid line. We note that, once the density becomes high enough, will not change significantly any more, due to the growth of the optical depth, and is independent of the abundance. On the other hand, at lower densities and kinetic temperatures, changes significantly depending on (H2) and for a given metallicity.
These simple calculations indicate that does not only depend on the metallicity of a galaxy. Physical parameters, such as average volume density and kinetic temperature, play important roles, if the density is below cm-3 and/or the kinetic temperature is below 50 K, values found in many molecular clouds in the Milky Way. The -factor, that we find for a standard density of cm-3 and a low-metallicity environment, is low, i.e. close to Galactic. In contrast, derived from the formula of Arimoto et al. [Arimoto et al., 1996] is higher by an order of magnitude. This supports the concept of large amounts of hidden gas - either atomic or molecular.
Interferometric observations of BCDGs might help to resolve this issue. Such a study of the nearby post-starburst dwarf NGC 1569, a galaxy that may be considered as a nearby BCDG in a post-starburst phase, yielded a rather high value of , based on virial masses of resolved GMCs [Taylor et al., 1999]. This indicates that this method, which is also the basis of Arimoto’s formula, is sensitive to the ‘hidden’ H2 and tends to yield global values for . In contrast, we expect to find local values if line ratio studies encompassing several CO isotopomers become available, since these studies directly probe the physics of the gas from which the CO emission arises.
5 Conclusions
We have searched for emission from the 12CO ( and ) transitions in 10 dwarf galaxies, 8 of which are BCDGs and 2 are the companions of one of these. We detected CO in 2 of them (Haro 2 and UM 465) and found it to be extended in both galaxies. Although we mapped part of the other galaxies, we were unable to detected CO. We obtained very stringent upper limits. We could not confirm the “marginal detection” of CO in UM 456 and UM 462 previously reported by SSLH.
The observed line ratios of the to transitions are not very sensitive to changes in the kinetic temperature. Modelling the ratio with a simple LVG code helps only to exclude low densities. Higher CO transitions and/or observations of CO isotopomers will help to get more stringent limits on these physical parameters.
We could not find any simple relation between metallicity and CO luminosity. Molecular gas masses for the galaxies are derived assuming the relation between and metallicity given by [Arimoto et al., 1996]. We find that for those galaxies detected in the CO lines the molecular gas mass is comparable to the HI mass, whereas for those galaxies undetected in CO the HI mass is significantly larger than the limits on the molecular gas mass.
Even in the sources where CO has not been detected, we do not argue against the presence of H2. While it is certainly possible that in the extreme environment of a BCDG not just CO but also H2 is destroyed, at least in regions close to young massive stellar clusters, a picture in which a large amount of H2 exists without CO is attractive. Sensitive observations of CI and CII in these galaxies would thus be desirable in the future to shed light on this issue.
Acknowledgements
L.T.B. would like to thank Prof. Loretta Gregorini and the Socrates/Erasmus project which made this exchange possible and financed it, the Faculty of Science of the University of Bologna and the C.N.A.A. (Consorzio Nazionale per l’Astronomia e l’Astrofisica) for grants supporting this work. This project was supported by the Deutsche Forschungsgemeinschaft via the Graduiertenkolleg “The Magellanic Clouds and other Dwarf Galaxies”.
References
- [Arimoto et al., 1996] Arimoto N., Sofue Y., Tsujimoto T., 1996, PASJ 48, 275
- [Arnault et al., 1988] Arnault P., Casoli F., Combes F., Kunth D., 1988, A&A 205, 41
- [Barone, 1998] Barone L.T., 1998, Tesi di Laurea, Università degli Studi di Bologna.
- [Bolatto et al., 1999] Bolatto A.D., Jackson J.M., Ingalls J.G., 1999, AJ 513, 275
- [Brinks, 1990] Brinks E. 1990, in Dynamics and Interaction of Galaxies, Ed. R. Wielen, Springer Verlag, Berlin, p. 146
- [Camposaguilar et al., 1993] Campos-Aguilar A., Moles M., Masegosa J., 1993, AJ 106, 1784
- [Cohen et al., 1988] Cohen R.S., Dame T.M., Garay G., Montani J., Rubio M., Thaddeus P., 1988, ApJ 331, L95
- [De Jong et al., 1975] de Jong T., Chu S.I., Dalgarno A., 1975, ApJS 199, 69
- [Dettmar & Heithausen, 1989] Dettmar R.J., Heithausen A., 1989, ApJ 344, L61
- [Doublier et al, 1997] Doublier V., Comte G., Petrosian A., Surace C., Turatto M., 1997, A&AS 124, 405
- [Gondhalekar et al., 1998] Gondhalekar P.M., Johansson L.E.B., Brosch N., Glass I.S., Brinks E., 1998, A&A 335, 152
- [Hunter et al., 1997] Hunter S.D., Bertsch D.L., Catelli J.R., et al., 1997, ApJ, 481, 205
- [Israel et al., 1997] Israel F.P., 1997, A&A 328, 471
- [Klein, 1999] Klein U.: 1999, Molecular gas in dwarf galaxies. In: XVIII Moriond Astrophysics Meeting (14-21 March 1998), Dwarf galaxies and Cosmology, Thuan T.X., Balkowski C., Cayatte V., Vân J.T.T. (eds.), In press.
- [Knapp & Rupen, 1996] Knapp G.R., Rupen M.P., 1996, ApJ 460, 271
- [Kunth & Östlin, 2000] Kunth D., Östlin G., 2000, A&AR (in press)
- [Loose & Thuan, 1986] Loose, H.-H., Thuan, T.X., 1986, ApJ 309, 59
- [Malkan et al., 1998] Malkan M.A., Gorjian V., Tam R., 1998, ApJS 117, 25
- [Maloney & Black, 1988] Maloney P., Black J.H., 1988, ApJ 325, 389
- [Martin, 1999] Martn M.C., 1999, A&A 131, 77
- [Pak et al., 1998] Pak S., Jaffe D.T., van Dishoeck E.F., Johansson L.E.B., Booth R.S., 1998, ApJ 498, 735
- [Rubio et al., 1993] Rubio M., Lequeux J., Boulanger F., 1993, A&A 271, 9
- [Sage et al., 1992] Sage L.J., Salzer J.J., Loose H.-H., Henkel C., 1992, A&A 265, 19 (SSLH)
- [Salzer 1989] Salzer J.J., 1989, ApJ 347, 152
- [Sargent & Searle, 1970] Sargent W.L.W., Searle, L., 1970, ApJ 162, L155
- [Searle & Sargent, 1972] Searle L., Sargent W.L.W., 1972, ApJ 173, 25
- [Tacconi & Young, 1984] Tacconi, L.J., Young J.S., 1984, ApJ 290, 602
- [Taylor et al., 1995] Taylor C.L., Brinks E., Grashuis R.M., Skillman E.D., 1995, ApJS 99, 427
- [Taylor et al., 1998] Taylor C.L., Kobulnicky H.A., Skillman E.D., 1998, AJ 116, 2746 (TKS)
- [Taylor et al., 1999] Taylor C.L., Hüttemeister S., Klein U., Greve A, 1999, A&A 349, 424
- [Thuan, 1983] Thuan, T.X., 1983, ApJ 268, 667
- [Thuan & Martin, 1981] Thuan, T.X., Martin, G.E., 1981, ApJ 247, 823
- [Verter & Hodge, 1995] Verter F., Hodge P., 1995, ApJ 446, 616
- [White, 1977] White R.F., 1977, ApJ 211, 744
- [Wilson, 1995] Wilson C.D., 1995, ApJ 448, L97
- [Van Zee et al., 1998] van Zee L., Skillman E.D., Salzer J.J., 1998, AJ 116, 1186