The European Large Area ISO Survey
(ELAIS): Latest Results
\toctitleThe European Large Area ISO Survey
(ELAIS): Latest Results
11institutetext:
Astrophysics Group, Blackett Laboratory, Imperial College of
Science Technology & Medicine, Prince Consort
Rd., London. SW7 2BW, England
22institutetext: Osservatorio Astronomico di Bologna,
Bologna, Italy
33institutetext: Dipartimento di Fisica, Universita degli Studi “Roma TRE”, Roma, Italy
44institutetext: 23 additional institutes as detailed on http://athena.ph.ic.ac.uk/
55institutetext: Astronomy Centre, CPES, University of Sussex, Brighton, BN1 9QJ, England
emailto:S.Oliver@sussex.ac.uk
*
Abstract
We present some recent results from the European Large Area ISO Survey (ELAIS). This survey was the largest non-serendipitous ISO field survey. A preliminary reduction has recently been completed and catalogues of sources released to the community. Early results show strongly evolving source counts. A comprehensive identification programme is underway and a number of extremely luminous objects have already been discovered. This survey provides an exciting legacy from the ISO mission and (amongst many goals) will allow us to provide important constraints on the obscured star-formation history of the Universe.
1 Introduction
The European Large Area ISO Survey (ELAIS [1]) was the largest non-serendipitous ISO [2] field survey, utilising 377 hours of the Open-Time programme. The project is a collaborative venture between 26 institutes from 11 countries, almost exclusively European. ELAIS is the major project supported by the TMR network programme “ISO Surveys”.
The survey covers around 12 square degrees and has observations in four bands covering much of the ISO wavelength window, and m, using both ISO-CAM [3] ISO-PHOT [4].
As with any field survey the goals are varied and include the following:
-
•
Obscured star formation history of the Universe
-
•
Ultra-luminous Infrared Galaxies at high
-
•
Dusty tori around AGN
-
•
Dust in Normal Galaxies
-
•
Dust emission from halo stars
-
•
Detection of new classes of objects
-
•
Investigation of populations making up the FIR background
A more detailed description of the principal intended goals can of the ELAIS survey can be found in Oliver et al. 2000 (ELAIS [1]) though pre-defined goals will not anticipate the full range of possibilities that the data affords.
For a number of the goals we require statistically significant samples of galaxies at high redshifts () compared to e.g. IRAS but relatively modest compared to some deep surveys. It was this requirement that drove the survey area to be of order 10 square degrees. Not only does a large area produce larger samples of galaxies, reducing the Poisson errors, it also reduces the cosmic variance, which would otherwise be significant at these redshifts. Fig. 1 illustrates the minimum survey area required to measure a global quantity (e.g. mean galaxy density) with a given cosmic variance.
This illustrates that ELAIS is complimentary to smaller area deeper surveys ISO such as the HDF [5] which study similar populations at higher redshift but cannot address these populations at lower redshift.

2 ISO Observation Summary
ELAIS comprised four major fields N1-3, S1 and 7 smaller fields S2, X1-6 (three of which were chosen on the basis of known objects and so are not true field surveys). A summary of the area of each field covered in each band is present in Table 1
| Field | Wavelength/¯m | |||
| 6.7 | 15 | 90 | 175 | |
| N1 | 2.67 | 2.56 | 2 | |
| N2 | 2.67 | 2.67 | 2.67 | 1 |
| N3 | 1.32 | 0.88 | 1.76 | |
| S1 | 1.76 | 3.96 | 3.96 | |
| S2 | 0.12 | 0.12 | 0.11 | 0.11 |
| X1 | 0.16 | 0.19 | ||
| X2 | 0.16 | 0.19 | ||
| X3 | 0.16 | 0.19 | ||
| 5.87 | 10.78 | 11.63 | 3.11 | |
| X4 | 0.09 | 0.11 | ||
| X5 | 0.09 | |||
| X6 | 0.09 | 0.11 | ||
3 ELAIS Data Products
In order to provide source lists and maps for rapid follow-up we pursued a two phase strategy for the data processing. During the mission we decided on a “Preliminary” data reduction pipe-line. This processing has been carried out on the complete survey data, producing source lists both for follow-up campaigns and for preliminary scientific analysis. An important stage in the “Preliminary” data reduction for both PHOT and CAM data was that at least two observers examined the time-lines of candidate sources before acceptance. This extremely labour intensive activity ensured that the sources lists are highly reliable. Subsets of the “Preliminary Analysis Catalogues” were released to world via our WWW page (http://athena.ph.ic.ac.uk/) concurrent with the release of data in August 1999. Table 2 shows the number of sources in subsets of the catalogues.
| Cat. | Band | No. | Flux |
|---|---|---|---|
| ¯m | mJy | ||
| PA-WWW | 7 | 273 | 4 |
| 15 | 484 | 4 | |
| 90 | 98 | 150 | |
| PA | 15 | 600 | 2 |
| 90 | 300 | 60 |
The second (“Final Analysis”) phase in the data reduction, which involves reprocessing the entire data sets, using the best post-mission knowledge is now nearing completion. “Final” catalogues will be available withing the ELAIS consortium early in 2000 and to the world shortly thereafter.
4 Results from the ISO Data
The first results to be extracted from the ELAIS data naturally come from the ISO data alone. Much more detailed insight will be forthcoming when the data are combined with follow-up observations and surveys at other wavelengths.


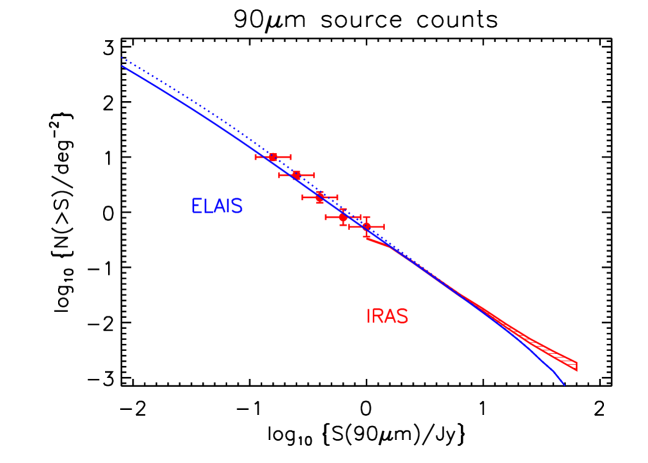
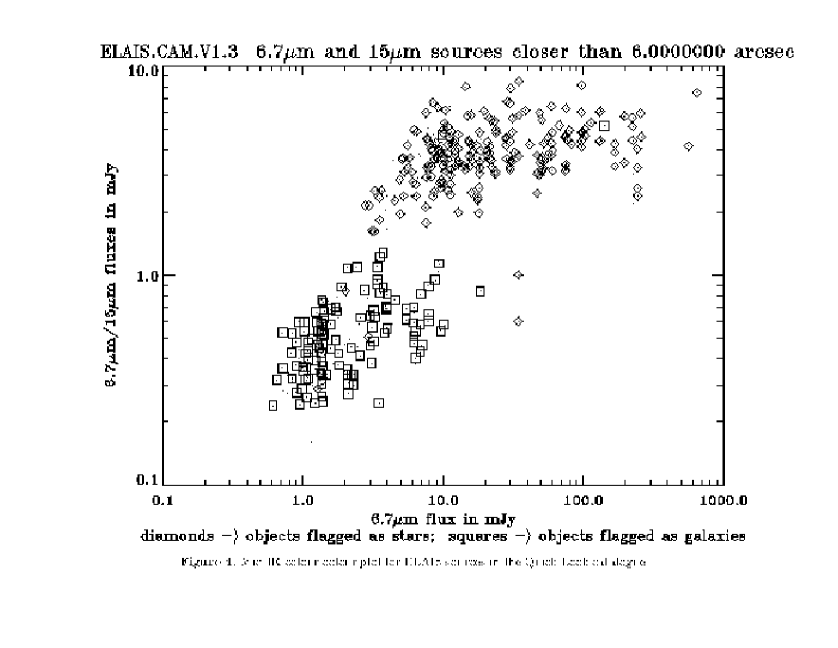
The galaxy number counts have been determined at 6.7, 15 and 90¯m. The 15¯m counts[7], illustrated in Figure 2, have been shown to agree with many strongly evolving population models[8], [9], [10] based on IRAS counts, while being inconsistent with at least one non-evolving model [10]. The 90¯m counts [11], Figure 3, are also consistent with similar strong evolution models. The 6.7 and 15¯m fluxes of morphologically classified stars were in general consistent with model photospheres and, as expected, the 6.7 and 15¯m fluxes provide a good discriminant between stars and galaxies, Figure 4 [12].
5 Follow-up Programme
An extensive follow-up programme is being undertaken, utilising a vast battery of telescopes around the world, and also a number of satellites. The current coverage of the ELAIS fields in un-biased surveys across the electromagnetic spectrum is summarised in Table 3.
The spectroscopic follow-up has not progressed as rapidly as we would have liked. The largest sample of spectra we have come from the S1 field taken in one hour of 2dF time, snatched from an otherwise cloudy night. Another cloudy night on the 2dF produced a second exposure, though this has yet to be analysed.
| Band | 2-10keV | 6.7 | 15 | 90 | 175 | 850 | 21cm | |||
|---|---|---|---|---|---|---|---|---|---|---|
| Depth Units | CGI | mag | mag | mag | mJy | mJy | mJy | mJy | mJy | mJy |
| N1 | ||||||||||
| Area | 0.07 | 9 | 0.5 | 0.4 | 2.6 | 2.6 | 2 | 0.05 | 1.54 | |
| Depth | 23.3,24.2,23.5, | 19.5 | 18.0 | 1 | 3 | 100 | 100 | 8 | 0.1-0.4 | |
| 22.7,21.1 | ||||||||||
| N2 | ||||||||||
| Area | 0.07 | 2 | 0.5 | 0.4 | 2.7 | 2.7 | 2.7 | 1 | 0.05 | 1.54 |
| Depth | 22.5,24.2,23.5, | 19.5 | 18.0 | 1 | 3 | 100 | 100 | 8 | 0.1-0.4 | |
| 22.7,21.1 | ||||||||||
| N3 | ||||||||||
| Area | 1,1,2.3,1,0 | 1 | 1.32 | 0.9 | 1.76 | 1.14 | ||||
| Depth | 22.5,23,23, | 19.5 | 1 | 3 | 100 | 0.1-0.4 | ||||
| 23,0 | ||||||||||
| S1 | ||||||||||
| Area | 2 | 1.2,0,4,3,0 | 1.8 | 4 | 4 | 4 | ||||
| Depth | 23,0,23.5, | 1 | 3 | 100 | 0.24 | |||||
| 23,0 | ||||||||||
Since the Ringberg meeting two surveys using XMM to study the ELAIS fields and a La Palma International Time Programme have been awarded time. The XMM surveys will provide both deeper and wider hard X-ray coverage than is indicated in Table 3 (which refers only to the Chandra and BeppoSax surveys). The International Time is around three weeks on La Palma telescopes, primarily this will be used to obtain spectra for our ISO sources, but will also provide deeper optical and NIR imaging.
6 Early Results from Follow-up Programme
The limited spectroscopy we have been able to obtain to date has allowed us to determine redshifts for around 300 ISO and radio sources. A couple of the ISO sources are at redshifts , and many sources have ultra high luminosities. From these spectra we are also able to present a very preliminary classification, Table 4. All the types of objects that we expected from studies of local IRAS samples are seen, it is too early to say whether the populations are found in the proportions expected as the selection effects in these highly incomplete spectroscopic samples need to be modeled carefully.
| Class | 21cm | ISO | ||
|---|---|---|---|---|
| 2dF | ESO | 2dF | ESO | |
| Absorption | 48 | 15 | 6 | |
| Star-burst | 9 | 3 | 22 | 52 |
| H | 5 | 2 | 26 | |
| OII | 10 | 4 | ||
| OIII | 1 | |||
| AGN/QSO | 6 | 2 | 20 | 19 |
| AGN/Sy1 | 2 | 1 | 3 | |
| AGN/Sy2 | 8 | 3 | 8 | 8 |
| AGN/BLLac | 2 | |||
| Stars | 1 | 8 | 3 | |
| Too Faint | 60 | 3 | 41 | |
7 Conclusion
The ELAIS sample is clearly going to provide a major legacy from the ISO mission. A preliminary catalogue has already been released to the community and a final analysis is in progress. Source counts show strong evolution, and with forthcoming optical spectroscopy in 2000 ELAIS will provide exceptional constraints on the cosmic star formation history.
References
- [1] Oliver S., et al. 2000 MNRAS, in press
- [2] Kessler, M. F., et al. 1996 A&A, 315, L27
- [3] Cesarsky, C.J., et al. 1996, A&A, 315, L32
- [4] Lemke, D., et al. 1996, A&A, 315, L64
- [5] Serjeant S., et al., 1997, MNRAS289, 457
- [6] Dole H. et al. 1999 In ’The Universe as seen by ISO’, eds. P. Cox and M.F. Kessler, 1999, UNESCO, Paris, ESA Special Publications series ISBN 92-9092-708-9 p. 1031
- [7] Serjeant et al. 2000, MNRAS, in press
- [8] Franceschini, A., Mazzei, P., De Zotti, G. & Danese, L. 1994, ApJ, 427, 140
- [9] Pearson, C. & Rowan-Robinson, M. 1996, MNRAS, 283, 174
- [10] Xu, C., et al., 1998, ApJ, 508, 576
- [11] Efstathiou A., et al. 2000 MNRAS, submitted
- [12] Crockett H., et al. 2000 MNRAS, in prep.
- [13] Oliver S., et al., 1997, MNRAS, 289, 471
- [14] Aussel, H., Cesarsky, C.J., Elbaz, D., Starck, J.L., 1999, A&A, 342, 313
- [15] Guiderdoni, B., Hivon, E., Bouchet, F. R. & Maffei, B. 1998, MNRAS, 295, 877