ORFEUS II echelle spectra :
H2 measurements in the Magellanic Clouds
††thanks: Data partly obtained under the
DARA guest observing program in the ORFEUS II Mission
Abstract
More than 20 years after the Copernicus satellite, ORFEUS allows the investigation of molecular hydrogen (H2) in the diffuse interstellar medium by way of FUV absorption spectroscopy once again. This time, targets in the Magellanic Clouds were also observed, allowing the first investigation of cold H2 in a metal-poor environment outside the Milky Way disk. This paper presents new H2 measurements in LMC gas along the lines of sight toward HD 269698 (Sk 67 166), HD 269546 (Sk 68 82) and HD 36402 (Sk 67 104) and summarizes the ORFEUS H2 measurements in the the Magellanic Clouds. For seven lines of sight we investigate correlations between H i, H, and compare the results with H2 observations in the Milky Way disk. We find that the abundance of H2 is low in comparison to the total gas quantity and speculate that the fraction of hydrogen in molecular form is limited by the lower dust content of the Magellanic Clouds.
Key Words.:
Space Vehicles - ISM: molecules - Galaxies: ISM - Magellanic Clouds - Ultraviolet: ISM1 Introduction
The molecular hydrogen (H2) is by far the most abundant molecule in the interstellar medium (ISM) and thus plays a key role for our understanding of the molecular gas in the ISM of the Milky Way and other galaxies. Despite its large abundance, H2 in the ISM is difficult to measure because it is not seen in radio emission, in striking contrast to the second most abundant interstellar molecule, carbon monoxide (CO). H2 emission lines are seen in the near infrared (NIR), but unfortunately they are weak (quadropole transitions) and thus can not be used to study the overall interstellar abundance of H2. Molecular hydrogen in the diffuse ISM can only be studied by way of absorption spectrosopy in the far ultraviolet (FUV) toward stars or other bright UV background sources. During the seventies, considerable effort was put into the investigation of H2 absorption lines with the Copernicus satellite. Savage et al. (1977; hereafter S77) summarized Copernicus H2 measurements of 102 lines of sight toward nearby stars in the Milky Way. One of the most striking results was the correlation between the H2 column density (H2) and colour excess , representative of the dust amount along a sight line. This relation has been interpreted in terms of the self-shielding effect of H2 (Federman et al. 1979). S77 showed that the transition from low to high molecular fractions in the local Galactic gas is found at total hydrogen column densities near cm-2.
| Object | Other | Location | Spectral Type | Ref.1 | ORFEUS exp. time | ||||
|---|---|---|---|---|---|---|---|---|---|
| Name | Names | [mag] | [mag] | [ksec] | |||||
| LH 10:3120 | … | LMC | 12.80 | O5.5 V | 277.2 | 36.1 | 1 | 6.5 | |
| HD 5980 | Sk 78 | SMC | 11.80 | OB+WN3 | 302.1 | 44.9 | 2,3 | 6.8 | |
| HD 269698 | Sk 66 166 | LMC | 12.27 | O4 If | 277.8 | 32.5 | 4,5 | 6.2 | |
| HD 269546 | Sk 68 82 | LMC | 11.30 | B3 I+WN3 | 279.3 | 32.8 | 4,6 | 6.4 | |
| HD 36402 | Sk 67 104 | LMC | 11.50 | OB+WC5 | 277.8 | 33.0 | 2,7 | 7.8 |
1 References: (1) Parker et al. (1992); (2) Sembach & Savage (1992); (3) Fitzpatrick & Savage (1983);
(4) Chu et al. (1994);
(5) Wilcots et al. (1996); (6) Vacca & Torres-Dodgen (1990); (7) de Boer & Nash (1982) and references therein
Measurements with Copernicus, however, were limited to the very local interstellar gas of the Milky Way. For more distant background sources, Copernicus was not sensitive enough. Later UV satellites, such as IUE and HST, had better sensitivity, but these instruments do not cover the wavelength range below 1150 Å where the transitions of H2 are seen. The analysis of extragalactic H2 gas is of great importance since the abundance of H2 can be studied in environments very different from those of the Milky Way. The Magellanic Clouds, the most nearby satellite galaxies of the Milky Way, are ideal hunting grounds for extragalactic H2 measurements, because they provide many bright stars suitable as UV background sources for absorption spectroscopy. Moreover, H2 has been detected from warm regions in both galaxies in the near-IR emission lines (Koornneef & Israel 1985, Israel & Koornneef 1988, 1991). It has been suggested that, due to the lower metallicity and the lower dust content, the amount of H2 in the diffuse interstellar medium of the Magellanic Clouds is significantly lower than in the Milky Way (Clayton et al. 1995).
The ORFEUS telescope, launched for its second mission in 1996, was the first instrument able to measure H2 absorption lines in the LMC (de Boer et al. 1998) and SMC (Richter et al. 1998). In addition, the spectrum of LH 10:3120 was used to detemine an upper limit for the H2/CO ratio in the LMC gas along this line of sight (Richter et al. 1999a). Together with the observations presented here, these ORFEUS spectra provide the first opportunity to investigate the relations between H i, H and in diffuse interstellar gas of the Magellanic Clouds in comparison to the Milky Way.
2 Observations
The observations have been carried out during the second mission of ORFEUS on the ASTRO-SPAS space shuttle mission in Nov./Dec. 1996. ORFEUS is equipped with two alternatively operating spectrometers, the echelle spectrometer (Krämer et al. 1990) and the Berkely spectrometer (Hurwitz & Bowyer 1996). The spectroscopic data presented here were obtained with the Heidelberg/Tübingen echelle spectrometer. This instrument has a resolution of somewhat better than (Barnstedt et al. 1999), working in the spectral range between and Å. A detailed description of the instrument is given by Barnstedt et al. (1999).
Here we study the ORFEUS spectra of 4 LMC stars and one SMC star. Basic information about the targets is given in Table 1. The primary data reduction was performed by the ORFEUS team in Tübingen (Barnstedt et al. 1999). In order to improve signal-to-noise ratios (S/N), all spectra have been filtered by a wavelet algorithm (Fligge & Solanki 1997). The resolution after filtering is km s-1. Heliocentric velocities have been transformed for each line of sight into the LSR (Local Standard of Rest) system.
3 Data analysis
The complex line-of-sight structure in direction of the Magellanic Clouds, with contributions from local Galactic gas (0 km s-1), Galactic halo gas (near and km s-1 in front of the LMC) and Magellanic Cloud gas (near km s-1 for the LMC and km s-1 for the SMC; see Savage & de Boer 1979, 1981; de Boer et al. 1980; Bomans et al. 1996) makes the thorough analysis of H2 absorption lines at LMC velocities and km s-1 resolution a difficult task. The main problem is that for the vast majority of the H2 transitions line blends from atomic or molecular species can not be excluded, even when many of these blendings might are unlikely. As a consequence, the number of unambigously identified H2 features at high radial velocities is strongly limited to only a few wavelength regions. Typical line strengths for low H2 column densities (as observed in the spectra presented in the following) have values mÅ, which is (at low S/N) comparable with the strength of noise peaks. For most of these lines, only upper limits for the equivalent widths can be obtained. For diffuse H2 clouds it is known that the process of UV pumping (Spitzer & Zweibel 1974) often leads to an excitation of the higher rotational states, particulary if the total H2 column density is below the limit for the self-shielding effect. Thus, the rotational excitation of H2 in the most diffuse medium often does not reflect the actual kinetic temperature of the gas. H2 line strengths in diffuse clouds for excited rotational states might be significantly higher than for the ground states (see the Copernicus spectrum of Pup, as published by Morton & Dinerstein 1976, where the strongest H2 lines occur for ), even if the gas is cold. In the most complex case, the equivalent widths for the ground state lines are below the detection limit, while in the same spectrum, absorption from higher rotational levels is visible.
Velocity information from metal lines as well as model spectra for the excited rotational states were used to interpret the complex H2 absorption pattern found in the ORFEUS spectra of stars in the Magellanic Clouds.
4 ORFEUS H2 measurements
For the lines of sight toward HD 269698, HD 269546 and HD 36402 the analysis of H2 line strengths is presented in the following. For 2 other lines of sight, ORFEUS H2 measurements of Magellanic-Cloud gas have recently been published by de Boer et al. (1998; LH 10:3120) and Richter et al. (1998, 1999a; HD 5980, LH 10:3120).
Wavelengths and oscillator strengths for the H2 lines have been taken from the list of Morton & Dinerstein (1976) 111We note that the Lyman P(1), 10-0 line is located at Å and not at Å, as given by Morton & Dinerstein (1976). See the wavelength list of Abgrall & Roueff (1989).. We measured equivalent widths () by using either trapezoidal or gaussian fits. For the error determination we used the algorithm of Jenkins et al. (1973), taking into account photon statistics and the number of pixels involved for each line. In order to estimate the uncertainty for the choice of the continuum, we fitted a maximum and a minimum continuum to the data in the vicinity of each line and derived a mean deviation. The error for given in Table 2 represents the total uncertainty calculated from all contributions discussed above. Column densities were derived by using a standard curve-of-growth technique.
4.1 HD 269698
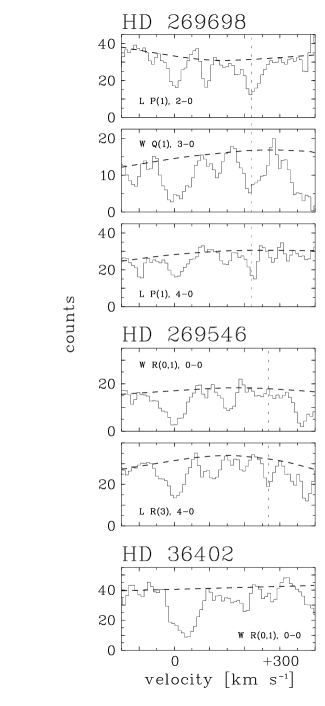
The ORFEUS spectrum of HD 269698 in the Large Magellanic Cloud shows weak H2 absoption at LMC velocities near km s-1. Six lines from the two rotational ground states () with high oscillator strengths are clearly seen in the spectrum and are not blended by other transitions. For additional five lines from higher rotational states we find upper limits for the equivalent widths of mÅ (Table 2). Fig. 1 shows three of the detected H2 absorption lines plotted on a velocity scale. The lack of absorption in higher rotational states indicates that the H2 gas is not strongly excited. Constructing curves of growth for each rotational state we obtain column densities of cm-2 for and cm-2 for the state, using a value of 8 km s-1 (best fit). The total H2 column density in the LMC gas toward HD 269698, derived by summing over and , is (H2) cm-2. The error is derived from the uncertainty for the fit to the curve of growth and includes the error for the individual equivalent widths and the uncertainty for the value. From the detection limits for the lines from we can exclude the possibilty that the higher rotational states will significantly contribute to the total H2 column density.
HD 269698 is located in the OB association N 57 at the rim of the supergiant shell LMC 4 where the H i emission (Rohlfs et al. 1984) has a minimum. The IUE spectrum of HD 269698 (Domgörgen et al. 1994) reveals three S ii components at LMC velocities in front of the star: near km s-1, near km s-1 and near km s-1. The detected H2 lines obviously belong to the first component.
4.2 HD 269546
In the ORFEUS spectrum of the LMC star HD 269546, no clear H2 absorption is visible at LMC velocities. The presence of H2 at LMC velocities (near km s-1) in ORFEUS data was indicated by Widmann et al. (1998), using a coaddition of 25 Lyman- and Werner lines. However, the Werner R(0), R(1) line-pair (in Fig. 1 plotted on a velocity scale) gives no hint for the presence of H2 absorption at LMC velocities. Marginal H2 absorption might be present in the Lyman P(1), 2-0 line ( Å) and in the Lyman R(3), 4-0 line ( Å) near km s-1 (Fig. 1), but these absorption features are not clearly distinguishable from noise peaks and no other H2 profiles from show similar features at km s-1. Metal lines in the LMC gas near km s-1 have been found in the IUE spectrum of HD 269546 (Grewing & Schultz-Luepertz 1980). Moreover, the IUE data reveal absorption over the whole velocity range between and km s-1, most likely related to Galactic halo gas and weaker LMC components. H2 absorption at km s-1 is seen in some of the stronger lines, indicating that the Galactic high-velocity gas in front of HD 269546 contains molecular gas and dust (Richter et al. 1999b). The H i emission line data from Rohlfs et al. (1984) show the LMC gas at km s-1. HD 269546 is member of the OB association LH 58 in the N 144 superbubble complex northwest of 30 Doradus. The H i gas seen in 21 cm emission at km s-1 is most likely in front of N 144.
Detection limits for eight H2 absorption lines at LMC velocities near km s-1 are used to obtain upper limits for the column densities of for by fitting the values of log () to the linear part of the curve of growth. We calculate an upper limit for the total H2 column density by modeling the population of the rotational states for T K. From that we derive (H2) cm-2 for the LMC gas toward HD 269546.
| Line | [Å] | [mÅ] | ||
| , , eV | ||||
| W | R(0,1),0-0 | present | ||
| L | R(0),2-0 | |||
| L | R(0),4-0 | |||
| , , eV | ||||
| L | P(1),2-0 | |||
| L | P(1),3-0 | |||
| L | R(1),4-0 | |||
| L | P(1),4-0 | |||
| W | Q(1),3-0 | |||
| , , eV | ||||
| L | R(2),4-0 | |||
| W | Q(2),0-0 | |||
| , , eV | ||||
| L | R(3),4-0 | |||
4.3 HD 36402
No H2 absorption is seen in the spectrum of HD 36402 at LMC velocities in the range to km s-1. In this velocity range, atomic absorption has been found by de Boer & Nash (1982). We place an upper limit on the H2 column density in the LMC gas after inspecting some of the strongest of the H2 transitions in the rotational states to . HD 36402 is located in the superbubble N 51D and shows hydrogen emission and metal absorption from LMC foreground gas near km s-1 (de Boer & Nash 1982). Therefore we expect H2 absorption from LMC gas roughly at the same velocity. Inspecting the R(0), R(1) line-pair plotted on the velocity scale (Fig. 1, lowest panel) there is very weak absorption near km s-1, but this feature has no significance with respect to the noise.
In the same way as for HD 269546, we determine upper limits for the individual column densities for from the detection limits for some of the stronger H2 transitions near km s-1. We find an upper limit for the total H2 column density in the LMC gas toward HD 36402 of (H2) cm-2. Again, this upper limit is calculated under the assumption that the excitation temperature of possibly existing H2 gas in the LMC would not exceed a value of 300 K.
5 H i measurements
For two of our sight lines (HD 269698 and HD 269546) we present the determination of H i column densities from the analysis of the Ly absorption near 1215 Å. The values for the H i column densities along the other three lines of sight have been adopted from the literature. All H i column densities are summarized in Table 3. For HD 5980 and HD 36402, the column density of H i has been determined by Fitzpatrick & Savage (1983) and de Boer & Nash (1982), respectively, using H i emission line data in combination with the Ly absorption near 1215 Å. They derive H i column densities of (H i cm-2 for the SMC gas toward HD 5980 and cm-2 for the LMC gas toward HD 36402. For LH 10:3120, the LMC H i column density is cm-2, obtained by a multi-component fit of the Ly profile (Richter et al. 1999a).
We use a similar technique for the determination of H i column densities in the LMC gas toward HD 269698 and HD 269546. For HD 269546, we fix the LMC component at a velocity of km s-1, similar to the velocity for which we had determined the upper limit for the H2 column density in Sect. 4.2 . The velocity structure seen in metal lines (Grewing & Schulz-Luepertz 1980), however, indicates that there are definitely additional (weaker) absorption components in front of HD 269546. We thus might slightly overestimate the H i column density in the LMC gas at km s-1 by fitting one single LMC component to the Ly absorption structure. The situation is even more difficult for the Ly profile in the spectrum of HD 269698. IUE data of HD 269698 show the presence of three velocity components in this sight line (Domgörgen et al. 1994), near and km s-1. The H i emission (Rohlfs et al. 1984) shows a weak component near km s-1 which could be associated with the absorption component near km s-1 (see Domgörgen et al. 1994). The S ii abundances found by Domgörgen et al. indicate similar total gas quantities for the two main components at km s-1 and at km s-1. The H2 absorption was found in the latter component (see Sect. 4.1). For the Ly fit, we fix the two LMC components at (cloud I) and (cloud II) km s-1, assuming equal H i column densities. For the fitting procedure we use a multi-component Voigt profile. Galactic foreground absorption by H i is taken into account by a fit component at km s-1. The multiple velocity components are not resolved in the Ly profile and we do not take into account additional absorption from Galactic intermediate and high-velocity gas. Thus, it is clear that our results derived by this method represent only rough estimates for the distribution of the H i gas in front of the stars. However, for the comparison between H i, H and , as presented in Sect. 7, the determined H i column densities are sufficiently accurate.
| Object | Location | log (H2) | log (H i) | (H i + H2)/ | log | Ref.2 | |
|---|---|---|---|---|---|---|---|
| [mag] | [cm-2] | ||||||
| LH 10:3120 | LMC | 1,2 | |||||
| HD 5980 | SMC | 3,4 | |||||
| HD 269698 | LMC | 5 | |||||
| HD 269546 | LMC | 5 | |||||
| HD 36402 | LMC | 5,6 | |||||
| Sk 66 19 | LMC | 7,8 | |||||
| Sk 69 270 | LMC | 7,8 |
1 Errors include uncertainty for the choice of the doppler parameter
2 References: (1) de Boer et al. (1998); (2) Richter et al. (1999a);
(3) Richter et al. (1998); (4) Fitzpatrick & Savage (1983);
(5) this paper; (6) de Boer & Nash (1982); (7) Gunderson et al. (1998); (8) Fitzpatrick (1985)
3 From intermediate resolution spectra with HUT
The Ly fit for HD 269546 provides the best agreement with the data with a Galactic foreground absorption of H i cm-2 and an additional LMC component at km s-1 of H i cm-2. For HD 269698, the best fit is found for H i cm-2 and H iH i cm-2 for the two LMC clouds at and km s-1. The H i column densities in the LMC gas in these two lines of sight are significantly lower than found for HD 5980 and LH 10:3120, but comparable with the H i column density found in the LMC gas toward HD 36402.
6 Colour excess
The colour excess for each line of sight, adopted from different publications, is given in Table 1. All lines of sight show total values of lower than 0.20 mag. The main problem is to separate the contributions of the Galactic foreground from the colour excess within the Magellanic Clouds. For LH 10:3120 (LMC) and HD 5980 (SMC), we adopt values for from previous publications (de Boer et al. 1998; Richter et al. 1998). For HD 269698 and HD 269546, we have calculated the foreground extinction from the H i column densities of the Galactic foreground gas by using the mean gas-to-colour excess relation, as given by Bohlin et al. (1978). The values for are presented in Table 3. Their errors are based on the uncertainty for (as cited in the literature; see Table 1) in addition to the uncertainty for the Galactic foreground reddening, which shows variations in the range of mag in direction of the LMC and mag toward the SMC (Bessel 1991).
7 Discussion
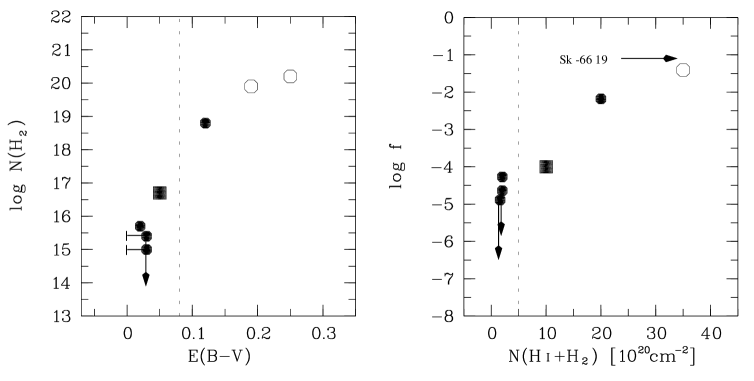
Values of H i, H and for all five lines of sight measured with ORFEUS (summarized in Table 3) are used to investigate the diffuse molecular ISM of the Magellanic Clouds. In order to extend our data, we include recent results from Gunderson et al. (1998) for two lines of sight toward Sk 66 19 and Sk 69 270 in the LMC. They estimate, on the basis of low dispersion spectra with the Hopkins Ultraviolet Telescope (HUT), column densities of molecular hydrogen in the LMC gas by fitting H2 line profiles (see Table 3).
Fig. 2 presents correlations between H, , H2H i)H, and H iHH iH. The left panel shows log H plotted versus . In principle, we find the typical relation known from the Copernicus H2 survey from S77 for Galactic gas. In both Milky Way and the Magellanic Clouds the logarithmic H2 column density (log H) undergoes a transition from low to to high values at (dashed line) due to the self-shielding effect of H2 (Federman et al. 1979).
It is known that the Magellanic Clouds have a significantly lower dust content than the Milky Way. Typical gas-to-dust ratios H iH/ in the Magellanic Clouds are 4 times (LMC) and 8 times (SMC) higher than in Milky Way gas (Koornneef 1982; Bouchet et al. 1985, respectively). In our sample, we find gas-to-dust ratios as high as cm-2 for the gas in the LMC and SMC (see Table 3), consistent with these results. For HD 36402, HD 269698 and HD 269546, the ratios are significantly lower, but note that these values most likely represent lower limits due to the large uncertainty for the gas-to-dust ratio near the zero point of the scale. With respect to the generally lower dust content and the relation between H2 column density and (Fig. 2, left panel) one should expect that the fraction of gas in molecular form is significantly lower in the Magellanic Cloud than in the Milky Way. From more theoretical considerations, Elmegreen (1989) concluded that interstellar clouds in Magellanic type irregular galaxies should be mostly atomic, since their lower metallicity directly influences the shielding function for the cloud layers. This author also showed that the H to H2 conversion also depends sensitively on the pressure and radiation field in the ISM (Elmegreen 1993). Accordingly, typical sight lines through the Magellanic Clouds might not contain any measureable column density of H2, except for those, whose column density in H i is high enough to allow a significant fraction of the gas to convert into molecular form.
As the right panel of Fig. 2 shows, the discussed effects are slightly visible in the FUV absorption line data. The figure shows the molecular fraction plotted against the total hydrogen column density H iH. The Copernicus sample (S77) shows that the transition from low () to high () molecular fractions in the local Galactic gas is found at a total hydrogen column density (‘transition column density’ (H i)) near cm-2 (right panel, dashed line). We find high total hydrogen column densities ( cm-2) but low molecular hydrogen fractions () for the Magellanic Clouds gas along two of seven lines of sight. The data points of these two lines of sight toward LH 10:3120 and HD 5980 indicate that the transition column density from low to high molecular fractions could be indeed higher in the Magellanic Clouds than in the Milky Way. Only for sight lines with a very high total hydrogen column density (Sk and Sk ), the molecular fractions exceeds values above 1 percent. For sight lines with H cm-2 the molecular fractions in the Magellanic Cloud gas seem to be negligible.
Additional sight line measurements toward the Magellanic Clouds, however, are required to investigate these relations on a statistically more significant level. With a larger data set it might be possible to determine the transition column density from low to high molecular fractions as a function of the overall metallicity. Since it is known that the SMC is even more metal-poor than the LMC, it is of special interest to also investigate differences in the molecular gas fractions between LMC and SMC. For that, the FUSE satellite, launched in June 1999, holds the prospect for fresh H2 absorption line data in the near future.
Acknowledgements.
I thank K.S. de Boer and the Heidelberg-Tübingen team for permission to use the G.O. and P.I. data on Magellanic Cloud star spectra for this study and for their great support. I thank K.S. de Boer for helpful comments on this work. When this paper was prepared, PR was supported by a grant from the DARA (now DLR) under code 50 QV 9701 3.References
- (1) Abgrall H., Roueff E., 1989, A&AS 79, 313
-
(2)
Barnstedt J., Kappelmann N., Appenzeller I., et al., 1999,
A&AS 134, 561 - (3) Bessel M.S., 1991, A&A 242, L17
- (4) Bohlin R.C., Savage B.D., Drake J.F., 1978, ApJ 224, 132
-
(5)
Bomans D.J., de Boer K.S., Koornneef J., Grebel E.K., 1996,
A&A 313, 101 - (6) Bouchet P., Lequeux J., Maurice E., Prevot L., Prévot-Burnichon M.L., 1985, A&A 149, 330
- (7) Chu Y., Wakker B., Mac Low M., et al., 1994, AJ 108, 169
- (8) Clayton G.C., Green J., Wolff M.J., et al., 1995, ApJ 460, 313
- (9) de Boer K.S., Koornneef J., Savage B.D., 1980, ApJ 236, 769
- (10) de Boer K.S., Nash A.G., 1982, ApJ 255, 447
- (11) de Boer K.S., Richter P., Bomans D.J., Heithausen A., Koornneef J., 1998, A&A 338, L5
- (12) Domgörgen H., Bomans D.J., de Boer K.S., 1994, A&A 296, 523
- (13) Elmegreen B.G., 1989, ApJ 338, 178
- (14) Elmegreen B.G., 1993, ApJ 411, 170
- (15) Federman S.R., Glassgold A.E., Kwan J., 1979, ApJ 227, 466
- (16) Fitzpatrick E.L., 1985, ApJ 299, 219
- (17) Fitzpatrick E.L., Savage B.D., 1983, ApJ 267, 93
- (18) Fligge M., Solanki S.K., 1997, A&AS 124, 579
- (19) Grewing M., Schulz-Luepertz E., 1980, in: ‘Proc. of the second IUE conference’, ESA SP-157, 357
- (20) Gunderson K.S., Clayton G.C., Green J.C., 1998, PASP 110, 60
- (21) Hurwitz M., Bowyer S., 1996, in: ‘Astrophysics in the extreme ultraviolet’, eds. S. Bowyer & R.F. Malina, Kluwer; p. 601
- (22) Israel F.P. Koornneef J., 1988, A&A 190, 21
- (23) Israel F.P. Koornneef J., 1991, A&A 248, 404
- (24) Jenkins E.B., Drake J.F., Morton D.C., et al., 1973, ApJ 181, L122
- (25) Koornneef J., 1982, A&A 107, 247
- (26) Koornneef J., Israel F.P., 1985, ApJ 291, 156
- (27) Krämer G., Barnstedt J., Eberhard N., et al., 1990, ‘Observatories in Earth Orbit and Beyond’, eds. Y. Kondo, Kluwer, Ap.Sp.Sci.Lib., Vol. 166, 177
- (28) Morton D.C., Dinerstein H.L., 1976, ApJ 204, 1
-
(29)
Parker J.W., Garmany C.D., Massey P., Walborn N.R., 1992,
AJ 103, 1205 - (30) Richter P., Widmann H., de Boer K.S., et al., 1998, A&A 338, L9
- (31) Richter P., de Boer K.S., Bomans D.J., et al. 1999a, A&A 351, 323
- (32) Richter P., de Boer K.S., Widmann H., 1999b, Nat 402, 386
- (33) Rohlfs K., Kreitschmann J., Siegman B.C., Feitzinger J.V., 1984, A&A 137, 343
- (34) Savage B.D., de Boer K.S., 1979, ApJ 230, L77
- (35) Savage B.D., de Boer K.S., 1981, ApJ 243, 460
-
(36)
Savage B.D., Bohlin R.C., Drake J.F., Budich W., 1977,
ApJ 216, 291 (S77) - (37) Sembach K.R., Savage B.D., 1992, ApJS 83, 147
- (38) Spitzer L., Zweibel E.G., 1974, ApJ 191, L127
- (39) Vacca W.D., Torres-Dodgen A.V., 1990, ApJS 1990, 658
- (40) Widmann H., Krämer G., Appenzeller I., et al., 1998, in: IAU Coll. 166, ‘The local bubble and beyond’, eds. D. Breitschwerdt, M. J. Freyberg, J. Truemper; Springer, p. 517
- (41) Wilcots E.M., Hodge P.W., King N., 1996, ApJ 458, 580