Chandra Discovery of a 100 kpc X-ray Jet in PKS 0637–752
Abstract
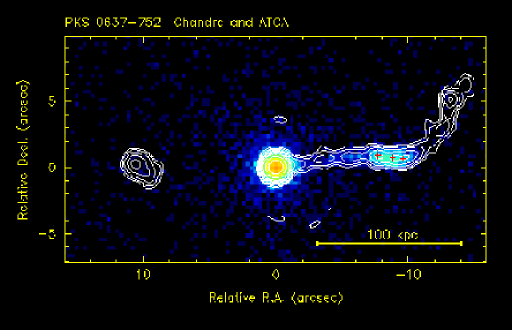
The quasar PKS 0637–752, the first celestial X-ray target of the Chandra X-ray Observatory, has revealed asymmetric X-ray structure extending from 3 to 12 arcsec west of the quasar, coincident with the inner portion of the jet previously detected in a 4.8 GHz radio image (Tingay et al., 1998). At a redshift of , the jet is the largest ( kpc) and most luminous ( ergs s-1) of the few so far detected in X-rays. This letter presents a high resolution X-ray image of the jet, from 42 ks of data when PKS 0637–752 was on-axis and ACIS-S was near the optimum focus. For the inner portion of the radio jet, the X-ray morphology closely matches that of new ATCA radio images at 4.8 and 8.6 GHz. Observations of the parsec scale core using the VSOP space VLBI mission show structure aligned with the X-ray jet, placing important constraints on the X-ray source models. HST images show that there are three small knots coincident with the peak radio and X-ray emission. Two of these are resolved, which we use to estimate the sizes of the X-ray and radio knots. The outer portion of the radio jet, and a radio component to the east, show no X-ray emission to a limit of about 100 times lower flux.
The X-ray emission is difficult to explain with models that successfully account for extra-nuclear X-ray/radio structures in other active galaxies. We think the most plausible is a synchrotron self-Compton (SSC) model, but this would imply extreme departures from the conventional minimum-energy and/or homogeneity assumptions. We also rule out synchrotron or thermal bremsstrahlung models for the jet X-rays, unless multicomponent or ad hoc geometries are invoked.
1 Introduction
PKS 0637–752 was the first celestial X-ray target of the Chandra X-ray Observatory (Weisskopf et al., 2000). As a moderate strength point source it was used to locate the optical axis and focus of the X-ray mirror assembly. Surprisingly, even the first short, out-of-focus image clearly revealed an X-ray jet, coincident with the radio jet reported by Tingay et al. (1998). This letter addresses the X-ray jet, which appears as a extension from 3 to west of the quasar, with brighter condensations from to . This corresponds111We use and throughout to an extension in the plane of the sky from to kpc from the nucleus, with an X-ray luminosity of erg s-1: the largest and most luminous X-ray jet discovered to date. In a companion paper (Chartas et al., 2000) we examine the X-ray spectra of the core and jet in more detail by adding substantial additional data where the detector was slightly out of focus.
PKS 0637–752 was identified with the stellar object by Hunstead (1971), based on an accurate radio position, and a redshift of z = 0.651 was measured by Savage, Browne, and Bolton (1976). The HEAO-1 all sky survey suggested it as a keV X-ray source (Wood et al., 1984). Definitive X-ray identification was made in the keV band with the Einstein observatory (Elvis and Fabbiano, 1984), and numerous X-ray observations have since been made (cf. Yaqoob et al. (1998), and references therein), however none approached the sub-arcsecond image quality of Chandra (Jerius et al., 2000) and so could not resolve the jet. The source is gamma-ray quiet (Fichtel et al., 1994), with a 2 upper limit of for gamma-rays above 100 MeV.
VLBI space observatory program (VSOP) observations were rescheduled to overlap the Chandra observations to investigate links between the known pc-scale jet (Tingay et al., 1998) and the X-ray emission from the quasar core. During the VSOP observations we also obtained Australian Telescope Compact Array (ATCA) radio images with comparable resolution to the Chandra images. We discuss the radio data in section 2.2.
HST WFPC-2 images were obtained fortuitously on 30 May 1999, and are discussed in section 2.3.
2 OBSERVATIONS
2.1 X-ray
Six Chandra observations, totaling 42 ks when the target was on axis and the detector was within 0.25 mm of focus, were used to create an X-ray image. We use the full energy band of the back side illuminated S3 CCD chip, keV.
The PSF of the resultant core image has a half-power radius of and a encircled energy radius of . The image quality of the quasar core is broadened slightly by event pile-up, indicated by over-representation of the high grades, as well as the high counting rates of 0.4 s-1. In the direction perpendicular to the jet, the core fits a Gaussian profile with an rms of 037. The jet is faint enough that pile-up is not significant at any point.
The X-ray and radio images are shown in Figure 1. The X-ray jet, which corresponds to the inner portion of the western radio jet before the bend to the northwest, separates into two regions: within 7″ of the core the X-ray flux is somewhat faint and maintains a position angle (PA) of -82°; at about 7″ from the core the jet bends distinctly to the south, and the flux is about three times greater. The increased brightening may be dominated by three point-like knots, as detected with HST, and shown as the plus signs. In the brighter parts of the jet, a fit to the cross-jet profile is consistent with the core PSF, thus the jet is unresolved in this direction, with an intrinsic width less than 03 FWHM.
We detect a net 1205 X-ray counts from the entire inner, western jet, defined as a rectangle from 3″ to 115 west and from 05 south to 2″ north of the quasar. For the power law energy index222We use of (Chartas et al., 2000), this corresponds to a measured keV flux of erg cm-2 s-1, or a spectral normalization at 1 keV of erg cm-2 s-1 keV-1. That is, the flux density is 25 nJy at Hz. We fixed the galactic absorption at .
Figure 2 plots the X-ray and radio surface brightness as a function of the distance West of the quasar core, integrated 1″ pperpendicular to the jet. There are three distinct, partially resolved radio peaks or knots in the brighter part of the inner western jet, which we designate by their direction and distance from the core using the notation: WK7.8, WK8.9, and WK9.7. The enhanced X-ray emission is closely associated with those knots, but not in exact detail. In particular, the X-ray flux falls off more steeply past 95. The ratio of the flux densities at 1 keV to 8.6 GHz varies by no more than a factor of 2 from the value , in the region to arcsec west of the quasar core.
2.2 Radio
PKS 0637–752 is the subject of ongoing VSOP (Hirabayashi et al., 1998) observations to monitor its pc-scale evolution (Tingay et al., 2000), with one of the VSOP observations being rescheduled to overlap the first Chandra observation. ATCA observations were scheduled in parallel with the VSOP observations to provide 1″ and 2″ rresolution radio images at 8.6 and 4.8 GHz, respectively, to complement the Chandra images.
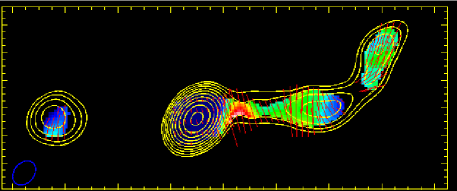
These ATCA images confirmed the remarkable coincidence of the radio and X-ray jets. Subsequent observations were made to improve image sensitivity and to determine the jet polarization. The inner west radio jet is optically thin with a spectral index of 0.81, and the polarization is 10–20%. The E-vectors are perpendicular to the jet where X-rays are detected, but, as the X-ray flux decreases near the bend in the radio jet, the polarization position angle begins to change so that the E-vectors become parallel to the jet’s centerline for the remainder of the radio jet.
We have reanalyzed our VLBI observations (Lovell et al., 2000; Chartas et al., 2000) to search for the presence of more compact components within the radio knots. We find that the knots are indeed resolved at 0.05 arcsecond resolution with no more than 5 mJy remaining at this resolution. This suggests that the radio knots are most likely low surface brightness ”hot spots.”
A rotation-measure image was constructed from the polarization data at the two frequencies. Faraday rotation was detected in the quasar core (RM=80 rad m-2) but not in the jet, with an upper limit of 30 rad m-2. The absence of significant Faraday rotation implies that the intrinsic magnetic field in the jet is perpendicular to the observed E vectors in Figure 2. That is, the magnetic field is longitudinal where the X-ray emission is strong, and perpendicular to the jet where we do not detect X-ray emission.
The VSOP observations show that PKS 0637–752 displays apparent superluminal motion in its parsec-scale jet, coaligned with the inner portion of the arcsec-scale radio jet (Lovell et al., 2000). Six datasets covering 1995–1999 (four from the U.S. Naval Observatory’s geodetic VLBI database (Piner and Kingham, 1998), two from VSOP) allow the motion of three parsec-scale features to be measured. Linear least-squares fits to the separation of these features from the VLBI core vs. time yield proper motions of 0.410.03, 0.290.05, and 0.360.09 milliarcseconds per year from the outermost component inward (Lovell et al., 2000). These proper motions and associated errors are just consistent with all three components moving at the weighted average proper motion of 0.360.02 mas yr-1, which corresponds to an apparent speed of (17.8)(1.0) c. Since the apparent transverse speed is given by ,(Rees, 1966), this apparent speed places limits on the bulk Lorentz factor in the VLBI jet and the angle of the VLBI jet to the line-of-sight of 17.8 and 64, respectively. Since the parsec-scale and arcsec-scale radio jets are very well aligned, unless the jet goes through a large bend in a plane perpendicular to the plane of sky, the actual length of the X-ray jet would be at least 940 kpc.
2.3 Optical
An optical image of PKS 0637–752 was obtained with the Hubble Space Telescope WFPC2 using the F702W filter. Three observations were combined in order to eliminate cosmic rays, giving a total exposure time of 2100 s. Three distinct knots are detected within the radio image contours, 77, 88, and 96 west of the core (Fig. 1). These have fluxes 0.2, 0.28, and 0.094 , respectively, at an effective frequency Hz (6969 Å). We have assumed an energy spectrum to deduce the flux densities and effective frequency. The knot at 77 is not resolved, while the other two are about 03 in diameter.
The quasar image is saturated, so it is difficult to detect sources within about 2″ of the quasar core. We estimate that the knots can be located relative to the quasar to an accuracy of about 007. The HST image also shows the presence of a group of faint galaxies, 100 kpc in radius, surrounding the quasar.
3 DISCUSSION
The strong polarization shows that the radio emission arises from synchrotron radiation. Standard models assume a power law population of relativistic electrons with a density where is the Lorentz factor. The radio spectral index is observed to be 0.81, so that m=2.62. A natural hypothesis is that the X-rays are also synchrotron radiation from the same population of electrons. However, the optical flux falls a factor of 10 below such a continuous spectrum, and therefore rules out such a simple model. The absence of optical emission at the level of which would be required, implies that the high energy cutoff to the electron spectrum be such as to cause the radio spectrum to steepen at Hz. For the X-rays to result from synchrotron emission there would have to be an independent population of electrons with a similar index m=2.7 in the energy region emitting the X-rays, but which flattened at lower to avoid over-producing the optical. There then would be no apparent reason for the existing spatial correlation of the radio and X-ray emission.
Although the data allow a fit to a thermal spectrum with kT at least 4 keV (Chartas et al., 2000), thermal bremsstrahlung is not a viable origin for the X-ray emission unless a contrived geometry is invoked. Taking an upper limit size of 04 for the diameter of a cylindrical jet, it would require an electron density of to produce the measured luminosity. But the upper limit to the rotation measure places a limit . Even if the magnetic field were as low as 1 Gauss, a path-length of only pc through such a thermal plasma would exceed the rotation measure limit.
The obvious remaining mechanism is inverse-Compton. Because we have measured the X-ray spectral index to be nearly the same as the 4.8 to 8.6 GHz radio index, it is natural to assume both arise from the same population of relativistic electrons. In inverse Compton scattering scenarios the synchrotron radio emission is typically produced by the higher energy electrons while the X-rays are produced by lower energy electrons. It is then natural to have high energy and low energy cutoffs such that the optical emission is no larger than observed. In particular, we expect electrons of to scatter radio seed photons at 10 GHz up to the Chandra X-ray energy range. The second order scattering would already be limited by the Klein-Nishina cross section, and we would have no “Compton Catastrophe.”
To estimate the expected X-ray flux, we first apply standard synchrotron theory, e.g. Miley (1980), to estimate the magnetic field H and particle density giving a minimum total energy. For example, if WK7.8 is a sphere of 0.3 arcsec diameter, uniformly filled with magnetic field and electrons, and with no proton component, then H 320 Gauss, and the total minimum energy in that sphere is ergs. We have assumed the radio spectrum extends from 10 MHz up to 500 GHz. In this situation, the predicted X-ray flux is times less than observed. Such a model would satisfactorily explain the lack of X-ray emission beyond the point where the radio jet bends toward the northwest.
The radio synchrotron photons would have an energy density ergs cm-3 in the knot, if we assume the radio spectrum extends up to 500 GHz. By comparison, the minimum energy magnetic field calculated above would have an energy density ergs cm-3. In order that there be 300 times more relativistic electrons, and predict the same GHz radio flux, we must assume the magnetic field is Gauss. To balance the radio to X-ray flux ratios from the entire inner Western jet to within a factor of 2 as is observed then requires the apparently smooth jet to be composed primarily of many radio knots, with the particle and field densities delicately balanced to produce the X-rays. Such a gross departure from equipartition, increasing the total energy by a factor of 1000, would pose significant problems for models of the particle acceleration and the jet confinement.
We can make any inverse-Compton scenario more realistic by assuming that the magnetic field strength need not be constant throughout the volume. The exact distribution of field strength with volume would be non-unique. We must assume that the relativistic particles throughout the entire volume produce the X-rays, while a small fraction of the jet containing high magnetic fields provides essentially all of the radio emission.
Alternate inverse Compton models could use some source of unseen photons. The equivalent luminosity of these photons in WK7.8 would have to be ergs s-1. If the core is the source of this luminosity, it must radiate at an unreasonable value of ergs s-1, considering that the knot subtends a solid angle of only sr. We cannot rule out that a Doppler-boosted beam is shining on the knots, but out of our direct line of sight (Perez-Fournon, 1985). This beam would presumably be optical/IR emission. However, if this could happen then when we did fall in such a beam we would infer optical luminosities of ergs s-1 for such a source. Such objects are not observed.
We might invoke relativistic beaming of the jet and knots to reconcile the observed X-ray flux with the apparent equipartition magnetic field. The conventional formula (Jones, O’Dell, and Stein, 1972) for the ratio of SSC X-ray to radio flux is multiplied by a factor where is the beaming factor of matter moving with bulk Lorentz factor at an angle to the line of sight (cf. Madejski and Schwartz (1983)). We can explain the absence of X-rays from a putative eastern jet by Doppler suppression if , and then a value would reconcile a minimum energy radio source with the observed X-rays being produced by SSC. This would require a bend of the VLBI jet, which must be at an angle less than about 6 degrees, to an angle of order 53 degrees to the line of sight. The bend must be about an axis which is very nearly in the plane of the sky, an unlikely coincidence. Even with such a coincidence, we note that the apparent radio luminosity of erg s-1 would actually be a factor higher in the rest frame, and for similar sources beamed toward us we would infer a radio luminosity of erg s-1. This exceeds observed blazar radio luminosities.
4 CONCLUSIONS
Discovery of the largest and most luminous X-ray jet in the very first celestial X-ray target of Chandra has dramatically proven the power of this observatory. It immediately shows the value of the two dimensional angular resolution improvement of a factor of 100 over the best previous missions. It is likely that many further X-ray jets will be detected in extra-galactic radio sources. The X-rays place difficult constraints on the physical conditions, eliminating standard scenarios, and will surely have important astrophysical consequences, e.g., in terms of understanding regions of particle acceleration, inhomogeneities of magnetic field structures, and/or extreme departures from equipartition conditions. While it seems that inverse-Compton emission from the same electrons producing the synchrotron radio emission is the most likely source of the X-ray emission, we have noted difficulties with the specific scenarios we have considered.

References
- Chartas et al. (2000) Chartas, G. et al. 2000, ApJ, in press.
- Elvis and Fabbiano (1984) Elvis, M., and Fabbiano, G. 1984, ApJ, 280, 91
- Fichtel et al. (1994) Fichtel, C. E. et al. 1994, ApJS, 94, 551
- Hirabayashi et al. (1998) Hirabayashi et al. 1998, Science, 281, 1825
- Hunstead (1971) Hunstead, R.W. 1971, MNRAS, 152, 277
- Jerius et al. (2000) Jerius, D., Edgar, R. J., Gaetz, T. J., McNamara, B. R., Schwartz, D. A., VanSpeybroeck, L. P., and Zhao, P. 2000, Proc. SPIE, 4012, in press.
- Jones, O’Dell, and Stein (1972) Jones, T. W., O’Dell, S. L., and Stein, W. A. 1974, ApJ, 188, 353
- Lovell et al. (2000) Lovell, J. E. J. 2000, in Astrophysical Phenomena Revealed by Space VLBI, eds. H. Hirabayashi, P. G. Edwards, and D. W. Murphy (Sagamihara:ISAS), 215
- Madejski and Schwartz (1983) Madejski, G. M., and Schwartz, D. A. 1984, ApJ, 275, 467
- Miley (1980) Miley, G 1980, ARA&A, 18, 165
- Perez-Fournon (1985) Perez-Fournon, I. 1985, in Active Galactic Nuclei, ed. J.E. Dyson (Manchester: Manchester University Press), 300
- Piner and Kingham (1998) Piner, B. G., and Kingham, K. A. 1998, ApJ, 507, 706
- Rees (1966) Rees, M. J. 1966, Nature, 211, 468
- Savage, Browne, and Bolton (1976) Savage, A., Browne, I.W.A., and Bolton, J. G. 1976, MNRAS, 177, 77P
- Tingay et al. (1998) Tingay, S. J. et al. 1998, ApJ, 497,594
- Tingay et al. (2000) Tingay, S. J. et al. 2000, Adv. Sp. Res., in press
- Weisskopf et al. (2000) Weisskopf, M. C., Tananbaum, H. D., VanSpeybroeck, L. P., and O’Dell, S. L. 2000, Proc. SPIE, 4012, in press.
- Yaqoob et al. (1998) Yaqoob, T., George, I. M., Turner, T. J., Nandra, K., Ptak, A., and Serlemitsos, P. J. 1998, ApJ, 505, L87
- Wood et al. (1984) Wood, K. S., Meekins, J. F., Yentis, D. J., Smathers, H. W., McNutt, D. P., Bleach, R. D., Friedman, H., Byram, E. T., Chubb, T. A., Meidav, M. 1984, ApJS, 56, 507