Gravitational Lensing by Nearby Clusters of Galaxies
Abstract
We present an estimation of the expected number of arcs and arclets in a sample of nearby () clusters of galaxies, that takes into account the magnitude limit of the objects as well as seeing effects. We show that strong lensing effects are not common, but also they are not as rare as usually stated. Indeed, for a given cluster, they present a strong dependence with the magnitude limit adopted in the analysis and the seeing of the observations. We also describe the procedures and results of a search for lensing effects in a sample of 33 clusters spanning the redshift range of 0.014 to 0.076, representative of the local cluster distribution. This search produced two arc candidates. The first one is in A3408 () , the same arc previously discovered by Campusano & Hardy (1996), with 0.073 and associated to the brightest cluster galaxy. The second candidate is in the cluster A3266 () and is near a bright elliptical outside the cluster center, requiring the presence of a very massive sub-structure around this galaxy to be produced by gravitational lensing.
1 Introduction
Gravitational lensing is a powerful technique to probe distant galaxies as well as for studying the matter distribution in galaxy clusters. Indeed, the analysis of bright arcs and arclets or other distortions (weak lensing), induced by the gravitational lensing of background sources by a galaxy cluster, has allowed the determination of the mass distribution in these structures, independently of other more common techniques, like the application of the virial theorem or the analysis of the X-ray emission.
Most studies of gravitational lensing by clusters have been focused in distant objects, resulting in the discovery of rather high arcs and arclets. Galaxy lensing by clusters, assuming a non-evolving mass profile and a reasonable redshift distribution for the faint galaxy population, has its maximum around (e.g. Natarajan & Kneib, 1997). However, this does not imply that the lensing efficiency of nearby clusters is totally negligible and, in fact, several groups have recently found evidence of strong lensing effects in low-redshift clusters. For instance, Allen, Fabian & Kneib (1996) discovered a arc in the cluster PKS0745-191 (at ), that has been successfully modeled as a gravitational lens image. Shaya, Baumn & Hammergren (1996) found an arc-like structure, still without redshift information, near NGC4881 in the Coma cluster (). Campusano & Hardy (1996) found an arc-like object at in A3408, a cluster at . Lens models of this structure are discussed by Campusano, Kneib & Hardy (1998). Blakeslee & Metzger (1999) discovered an arc-like object in A2124 (0.066) that is probably the lensed image of a galaxy at =0.573. Campusano, Kneib & Hardy (1998) predicted the detection of weak-shear in low () clusters, which has been recently confirmed by Joffre et al. (1999) and Kneib et al. (2000, in preparation).
It is worth to point out that the study of gravitational lensing by low redshift clusters presents, in principle, an important advantage when compared with those of more distant clusters: due to the large angular diameter that nearby clusters have, gravitational lensing may allow examining in great spatial detail the mass distribution of their central regions. Although the lensing efficiency of a cluster depends strongly on its central mass distribution, the latter is usually not well known. Observations of lensing effects allow probing low redshift clusters with high spatial resolution and, consequently, they can help to add new constraints on the mass distribution in the centers of these structures. For the weak lensing regime (see Mellier, 1999, for a review), the magnitude of the effects in high redshift clusters depends strongly on the imprecisely known redshift distribution of the faint background galaxies, while in low- clusters the weak lensing effects are almost independent of it.
In this paper we present a simple estimation of the expected number of arcs and arclets in low redshift clusters, as well as the results of an analysis of a sample of nearby clusters (), where we have looked for arc-like structures that may be produced by gravitational lensing, either by the central cluster potential as a whole or by substructures in the mass distribution related to a galaxy not located at the fiducial center of the cluster. Following Hattori, Kneib & Makino (1999) we call an arc a structure distorted by gravitational lensing with axial ratio (length-to-width) larger than 10, and arclet a structure with axial ratio smaller than 10.
The layout of the paper is as follows. The sample of galaxy clusters analyzed here is discussed in Section 2. The estimation of the number of luminous arcs and arclets expected in a sample of clusters is presented in Section 3 (and Appendix A). In Section 4 we describe the search for arcs and arclets in the sample. The two arclet-like structures found in our search are presented and discussed in Section 5. Follow up observations of these arclets are also presented in this section. Finally, we summarize our conclusions in Section 6. When necessary, we adopt h km s-1 Mpc-1 and, unless where explicitly stated, = 1 and = 0.
2 The sample of nearby galaxy clusters
The images analyzed in this project were originally obtained as part of the PhD thesis of Daniel A. Dale on peculiar motions of clusters with (Dale et al., 1997, 1998, 1999a, 1999b, 1999c). The sample of galaxy clusters with some relevant properties is presented in Table 1.
| Name | z | R | LX | Num | N | |||
|---|---|---|---|---|---|---|---|---|
| (km s-1) | (1044 erg s-1) | () | ||||||
| (1) | (2) | (3) | (4) | (5) | (6) | (7) | 8 | (9) |
| A85 | 0h 41m 37s | -9∘ 20′.6 | 0.0559 aaWu, Fand & Xu (1998) | 969 ddFadda et al. (1996) | 1 | 8.38 | 1 | 22.7 |
| A114 | 0h 53m 39s | -21∘ 40′.7 | 0.0572 bbDale et al. (1999c) | 904 bbDale et al. (1999c) | 0 | 0.7 | 19 | 16.9 |
| A119 | 0h 56m 21s | -1∘ 15′.8 | 0.0438 bbDale et al. (1999c) | 721 bbDale et al. (1999c) | 1 | 3.23 | 1 | 8.2 |
| A194 | 1h 25m 33s | -1∘ 30′.4 | 0.0168 bbDale et al. (1999c) | 409 bbDale et al. (1999c) | 0 | 0.14 | 1 | 1.3 |
| A295 | 2h 2m 27s | -1∘ 4′.6 | 0.0424 aaWu, Fand & Xu (1998) | 359 ddFadda et al. (1996) | 1 | 0.4 | 2 | 0.5 |
| A496 | 4h 33m 37s | -13∘ 14′.8 | 0.0327 bbDale et al. (1999c) | 715 bbDale et al. (1999c) | 1 | 3.54 | 18 | 9.4 |
| A548 | 5h 47m 4s | -25∘ 37′.6 | 0.0415 aaWu, Fand & Xu (1998) | 576 ddFadda et al. (1996) | 2 | 0.30 | 9 | 3.5 |
| A1736 | 13h 26m 46s | -27∘ 6′.6 | 0.0357 bbDale et al. (1999c) | 390 bbDale et al. (1999c) | 0 | 2.37 | 10 | 0.8 |
| A2670 | 23h 54m 10s | -10∘ 24′.3 | 0.0759 aaWu, Fand & Xu (1998) | 852 ddFadda et al. (1996) | 3 | 2.55 | 2 | 10.4 |
| A2806 | 0h 40m 10s | -56∘ 9′.5 | 0.0262 ccAbell, Corwin & Olowin (1989) | 390 bbDale et al. (1999c) | 0 | 0.2 | 16 | 1.1 |
| A2870 | 1h 7m 43s | -46∘ 55′.0 | 0.0250 ccAbell, Corwin & Olowin (1989) | 0 | 0.1 | 10 | ||
| A2877 | 1h 9m 56s | -45∘ 55′.9 | 0.0248 aaWu, Fand & Xu (1998) | 887 ddFadda et al. (1996) | 0 | 0.46 | 16 | 25.1 |
| A2911 | 1h 26m 12s | -37∘ 56′.4 | 0.0202 ccAbell, Corwin & Olowin (1989) | 547 ddFadda et al. (1996) | 1 | 0.1 | 10 | 3.9 |
| A3193 | 3h 58m 13s | -52∘ 20′.5 | 0.0351 bbDale et al. (1999c) | 624 bbDale et al. (1999c) | 0 | 0.3 | 10 | 5.2 |
| A3266 | 4h 31m 10s | -61∘ 26′.7 | 0.0593 bbDale et al. (1999c) | 1103 bbDale et al. (1999c) | 2 | 6.15 | 4 | 36.3 |
| A3367 | 5h 49m 21s | -24∘ 28′.1 | 0.0426 ccAbell, Corwin & Olowin (1989) | 0 | 0.4 | 1 | ||
| A3376 | 6h 0m 43s | -40∘ 3′.0 | 0.0490 aaWu, Fand & Xu (1998) | 688 ddFadda et al. (1996) | 0 | 2.48 | 2 | 6.4 |
| A3381 | 6h 9m 54s | -33∘ 36′.0 | 0.0384 bbDale et al. (1999c) | 304 bbDale et al. (1999c) | 1 | 0.2 | 6 | 0.3 |
| A3389 | 6h 21m 47s | -64∘ 57′.6 | 0.0267 ccAbell, Corwin & Olowin (1989) | 598 ddFadda et al. (1996) | 0 | 0.32 | 3 | 5.0 |
| A3395 | 6h 27m 31s | -54∘ 24′.0 | 0.0506 aaWu, Fand & Xu (1998) | 852 ddFadda et al. (1996) | 1 | 2.80 | 2 | 14.6 |
| A3407 | 7h 5m 1s | -49∘ 4′.6 | 0.0429 bbDale et al. (1999c) | 490 bbDale et al. (1999c) | 1 | 0.4 | 4 | 1.8 |
| A3408 | 7h 8m 31s | -49∘ 12′.9 | 0.0420 ccAbell, Corwin & Olowin (1989) | 900 eeCampusano, Kneib & Hardy (1998) | 0 | 0.50 | 6 | 20.6 |
| A3528 | 12h 54m 18s | -29∘ 1′.3 | 0.0530 ccAbell, Corwin & Olowin (1989) | 972 ddFadda et al. (1996) | 1 | 1.33 | 8 | 8.0 |
| A3558 | 13h 28m 00s | -31∘ 30′.5 | 0.0488 bbDale et al. (1999c) | 965 bbDale et al. (1999c) | 4 | 6.27 | 15 | 24.6 |
| A3564 | 13h 34m 22s | -35∘ 13′.5 | 0.0491 ccAbell, Corwin & Olowin (1989) | 1 | 0.5 | 7 | ||
| A3571 | 13h 47m 28s | -32∘ 52′.1 | 0.0396 ccAbell, Corwin & Olowin (1989) | 1045 ddFadda et al. (1996) | 2 | 7.36 | 2 | 38.7 |
| A3572 | 13h 48m 11s | -33∘ 22′.9 | 0.0405 ccAbell, Corwin & Olowin (1989) | 0 | 0.4 | 4 | ||
| A3574 | 13h 49m 9s | -30∘ 17′.9 | 0.0141 ccAbell, Corwin & Olowin (1989) | 491 ddFadda et al. (1996) | 0 | 0.1 | 5 | 2.8 |
| A3656 | 20h 0m 32s | -38∘ 31′.7 | 0.0186 bbDale et al. (1999c) | 350 bbDale et al. (1999c) | 0 | 0.1 | 22 | 0.7 |
| A3667 | 20h 12m 30s | -56∘ 49′.0 | 0.0550 bbDale et al. (1999c) | 1059 bbDale et al. (1999c) | 2 | 8.76 | 22 | 32.8 |
| A3716 | 20h 51m 30s | -52∘ 43′.0 | 0.0454 bbDale et al. (1999c) | 842 bbDale et al. (1999c) | 1 | 1.01 | 26 | 15.0 |
| A3744 | 21h 7m 12s | -25∘ 29′.0 | 0.0371 bbDale et al. (1999c) | 570 bbDale et al. (1999c) | 1 | 0.3 | 30 | 3.6 |
| A4038 | 23h 47m 54s | -28∘ 09′.3 | 0.0291 bbDale et al. (1999c) | 843 bbDale et al. (1999c) | 2 | 1.90 | 12 | 19.2 |
Note. — in column 4 references a and b give heliocentric redshifts while in reference c the redshifts are relative to the CMBR.
The observational material that is analyzed here consists of several Kron-Cousins I-band images obtained with the 0.9m CTIO telescope. The details of the observations are discussed in (Dale et al., 1997, 1998) and here we only summarize them. The detector used was the 2k2k Tek2k No.3 CCD, with a scale of 0.396 arcsec per pixel, resulting in a field of 13.5 per image. The exposure times were of 600 seconds in all cases. The images reach 23.7 I mag arcsec-2 at the 1.0 level over the sky background. In Section 4 we estimate that the isophotal completeness limit for extended sources in these images is 19.5 mag (1.5 in 40 connected pixels), corresponding to a total magnitude limit of 19.0 mag. The average seeing of the images is 1.4′′. Although these images are not very deep, this material is the same where Campusano & Hardy (1996) found an arc in A3408. These images in general do not uniformly cover a cluster, since they were taken in regions near spiral galaxies, but the central region of the clusters are always covered. The number of images analyzed per cluster are also presented in Table 1.
This sample is a good representation of the cluster distribution in the nearby universe. Its richness distribution is presented in Table 2. It is consistent with the whole Abell catalog (Abell, Corwin & Olowin, 1989) , with a slight excess of high richness clusters. In Figure 1 we compare the X-ray luminosity distribution of our sample with that of the XBAC catalogue (Ebeling et al., 1996) in the same redshift range (i.e., 0.014 0.076). The XBAC catalogue is a X-ray flux limited catalog of Abell clusters from the ROSAT all sky survey. Note that the clusters that were not detected by ROSAT have been included in the first bin in Figure 1. This figure indicates that the X-ray luminosity distribution of our sample presents an overall agreement with the cluster distribution of the nearby Universe.
If richness and X-ray luminosity are proportional to cluster mass, we conclude that the mass distribution of our cluster sample is representative of that actually present at low redshifts.

| Richness class | Abell catalog | Present sample |
|---|---|---|
| 0 | 60% | 42% |
| 1 | 30% | 36% |
| 2 | 9% | 15% |
| 3 | 2% | 3% |
| 4 | 0.2% | 3% |
| 5 | 0.02% | 0% |
3 Probabilities of strong lensing by nearby clusters
In this section we will discuss how often one should expect to observe any signature of strong lensing effects in a sample of nearby clusters, taking into account some observational constraints. The lensing model adopted here assumes that the cluster mass profile may be described by a singular isothermal sphere (SIS) and is presented in detail in Appendix A. The model has 10 parameters. Each cluster is characterized by two parameters: its redshift and the one-dimensional velocity dispersion . The luminosity function of the field galaxies is described by a Schechter function and has three parameters: , , and . The analysis of the observations also has three parameters: the adopted limit magnitude , the seeing of the observations , and the minimum flux amplification by lensing, . Note that in the SIS model for strong lensing is also equal to the tangential stretching of the arc or arclet. Once the cosmological model is specified by the density parameters associated to the mass and to the vacuum, and , all the parameters for the calculation are fixed and there is no dependence on the value of .
We adopt here the luminosity function derived in the Stromlo-APM Redshift Survey (Loveday et al., 1992), that is representative of the local field galaxies. This luminosity function is well fitted by a Schechter function with parameters , , and Mpc-3. Assuming a color (Fukugita, Shimasaku & Ichikawa, 1995), that is appropriate for a Sbc galaxy (that is a good average of the local morphological mix of galaxies), we have that for km s-1 Mpc-1. For simplicity, we neglect any evolution of the parameters and with . This luminosity function is consistent with galaxy counts in the I-band (Smail et al., 1995).
We first discuss how the expected number of arcs varies with the magnitude limit of the observations, neglecting seeing effects. Figure 2 shows how the expected number of arcs with Amin =2 (the minimum amplification produced by a SIS, see Appendix A), for a single cluster at with km s-1 (a massive, Coma-like cluster), varies with the magnitude limit of the arc search. The results are presented for three cosmological models: standard CDM (SCDM: , ); open CDM (OCDM: , ); and cosmological constant CDM (CDM: , ). With (the limit adopted in the search), we have that is equal to 0.30, 0.31 and 0.37, for SCDM, OCDM and CDM, respectively. A value of is achieved at , and 19.9, for these 3 cosmologies. Figure 2 reveals that the expected number of arcs increases strongly with , and searches going one magnitude deeper than ours may plausibly find 2 to 3 times more evidence of strong lensing than our own search. These results also indicate that different cosmological models lead to similar results, at least for bright values of . A major source of uncertainty in this kind of calculation is due to the normalization of the luminosity function, , as evidenced by galaxy number counts in different directions. Assuming an uncertainty of a factor 2 in , would be attained for , where the brighter and the fainter limits are for CDM and SCDM, respectively.

Figure 3 shows the dependence with the redshift of the expected number of arcs with Amin =2, for a cluster with km s-1, adopting ml as 19.0, for the same three cosmologies. Here too we are neglecting seeing effects. This figure indicates that nearby clusters are more efficient than far ones to produce arcs brighter than some magnitude limit. This is due to the fact that low redshift clusters project larger angular cross sections on to the plane of the sky than more distant clusters. This result is not in disagreement with the statistics of arcs as a function of the lens redshift, which has a maximum in the range 0.2 0.4 (e.g. (e.g. Fort & Mellier, 1994). Indeed, Figure 3 shows the expected number of arcs per cluster, and those arc statistics not only consider the lensing efficiency of a cluster at a given redshift, but also the total number of clusters (or the comoving volume if we consider a constant density of clusters) per bin of redshift too.

To calculate for our whole cluster sample, we need the velocity dispersion of the clusters. Unfortunately this quantity is not known for 5 clusters in the sample. For A3408 we used the value of Campusano, Kneib & Hardy (1998) “dark halo” scenario. The remaining 4 clusters were removed from this analysis (although they have been included in the arc search described in the next section). Since their velocity dispersions are probably small (due to their low richness and absence of detectable X-ray emission), their impact on the results should be negligible. The values of adopted in the calculation were corrected to their rest frame values (i.e., the actual value is the observed value that appears in Table 1 times ).
Assuming =2 and the same magnitude limit adopted in the arc search, , the expected number of arcs and arclets in our cluster sample is 2.9 for SCDM, 3.0 for OCDM, and 3.6 for CDM. Seven clusters with km s-1 contribute with more than 55% for . Note that these are upper limits, actually, since this estimate does not include the seeing.
The seeing may dramatically affect this kind of estimate, because it tends to circularize non-circular sources. In order to quantify seeing effects, we have made simulations, using the IRAF package artdata. We have simulated “arcs” as exponential profiles with central surface brightness 19.9 I-band mag arcsec-2 (typical of a Freeman, 1970, galaxy disc) with several total apparent magnitudes and axial ratios, assuming the same sky level and noise of our images. These simulated images have been convolved with a Moffat PSF with FWHM 1′′.4 (the average seeing of our images) and then their magnitudes and axial ratios were measured with the software SExtractor (Bertin & Arnouts, 1996), using the same parameters used in the search for arcs (Section 4).

Let us assume that we can identify a gravitational arc if it has an axial ratio of at least 1.5. For a given value of its intrinsic axial ratio, this arc would be identified only if its magnitude is lower than some limit , because fainter images would appear with amplification inferior to 1.5 due to the seeing. Large and bright arcs are not strongly affected by the seeing, but faint and small arclets are. With 500 simulations for 50 values of the intrinsic axial ratio, we have estimated the mean value of . The results are illustrated in Figure 4. Another result of the simulations is that the difference between total and isophotal magnitudes near the limit of detection is about 0.5. Considering that the observed limit of completness is 19.5, we conclude that the total magnitude limit is 19.0 mag.
We present in Figure 5 the expected number of arcs for a cluster with km s-1 at . This figure shows how dramatic are seeing effects for lensing detection. The results displayed in Figure 5 for each cosmological model may be parametrized as , where is the expected number of arcs in the absence of image degradation due to the seeing. A value of provides a good fit to the data.

We have recalculated the estimates of the number of arcs in our sample taking the seeing into account. The expected values are 0.32, 0.34, and 0.42, for SCDM, OCDM and CDM models, respectively. Note that the inclusion of the seeing in the analysis has lead to a substantial decrease in the number of expected arcs; these numbers are 9 times smaller than when seeing effects are neglected. Using the OCDM results and Poissonian statistics, the probability of one arc detection in the sample is 24.2%, two detections is 4.1%, three detections is 0.5%, and no detections is 71.2%. Hence, our estimation is more consistent with no detections, but the probability of finding at least one arc is not negligible.
4 Search of bright arcs and arclets
In this section we describe the procedure we have adopted in the search for arcs and arclets produced by gravitational lensing in the sample of clusters presented in Section 2. We have looked for evidence of strong lensing not only in the regions corresponding to the central parts of the clusters, where the projected mass density is high and, consequently, the probability of lensing is higher than in other regions, but also around bright galaxies.
Our strategy for the search was the following. Initially, we made a catalog of galaxies using SExtractor. We adopted a detection threshold of 1.5 over the sky level (which corresponds to 23.3 mag arcsec -2) and a minimum detection area of 40 pixels (or 6.27 arcsec2). The distribution of magnitudes of the galaxy catalog presents a cutoff at , indicating that its completeness limit is at .
Afterwards, all galaxy images with semi-major axis larger than 8 pixels (3.17 arcsec) were modeled with the STSDAS/Ellipse package, and the model images were subtracted from the actual galaxy images. The aim here was to reveal any arc-like structure superposed on to a galaxy image. In general this procedure worked well, showing the presence of several objects within the galaxy image. This procedure tends to produce a central residual, due to the seeing and pixelization but, since these residuals are usually restricted to the very central regions of a galaxy image, they do not have a relevant impact in our arc survey. During the process of image subtraction we inspected by eye most of the images in each field, paying special attention to objects with axial ratio larger or equal to 1.5.
After the subtraction of the galaxy images, we created a new SExtractor galaxy catalog and visually inspected all new objects contained in this second catalog, focusing again on the more elongated ones. At first we selected about twenty candidates, elongated objects which could not be morphologically identified, by visual inspection, as edge-on spirals. Then we verified whether these objects were tangentially or radially disposed with respect to the cluster center or some bright, nearby galaxy. After this stage, only two candidates remained. The first is the same arclet discovered by Campusano & Hardy (1996) in A3408 and discussed by Campusano, Kneib & Hardy (1998). The second candidate was found in the cluster A3266. It is not in the central region of the cluster but near one bright elliptical galaxy. It is, hence, a candidate for lensing by a cluster substructure, instead of lensing by the cluster overall potential.
5 Discussion
In this section we discuss the main characteristics of the two arclet candidates, taking into account some new follow-up observations.
5.1 The arclet in A3266
The cluster A3266 (also known as Sérsic 40/6) is apparently regular, with type I-II in the Bautz-Morgan system. Its center contains a very tight dumbbell pair, at and (J2000). The recession velocity of the cluster relative to the CMBR is 17782 km s-1. A detailed analysis of this cluster by Quintana, Ramírez & Way (1996) reveals that it has a large velocity dispersion, 1306 73 km s-1 within Mpc, that has been interpreted as an evidence that A3266 is indeed the result of a recent merger of two structures of comparable masses. This interpretation is also supported by numerical simulations (Flores, Quintana & Way, 1999) as well as by an analysis of the X-ray brightness distribution (Mohr, Fabricant & Geller, 1993).
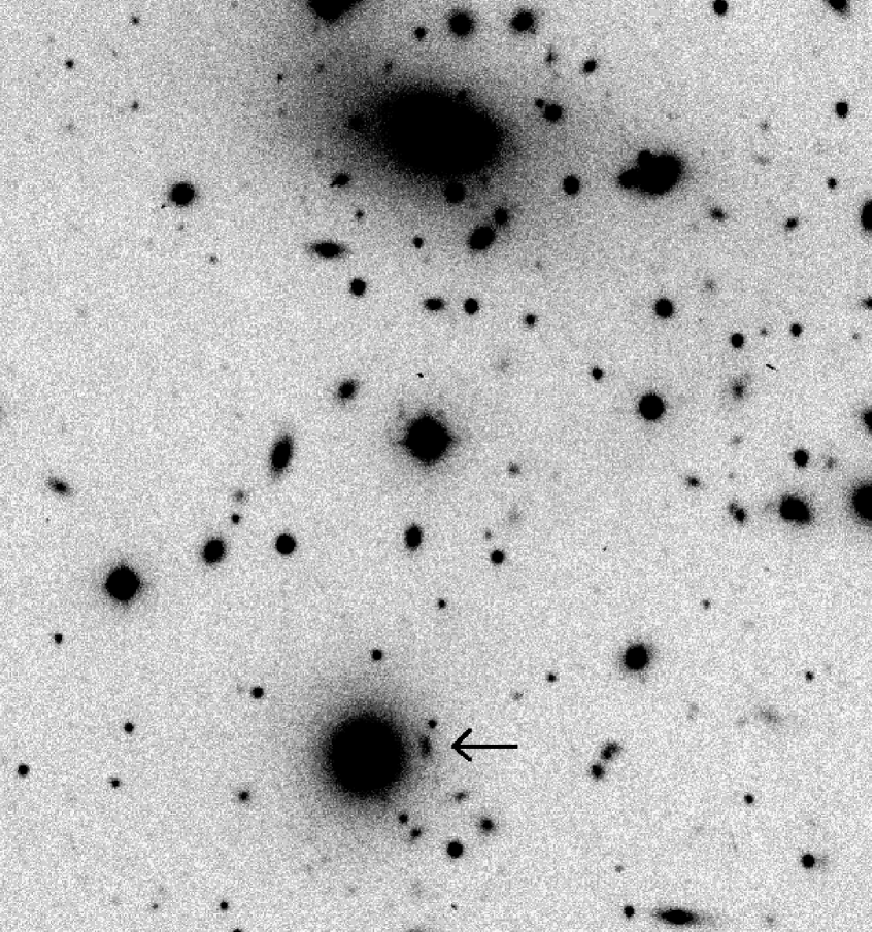
We present in Figure 6 part of the I-band image of A3266, taken with the 0.9m CTIO telescope. The candidate arclet is indicated with an arrow. Its centroid is at and (J2000). It is at 16.6 arcsec (29 h kpc at the cluster distance) from the center of a nearby, bright elliptical, and at 2.89 arcminutes (303 h kpc) from the center of the cluster (at the position of the dumbbell pair). At the isophotal level of 23.3 mag arcsec-2 (1.5 over the sky background) its magnitude, semi-major axis, axial ratio, and position angle are , , , and , respectively.
The elliptical galaxy near the object is located at and (J2000) and is the second brightest galaxy of the cluster in the I-band (apart from the central dumbbell pair). Its heliocentric radial velocity is 15819 30 km s-1 and its apparent total B magnitude is 15.40 0.20 (de Vaucouleurs et al., 1991), corresponding to an absolute magnitude of -22.38.
Spectroscopic observations of the arclet by W. Kunkel (private communication) with the 2.5m Dupont telescope have shown that this object has an heliocentric radial velocity of 21900 km s-1. With this velocity, this object may be inside the cluster, since most of the cluster members have velocities between 15000 km s-1 and 21000 km s-1 (Quintana, Ramírez & Way, 1996) On the other hand it can also be behind the cluster, which strengths the probability that it has been lensed either by the cluster potential or by the nearby galaxy, or both. In particular we want to test the hypothesis that this is a background galaxy being lensed by a mass peak associated with the bright elliptical near the arc.
Let us assume a SIS model for the mass distribution centered at the center of the nearby, bright elliptical galaxy. From the observed elongation of the arc candidate (that is equal to its amplification), the distance between the center of the lens and the arc image is about two critical radius (see Appendix, Equation A2). Hence, the SIS should have a velocity dispersion of 1265 km s-1, approximatelly the same of the cluster itself. The mass enclosed within the arc radius is h M⊙. The bright galaxy near the arc has at the 23.7 mag arcsec-2 level. Assuming , appropriate for an elliptical galaxy (Fukugita, Shimasaku & Ichikawa, 1995) the arc would be explained by our lens model if M/LV=163 h50 M⊙/L⊙ for this system. Such a high M/L value could be expected if this galaxy were at the center of a massive sub-structure. However, neither the X-ray map of the cluster (Jones & Forman, 1999) nor the dynamical analysis of Quintana, Ramírez & Way (1996) present any evidence of significant sub-structure at this position. Possibly, this arc-like feature is a disk galaxy (or the bar of a disk galaxy) that is a cluster member (or is not far from it) instead of a real arclet.
5.2 The arclet in A3408
This structure has been discussed by Campusano, Kneib & Hardy (1998), who successfully modeled it as a galaxy at lensed by the cluster A3408, at . The adopted cluster mass distribution is a scaled version of mass profiles derived from the study of high redshift clusters. Their preferred model has a component that follows the brightness profile of the central elliptical galaxy and is immersed in a massive dark halo. From the lens model and the equivalent widths of some prominent emission lines ([O II] 3727, [O III] 5007 and H) they have suggested that the source galaxy is probably a spiral with intrinsic diameter 14.6 kpc and magnitude .
We have imaged the central part of A3408 with the 0.9m telescope of CTIO with interference filters with the aim of detecting other galaxies at the redshift of the source, which could help to improve the lens model. We have used two different filters. One is centered at 7053 Å, with FWHM of 79 Å, which allows the detection of H at the redshift of the source, covering a velocity range of 1700 km/s. The other is centered at 6961 Å, with FWHM of 79 Å, and samples the continuum near the H line. We have used the Tek2k3 CCD to make 5 images of 15 minutes each in each of the two filters.
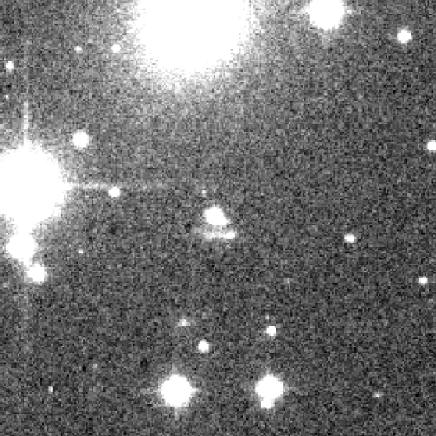
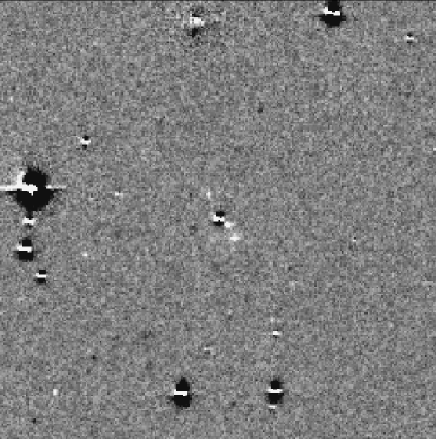
The images were reduced using standard procedures with IRAF. They were stacked and normalized so that at the end of the reduction we had two images (one for each filter) where the mean flux (counts) of the stars were the same in both images. After that, we produced a new image by subtracting the image taken with the continuum filter from the image taken with the filter centered in H. Figure 7 presents both the H and the residual images of the central region of A3408, centered at the position of the star near the arc position. The image containing the residuals indicates that the image subtraction was good, despite the features that remained at the center of the star and galaxy images (produced by seeing and pixelization effects), since most of the extended regions of the object images were removed. Figure 7 also indicates that the H emission of the arc is not uniform and is strongest at the western side of this object.
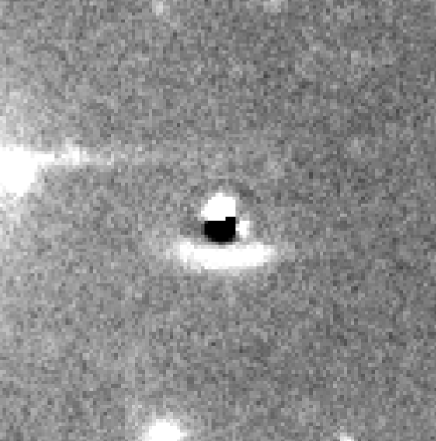
An interesting feature present in the residual image is a point-like object, between the side of the arc with the strongest H emission and the star below the arc. This object also appears in broad band images, after removing the image of this star, as shown in Figure 8. This feature is probably a companion galaxy of the arc source, at approximately the same redshift. Unfortunately, the presence of the star precludes further analysis of this object and its use to constrain more sophisticated lens models. No other objects are seen in Figure 7 at the same redshift of the arc. Note that this does not mean that a galaxy group (containing the arc source) can not exist, because only their brightest members could be detected in these images. Moreover the CCD covers an area of 1.52 1.52 hMpc at z = 0.073. Some loose groups occupy areas larger than it (up to 5 Mpc of side), so we might not be sampling the entire group; however, in this case the over-density caused by this group behind A3408 might be not so significant and the impact of its presence on our probability calculation would be small.
Overall, A3408 seems to be a an interesting structure. It is a poor cluster, with low X-ray emission but high lensing mass, consistent with its velocity dispersion of 900 km s-1. On the other side, it may be in interaction with A3407, since they are very close to each other (Galli et al., 1993). Weak lensing observations of this cluster, combined with other methods of mass determination, like dynamical or X-ray analysis, should give us a better understanding of this system.
5.3 Comparison of theoretical and observational results
As discussed in Section 3, the probabilities for 0 and 1 detection of a gravitational arc in the cluster sample discussed here and including seeing effects are 71% and 24%, respectively. On the other side, our search for arcs in this sample produced two candidates, one in A3266 and the other in A3408. The arclet in A3408 is indeed good evidence of gravitational lensing by a nearby cluster (Campusano, Kneib & Hardy, 1998). The arc-like object in A3266, however, is more difficult to be interpreted as a result of gravitational lens distortion, because it would require a very massive substructure around the bright elliptical galaxy near the object. Note that one arc detection is consistent with our theoretical expectations but, of course, this does not allow us to strongly constrain any of the model parameters.
It is worth stressing the relative role played by the seeing and the magnitude limit in arc searches. As shown in Section 3, the expected number of arcs increases fast with the limiting magnitude of a survey, but seeing strongly affects fainter galaxies. Better seeing conditions lead to a substantial increase in the efficiency of these surveys. Searches of strong lensing effects in clusters will greatly benefit of the improvement in image quality that is arriving with active and adaptive optics cameras and new generation telescopes.
It is interesting to compare our results with those of Luppino et al. (1999). They have searched for arcs and arclets in a sample of 38 X-ray selected clusters ( erg s-1) from the Einstein Observatory Medium Sensitivity Survey (EMSS) in the redshift range 0.15 0.823. Their images were obtained with the University of Hawaii 2.2m telescope in the R band for all clusters, and in the B band for most of them. The median seeing in R was 0.8′′. They found arcs and arclets in 8 clusters, or 21% of the sample, that can be compared with our success rate of only 3% (1 arc in 33 clusters). This discrepancy may be explained by taking into account that the two samples are very different regarding redshift distribution and image quality (resolution and magnitude limit). The images of Luppino et al. were obtained under better seeing conditions and are substantially deeper than ours. Besides, the EMSS sample, based on X-ray luminosities, is biased towards massive clusters.
6 Summary
We have discussed strong lensing effects produced by nearby clusters of galaxies. Using a simple mass model for the clusters we have shown that the expected number of arcs or arclets expected in a sample of nearby clusters is not as small as is usually thought. The results are strongly dependent on the magnitude limit and the seeing quality of the imaging.
Our search for arcs and arclets in a sample of 33 nearby clusters has resulted in two arc candidates, one in A3408 and the other in A3266. The first was already discovered by Campusano & Hardy (1996) and modeled by Campusano, Kneib & Hardy (1998). Observations in H reported here show the presence of another object near the arc at approximately the same redshift, but contamination from a foreground star precludes its further use to constrain the cluster mass model. Our analysis of the arclet candidate in A3266 suggests or a false detection or that the mass concentration necessary to explain this structure by lensing is very strong.
Our result indicates that deep imaging of nearby clusters under good seeing conditions may be extremely useful for high-resolution mapping of the mass distribution of these structures, since the probability of detection of strong lensing features will be enhanced. Additionally, deep imaging with mosaic CCD detectors (e.g. Joffre et al., 1999) also allow the detection of weak lensing, which may provide more constraints on the mass distribution in the central regions of the galaxy clusters.
Appendix A Estimation of the expected number of gravitational arcs and arclets in a sample of clusters
We assume here that the matter distribution of a galaxy cluster can be described by a singular isothermal sphere (SIS). The reason for this choice is twofold. First, this is the simplest model, with only one parameter: the one-dimensional velocity dispersion . Second, in this model one can easily relate amplification of a background source and its tangential stretch to the impact parameter (angular distance between the source and the center of the lens). We also assume that galaxies follow dark matter and have the same velocity dispersion.
More complex models may not be necessary, given the uncertainties in many parameters that enters in this calculation. For instance, if instead of a SIS we have considered a model with a core radius, the lensing probability would decrease (e.g. Wu & Hammer, 1993). Conversely, an ellipticity in the galaxy distribution, as well as the presence of sub-structures in a cluster, increases the lensing probability, due to enhanced tidal effects introduced by the asymmetry in the mass distribution (Bartelmann, 1995). Hence, the effects due to the inclusion of a core radius and cluster ellipticity may more or less cancel each other. Note also that the determination of these two quantities is not easy, being very sensitive to the choice of the cluster center and the presence of sub-clustering. Of course, even more refined mass models of each cluster are possible, where individual galaxy halos are taken into account (e.g. Kneib et al., 1996; Natarajan et al., 1998; Geiger & Schneider, 1999; Bézecourt et al., 1999), but such models are beyond the scope of this simple calculation. Anyway, we do not expect that the order of magnitude of the results presented here will change dramatically with the use of more sophisticated mass models.
Arcs and arclets (see Fort & Mellier, 1994, for a review) are a result of strong lensing by galaxy clusters of extended sources close to cusps or higher order catastrophes in the source plane. In what follows we will assume that an arc or arclet is produced if a source bright enough falls within the critical circle of the cluster in the source plane. It is well known that a spherically symmetric lens like our SIS model does not produce cusps. However, this drawback does not precludes the use of this sort of model to obtain estimates of the the strength of lensing effects. Indeed, such an approach has been extensively applied to compute lensing cross sections (e.g. Bartewlmann, 1993; Cooray, Quashnock & Miller, 1999; Cooray, 1999).
For a singular isothermal sphere be able to act as a strong lens, the source (in the source plane) should be within the critical circle inside which the mean mass surface density of the cluster is greater than a certain critical density that depends only of the relative distances between observer, cluster, and source (and hence of the cosmology). The angular radius of this critical circle (centered in the cluster center) is
| (A1) |
where and are the angular diameter distances between the lens (at redshift ) and the source (at ), and between the observer () and the source, respectively. The diameter distances are computed adopting the analytical filled-beam approximation (Fukugita et al., 1992). Following Blandford & Kochanek (1987), the magnification of the brighter of the two images produced by this lens is given by
| (A2) |
where is the angular distance on the plane of the sky between the center of the lens and the source (the impact parameter).
The expected number of arcs with magnification larger than a certain value (the minimum amplification produced by a SIS is 2) due to a cluster at redshift can be written as
| (A3) |
where is the number of observable sources between and that suffer magnifications between and by the gravitational field of the cluster. These are the sources in that redshift interval with luminosities larger than , where is the minimum luminosity that a source at redshift should have to be included in the sample (in the absence of lensing effects), and that are inside a ring with solid angle . Here is the angular distance to the cluster center corresponding to a magnification of the source luminosity, accordingly to Equation (A2). It is easy to verify that
| (A4) |
We can also write
| (A5) |
where is the mean number density of the sources at redshift that are bright enough to be detected:
| (A6) |
where the term takes into account the magnification bias, by which some sources are magnified by lensing, acquiring an apparent luminosity high enough to be included in a magnitude limited sample.
The differential luminosity function at , , may be described by a Schechter function in which the comoving density of galaxies at redshift with luminosities between and is
| (A7) |
where , and are the parameters of the luminosity function at redshift . Then,
| (A8) |
Assuming that the number of sources in a comoving volume is conserved, we have that
| (A9) |
where is the normalization of the local () luminosity function.
The luminosity is related to the magnitude limit considered in the analysis and the magnification by
| (A10) |
where is the redshift of a source and is the local value of the characteristic magnitude of the luminosity function in the photometric band of interest. Note that we are assuming that the source galaxies and have the same and evolutive corrections.
The volume element that also appears in Equation (A5) is the proper volume between and and may be written as
| (A11) |
where
| (A12) |
and where and are the density parameters for matter and vacuum energy, respectively.
Putting all together, the expected number of arcs produced by a cluster at redshift is
| (A13) |
where we have adopted (our results are insensitive to this limit of integration, because the number of sources brighter than decreases quickly with ).
A more realistic model must, however, take into account the effect of the seeing, that tends to circularize object images, specially the faint ones. The simulations described in Section 3 show that, for a given intrinsic stretching (or amplification ), the observed axial ratio will be larger than 1.5 (the minimum value adopted in the arc search discussed in Section 4) only for objects brighter than a certain apparent magnitude . Hence, seeing effects may be included in the analysis by using the minimum of and instead of in Equation (A10). The relation between and adopted here is shown if Figure 4.
For a sample containing clusters, the total expected number of arcs is given by
| (A14) |
where and are the redshift and velocity dispersion of the th cluster.
References
- Abell, Corwin & Olowin (1989) Abell, G. O., Corwin, H. G., JR., & Olowin, R. P. 1989, ApJS, 70, 1
- Allen, Fabian & Kneib (1996) Allen, S. W., Fabian, A. C., & Kneib, J. P. 1996, MNRAS, 279, 615
- Bartewlmann (1993) Bartelmann, M. L. 1993, A&A, 276, 9
- Bartelmann (1995) Bartelmann, M. L. 1995, A&A, 299, 11
- Bertin & Arnouts (1996) Bertin, E., & Arnouts, S. 1996, A&AS, 117, 393
- Bézecourt et al. (1999) Bézecourt J. . Kneib, J. P., Soucail, G. & Ebbels, T. M. D. 1999, A&A, 347, 21
- Blakeslee & Metzger (1999) Blakeslee, J. P. & Metzger, M. R, 1999, ApJ, 513, 592
- Blandford & Kochanek (1987) Blandford, R. D. & Kochanek, C. S. 1987 in Dark Matter in The Universe, ed. S. Weinberg and T. Piran (World Scientific, Singapore), 133
- Campusano & Hardy (1996) Campusano, L. E. & Hardy, E. 1996, in Astrophysical Applications of Gravitational Lensing, ed. C. S. Kochanek & J. N. Hewitt (Dordrecht: Kluwer), 125
- Campusano, Kneib & Hardy (1998) Campusano, L.E., Kneib, J. P. & Hardy, E. 1998, ApJ, 496, L79
- Cooray (1999) Cooray, A. R. 1999, A&A, 341, 653
- Cooray, Quashnock & Miller (1999) Cooray, A. R., Quashnock, J. M., & Miller, M. C., 1999, ApJ, 511, 562
- Dale et al. (1997) Dale D. A., Giovanelli R., Haynes M. P., Scodeggio M., Hardy E. & Campusano L. E. 1997, AJ, 114, 455
- Dale et al. (1998) Dale D. A., Giovanelli R., Haynes M. P., Scodeggio M., Hardy E. & Campusano L. E. 1998, AJ, 115, 418
- Dale et al. (1999a) Dale D. A., Giovanelli R., Haynes M. P., Hardy E. & Campusano L. E. 1999a, ApJ, 510, 11
- Dale et al. (1999b) Dale D. A., Giovanelli R., Haynes M. P., Hardy E. & Campusano L. E. 1999b, AJ, 118, 1468
- Dale et al. (1999c) Dale D. A., Giovanelli R., Haynes M. P., Campusano L. E. & Hardy E. 1999c, AJ, 118, 1489
- de Vaucouleurs et al. (1991) de Vaucoleurs, G., de Vaucoleurs, A., Corwin JR., H. G., Buta, R. J., Paturel, G. & Fouque, P. 1991, Third Reference Catalogue Of Bright Galaxies, Version 3.9
- Ebeling et al. (1996) Ebeling, H., Voges, W., Bohringer, H., Edge, A. C., Huchra, J. P. & Briel, U. G. 1996, MNRAS, 281, 799.
- Fadda et al. (1996) Fadda, D., Girardi, M., Giuricin, G. & Mardirssian F. 1996, ApJ, 473, 670
- Flores, Quintana & Way (1999) Flores R. A., Quintana, H. & Way, M. J. 1999, astro-ph/9903292 (submitted to ApJ)
- Fort & Mellier (1994) Fort, B. & Mellier Y. 1994, A&A Rev., 5, 239
- Freeman (1970) Freeman, K. C. 1970, ApJ, 160, 811
- Fukugita et al. (1992) Fukugita, M., Futamase, T. Kasai, M. & Turner, E. L. 1992, ApJ, 393, 3
- Fukugita, Shimasaku & Ichikawa (1995) Fukugita, M., Shimasaku, K. & Ichikawa, T. 1995, PASP, 107, 945.
- Galli et al. (1993) Galli, M., Cappi, A., Focardi, P., Gregorini, L. & Vetolani, G. 1993 , A&A, 101, 259S
- Geiger & Schneider (1999) Geiger, B. & Schneider, P. 1999, MNRAS, 302, 118
- Hattori, Kneib & Makino (1999) Hattori, M., Kneib, J.-P. & Makino 1999, Progress of Theoretical Physics, 133, 1
- Joffre et al. (1999) Joffre, M., Fischer, P., Frieman, J., Johnston, D., McKay, T., Mohr, J., Nichol, B., Sheldon, E., Cantaloupo, C., Griffin, G., Peterson, J. & Romer, K. 1999 astro-ph/9909029, submitted to ”Gravitational Lensing: Recent progress and Future Goals”, eds: T.Brainerd and C.Kochanek, ASP Conf Series.
- Jones & Forman (1999) Jones, C. & Forman, W. 1999, ApJ, 511, 65
- Kneib et al. (1996) Kneib, J. P., Ellis, R. S., Smail, I., Couch, W. J., Sharples, R., M. & Oemler, A. Jr. 1996, ApJ, 469, 643
- Loveday et al. (1992) Loveday, J., Peterson, B. A., Efstathiou, G. & Maddox, S. J. 1992, ApJ, 390, 338
- Luppino et al. (1999) Luppino, G. A., Gioia, I. M., Hammer, F., Le Févre, O. & Annis, J. A. 1999 A&A, 136, 117
- Mellier (1999) Mellier, Y. 1999, ARA&A, 37, 127.
- Mohr, Fabricant & Geller (1993) Mohr, J. J., Fabricant, D. G. & Geller, M. J. 1993, ApJ, 413, 492
- Natarajan & Kneib (1997) Natarajan, P. & Kneib, J. P. 1997, MNRAS, 287, 833
- Natarajan et al. (1998) Natarajan, P., Kneib, J. P., Smail, I. & Ellis, R. S. 1998, ApJ499,600
- Quintana, Ramírez & Way (1996) Quintana, H., Ramirez, & Way 1996, AJ, 112, 36.
- Shaya, Baumn & Hammergren (1996) Shaya E. J., Baum W. A. & Hammergren M. 1996, in Clusters, Lensing and the Future of the Universe, ASP Conf. Ser. 88, ed. Trimble V., Reisenegger A., p. 237.
- Smail et al. (1995) Smail, I., Hogg, D. W., Yan, L. & Cohen, J. G. 1995, ApJ, 449, 105
- Wu, Fand & Xu (1998) Wu X. P., Fang L. Z., & Xu W. , 1998, A&A, 338, 813.
- Wu & Hammer (1993) Wu, X. P. & Hammer, F. 1993, MNRAS, 262, 187