Normal Galaxies in the Infrared111Lecture notes from the Summer School “Infrared Astronomy: Today and Tomorrow,” held in Les Houches, August 1998. Editors F. Casoli and J. Lequeux.
1 INTRODUCTION
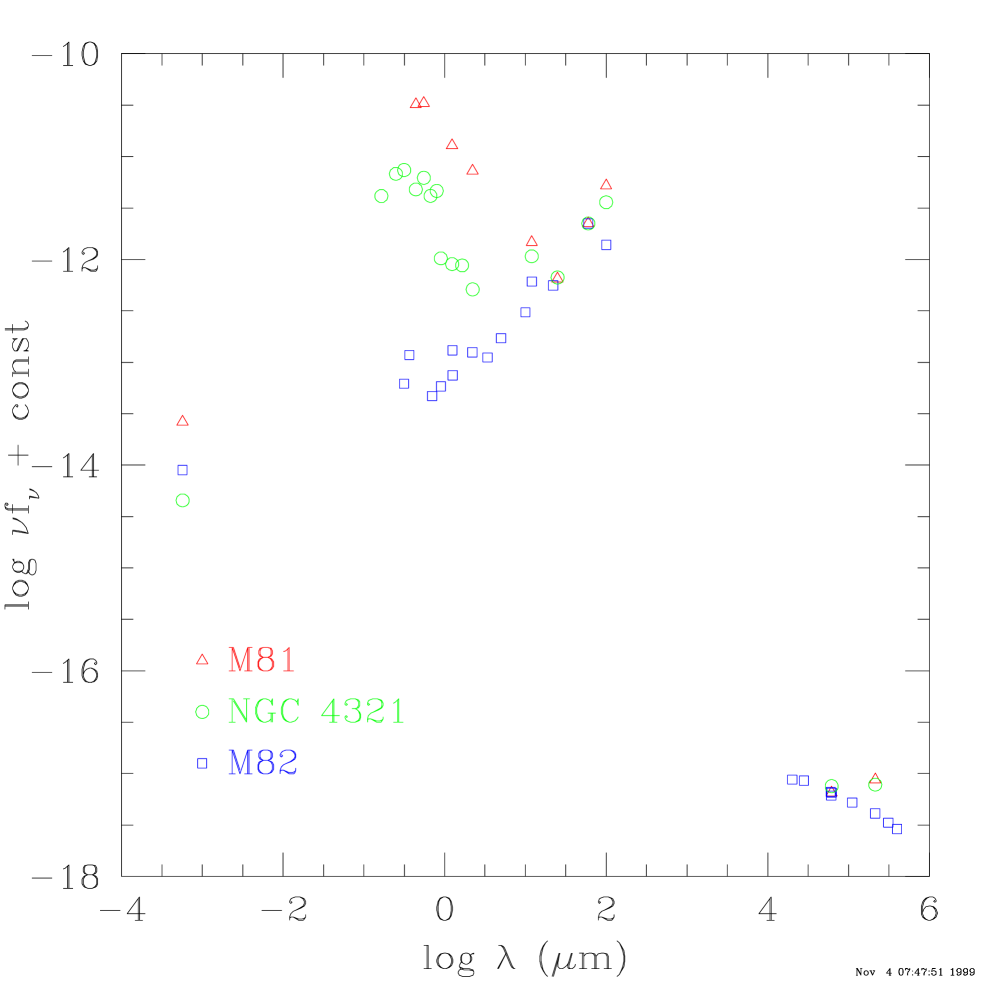
A normal galaxy is one that derives its luminosity primarily from nuclear burning in stars, and is at neither the high nor the low extreme of the luminosity distribution. In such galaxies, the visible and ultraviolet is the only direct window onto the photospheres of stars, whereas the rest of the spectrum reflects reprocessed light from stars (Figure 1). Dust in the interstellar medium reprocesses part of the stellar luminosity into infrared emission from a few to 1 mm or longer wavelengths. The radio emission at millimeter wavelengths derives from thermal emission from ionized plasmas in HII regions, whereas the synchrotron emission from cosmic ray electrons () trapped in the magnetic field of the galaxy fill in the cm-wavelength spectrum. In the X-rays, the luminosity is dominated by very hot plasmas at created by shocks from supernova explosions. The global spectrum of normal galaxies has some very stable signatures, and other quite variable aspects. Much of this article is an attempt to understand what makes for stability in the spectrum, and what significance to attach to the variable parameters.
Since stars form in the interstellar medium (ISM), it is no surprise that galaxies forming stars actively have substantial ISM luminosities, conveyed overwhelmingly in the infrared, and often exceeding by large factors the optical and ultraviolet luminosity. Studying galaxies in the infrared is thus tantamount to studying the ISM and its properties, and star formation (SF) activity on large scales.
Astration, the cycle of star formation, nuclear burning and ISM enrichment in heavy elements, is the primary secular change and main evolutionary process affecting the chemical make-up and energy balance of the Universe. Because the luminosity function (e.g. Kim & Sanders 1998) falls fast enough that the integral over the population is dominated by the low end of the luminosity interval, over 90% of star formation in the local Universe takes place in normal disk galaxies, rather than the spectacular extremes. Thus, normal galaxies essentially cause and host Cosmic nuclear evolution.
Normal galaxies form a unique bridge between our detailed understanding of the Milky Way and our global understanding of the Universe and its history. Empirically, the integrated emission from galaxies must be compatible with the properties of Galactic objects. Our physical models of the local energy balance and of large-scale processes in the ISM must be consistent with the observed global behavior. On the other hand, galaxy luminosity and spectral properties are a crucial ingredient to modeling the observed faint extragalactic source counts and infrared background. Moreover, modeling the counts and background requires more than a census of the passive population (cf. Puget’s article in this volume), and our models of galaxy behavior must be consistent with population evolution required to explain deep counts. The enrichment in individual galaxies must also add up to the observed current-day abundances. Thus achieving an accurate representation of normal galaxies would verify directly the validity of underlying models of the Milky Way ISM, and is a necessary step to the interpretation of cosmological results.
The InfraRed Astronomy Satellite (IRAS; Beichman et al. 1986) ushered in the era of space-based infrared astronomy in a dramatic fashion, revealing a stunningly rich infrared sky, unanticipated from the bits of infrared data previously and heroically collected from the ground. IRAS conducted the first unbiased all-sky survey at 12, 25, 60 and 100, as well as a spectroscopic survey with a resolving power of 20 between 7.5 and 23, for objects brighter than 10 Jy or so. IRAS had a profound influence on astronomy in general, not just the infrared, because it represented such a very large gain in sensitivity and spatial coverage, comparable perhaps to going from attempting visual astronomy in daylight to observing in a dark night (Beichman 1987; Soifer, Houcj & Neugebauer 1987). Another significant factor in this influence was the dissemination of data products from IRAS, including source catalogs, image atlases and sky brightness estimates, generated with great care and well characterized and documented as to reliability, completeness, flux accuracy, and other statistical attributes.
The Infrared Space Observatory (ISO, Kessler et al. 1996) took infrared astronomy in space to new levels of sensitivity and into a new realm of spectroscopy across the whole range of 3 to 200. Its versatile instrumentation took to the rich and fascinating extragalactic infrared sky first revealed by IRAS, and moved our knowledge of that sky an order of magnitude further and deeper.
In what follows, methods traditionally used in the study of normal galaxies are described, and outstanding questions currently pursued in the field are stated. The most prominent results from the IRAS survey are reviewed in §3. Contributions by ISO in the field of broad-band photometry are then presented (§4), followed by results in spectrospcopy (§5). Normal galaxy studies not directly concerned with the ISM are reviewed in §6. The outlook and challenges in pursuing the interpretation of infrared data on the ISM are discussed in §7.
2 THE STUDY OF NORMAL GALAXIES
Normal galaxies span wide ranges of luminosity and many other parameters such as density, intensity, metallicity, extinction, or light-to-mass ratios. This great diversity in properties, and the complex mix of physical conditions within each system, have frustrated attempts at deriving simple models for the behavior of these “unremarkable” galaxies. Surveys of galaxies in the local Universe have thus become particularly valuable for codifying the empirical evidence. Survey data are typically analyzed to generate statistical information or to address specific questions, usually using global or integrated properties. For instance, luminosity functions are derived, or correlations between parameters are established. In such statistical studies, close attention must be paid to the sample used, for its completeness, selection biases, parameter-space coverage and other aspects could affect the results substantially. Statistical results are usually interpreted in phenomenological terms, explaining the observed trends for instance as reflecting the mixing of two components with distinct properties.
A complementary approach is to study in great detail a few nearby, spatially well resolved systems, and to derive insight from the similarities or contrasts among these cases. Such detailed case studies tend to search for physical insight by relating observational trends to the variation of a physical parameter of the system. While similar insights can also be pursued with statistical studies, case studies can make more convincing arguments based on detailed physical models of the ISM on small scales where homogeneity can be assumed.
Ultimately, one would like all these diverse interpretations to be collected into a self-consistent and complete picture. The main obstacle to such unification is that each observable is a complicated integral over the physical system:
where the integrals are taken over the solid angle of the galaxy and through the line-of-sight respectively, and the contribution at each point is a function of radiation intensity U, density n, temperature T, and weighting functions such as geometry or optical depth effects; the form and dependencies of vary greatly among observables. While the availability of spatially resolved data simplifies the problem by narrowing down the solid angle and therefore the variability of , it does not eliminate it entirely.
The empirical pursuits concerning normal galaxies typically aim at deriving a better description of the infrared properties, especially in terms of identifying the “fundamental parameters” that stand behind the many correlated parameters, and pinning down the precise significance of observables in terms of physical parameters. Another main goal is to pin down similarly the fundamental sequence defined by the evident progression of infrared properties, and to understand its key significance. Is the true sequence simply defined by the infrared spectral energy distribution? Is it driven by intensity variations? Or by the UV content of the heating spectrum, and therefore the galaxy’s content of young stars? Are there secondary parameters defining truly significant multi-dimensional families of properties? Can low-luminosity analogs be defined for objects with extreme properties, making more cases available for study in the Local Universe? An improved empirical understanding of the data in these terms will help improve our understanding of extreme systems, help us better plan high redshift surveys, and understand their biases, and will feed directly into deciphering the data on the infrared cosmic background and on source counts at faint levels.
The physical understanding of star formation on the scale of galaxies must start by addressing the episodic behavior of star formation, and the apparently chaotic behavior on the kpc scale within disks. Can a cycle be identified with well defined phases? Can those phases be distinguished by observations, and can physical drivers and inhibitors for episodes be identified? Can a galaxy then be understood in terms of a superposition of phases of many overlapping episodes, and can the factors be identified which regulate the “steady-state” of the whole disk and the correlations between global parameters? Ultimately, physical models of star formation in galaxies would be used to simulate the history of star fromation and chemical evolution in the Universe, and construct more reliable models of primordial galaxies to guide the search for those first-generation objects.
3 GALAXIES IN THE INFRARED: THE IRAS ERA
IRAS conducted the first unbiased all-sky survey (or almost, covering 98% of the sky), detecting point sources down to 0.2 mJy or fainter at 12, 25 and 60, and down to 1 Jy at 100(Beichman et al. 1986; Moshir et al. 1992). IRAS also carried out a spectroscopic survey with a resolving power of 20 between 7.5 and 23, for objects brighter than 10 Jy or so. IRAS doubled the amount of existing infrared data at within its first hour of observation. The IRAS mission lasted ten months. It resulted in a data set which completely defined our knowledge of normal galaxies at until the launch of ISO. The Kuiper Airborne Observatory (KAO) contributed its share to the field, but because it was limited to high surface brightness objects, its impact on normal galaxies remained minor.
IRAS measured fluxes for nearly 60,000 galaxies, perhaps half of which were previously uncatalogued. It allowed detailed studies of many nearby galaxies, and of course of the Milky Way, establishing several crucial connections between global properties of galaxies and specific aspects and phases of the local ISM. Some of the contributions of IRAS to normal galaxies statistical properties are summarized in the following three subsections. See also the early review by Soifer, Houck & Neugebauer (1987), and the overviews in the 1991 Les Houches Summer School proceedings.
3.1 Basic Parameters and Statitics
3.1.1 Infrared Luminosity
A few key parameters have gained much currency in the study of the integrated emission from galaxies in the infrared. Foremost among these is infrared luminosity , used quite often as an indicator of the total level of activity in the ISM. Various authors have used different spectral definitions for , most commonly favoring either the far-infrared (FIR) or the total infrared . The IRAS data naturally lead to the “FIR” definition (Helou et al. 1988) of a synthetic band combining in a simple way the 60 and 100 flux measurements. in units of is defined by , where and are in Jy. Helou et al. (1988) demonstrated that this combination approximates to within 1% the flux in a synthetic band with uniform transmission between 42.5 and 122.5for blackbody and modified blackbody (with emissivity ) curves with temperatures between 20 and 80 K, and for emissivity index between 0 and 2. They argued this property should therefore also apply to realistic spectral energy distributions of galaxies because those must be made up of a superposition of modified blackbodies in this temperature range. It is essentially a coincidental result of the properties of the IRAS filter shapes that the simple linear combination allows us to estimate the luminosity in a well defined spectral window. The real interest of FIR however is that this window encompasses a large fraction, and therefore a representative measure, of the total infrared luminosity. Fortunately, as discussed in §4 below, the ratio is on the order of 2, and varies relatively slowly with the properties of galaxies.
While is a good indicator of the total luminosity from the ISM of a galaxy, some authors have claimed it to be proportional to the star formation rate. This interpretation has been controversial, and is most probably erroneous, as discussed in §3.4 below. is an extensive quantity, best approximated as an integral over the galaxy of the intensity of the interstellar radiation field times the effective local optical depth of the dust to this radiation. Its interpretation as a measure of star formations is valid only when the optical depth is high everywhere, and the radiation field is derived primarily from young stars.
The normal galaxies under discussion have in the range . Over this interval, the distribution of infrared luminosities is well described by a power-law function with an index in the range -2 to -2.5 (Kim & Sanders 1999). In ultra-luminous galaxies (Houck et al. 1985, Harwit & Houck 1987; Sanders & Mirabel 1996), exceeds , emanating from an ISM heated by prodigious star formation or possibly by an active galactic nucleus. At the other extreme of L(IR), IRAS showed that a minimum luminosity in the mid-infrared can be expected from the photospheres of stars in galaxies (Soifer et al. 1986), but was not sufficiently sensitive to establish whether galaxies emit a minimum luminosity in the far infrared in addition to the photospheric emission, and apart from the ISM emission found even in Elliptical galaxies (Jura 1986; Knapp et al. 1989). Even ISO data may not be adequate to address this question.
3.1.2 The Infrared-to-Blue Ratio
The infrared-to-blue ratio (IR/B) compares the luminosity reprocessed by dust to that of escaping starlight, and is therefore short-hand for the ratio of total infrared to total emerging photospheric emission, from the near-infrared to the ultra-violet. This ratio ranges broadly, from to in known galaxies (Figure 1), with a weak dependence on parameters such as morphology (Sauvage & Thuan 1994), suggesting that it fluctuates substantially in time for the same galaxy.
Because it is a dust-to-star luminosity ratio, IR/B might be interpreted as a function of the effective optical depth of a simple system of stars and dust, with . Most normal galaxies however are far from this simplicity: Some of the visible luminosity comes from stars not participating in the heating of dust, especially old stars in the bulge or far from interstellar clouds. On the other hand, some of the infrared luminosity is traceable to stars completely hidden inside dense clouds, and all but invisible from the outside. Still, IR/B could be turned into a measure of effective optical depth using assumptions for the geometry of stars and dust, for the spectral energy distributions of heating stars, and for the dust efficiency of absorption as a function of (e.g. Xu & Helou 1996). Such assumptions may be well bounded in special cases such as specific parts of a disk, or star-burst galaxies, but their uncertainty is harder to estimate for whole galaxies.
While the interpretation above may be a good approximation for IR/B1, an alternative at lower values is that IR/B characterizes the ratio of current or recent star formation rate to the long-term average rate. In a picture where geometry, heating spectra and dust properties are fixed, the dust luminosity may be interpreted as a measure of stars interacting with the ISM, and thus of the stars recently formed out of that ISM. Unfortunately, the precise time intervals implied by the terms “recent” and “long-term” are themselves a function of the history of star formation in a given galaxy. This interpretation of IR/B applies to systems whose infrared emission is limited by the amount of heating photons available, whereas the optical depth interpretation applies to systems whose infrared emission is limited by the amount of dust available to heat. A dwarf galaxy like NGC 1569 for instance may be undergoing intense star heating by young stars, but have very little neutral ISM left, resulting in low IR/B. On the other hand, a quiescent galaxy may generate most of its infrared emission in HI clouds heated by the older stellar population, and display a similarly low IR/B. The degeneracy between these two cases can only be broken by use of other observables, such as stellar population and morphology, infrared spectral energy distribution, or spectroscopic diagnostics of the gas.
The large dispersion in the IR/B ratio points to dramatic fluctuations in the star formation activity during the lifetime of a galaxy, hence the notion that much of star formation is episodic. Small irregular galaxies are characterized almost entirely by intense episodes of star formation separated by long quiescent periods. There is abundant evidence that galaxies undergoing a nuclear starburst cannot sustain it for more than a small fraction of their lifetime (Sanders & Mirabel 1987). Large disk galaxies in steady state appear to have several episodes under way at any time within their disk, and observed parameters integrated over the whole galaxy are an ensemble average across all phases of these episodes.
3.1.3 IRAS Colors
Mid- and far-infrared color ratios describe the shape of the dust emission at those wavelengths. To first order, the spectra of normal galaxies are organized into a single family of curves, manifested as a linear locus that galaxies occupy in the IRAS color-color diagram (Helou 1986). This diagram was quite surprising at first look, since it implies that the spectrum becomes cooler when judged by the mid-infrared R(12,25)= color as it gets warmer in the far-infrared color ratio R(60,100)= (Figure 2). It turns out that this behavior results from the interplay of two spectral components: blackbody-like emission from classical grains in temperature equilibrium mostly at the longer wavelengths, and relatively fixed-shape mid-infrared emission from tiny grains with a few hundred atoms or less, intermittently heated by single photon events (more in §4.2).
The seqence of infrared colors in Figure 2 was clearly associated with a progression towards greater dust-heating intensity, as illustrated by the progression of colors in the California Nebula as one approaches the heating star (Boulanger et al. 1988). The cool end of the color sequence corresponds to cool diffuse HI medium and to quiescent molecular clouds, whereas the warm end corresponds to the colors of HII regions, star-bursts and galaxies with high IR/B ratios and higher infrared luminosity. It is thus natural to associate the color progression with a sequence of star formation activity in galaxies, signalling in simplest terms an increase of the fraction of traceable to young stars (Helou 1986; §3.4)
The span of this activity sequence corresponds to a significant shift in the infrared specturm. In the coolest spectra, the peak in is at ; it shifts to or shorter in the warmest galaxies. However, in spite of their usefulness as indicators of ISM activity, the color ratios derived from IRAS data are useless for deriving dust temperature, which would then be used to derive a dust mass. The infrared spectra of galaxies are a weighted mean over a broad range of environments in which dust emission arises, and are driven far from blackbody temperatures by non-equilibrium emission from tiny grains which fluctuate between near zero K and high excitation by single photons (§3.4 and §4.2).
3.1.4 Other Estimators
Of many other parameters used in analyzing the empirical properties of galaxies from IRAS data, only two are shown here, for illustration rather than completeness. In using such estimators, one should be aware of the assumptions that enter into relating them to specific physical quantities, and estimate the uncertainties resulting from the inaccuracy of the assumptions in addition to the inherent measurement uncertainty.
The ratio of to the HI line flux has been used as an indicator of the dust-to-gas ratio. This interpretation however works only in very broad terms when comparing galaxies, since several factors other than dust to gas ratio affect the parameter (Helou 1985). For instance, the 100-to-HI ratio scales at least linearly with heating intensity, and depends on the assumed ratio of atomic to molecular hydrogen, as well as on the fraction of HI-related dust which is heated sufficiently to emit at 100, as opposed to dust in an extended HI envelope which remains cold enough as to be irrelevant at 100. This estimator works better locally within galaxy disks as a ratio of surface brightness at 100 and in HI as opposed to a global parameter (Dale et al. 1999). See Melisse & Israel (1994) for an interesting analysis.
The ratio of FIR flux to CO flux has been used as a measure of star formation efficiency, in the context of interpreting as a measure of star formation rate, and as a measure of the gas mass available for star formation. The inverse quantity can also be interpreted as an indicator of how long the current star formation rate can be sustained by the system. The caution here is that this estimator is useful only to the extent allowed by the uncertainties in interpreting and as just stated. in particular traces CO rather than total mass, and includes a significant dependence on the CO excitation conditions, as well as optical depth effects (Maloney & Black 1988, Aalto et al. 1994).
It is clear that much caution needs to be exercised in using all these estimators. Using several simultaneously helps in narrowing down the uncertainties of interpretation. For example, Knapp et al. (1987) combined /F(HI) with /F(CO) to trace the origin of the infrared emission. The discussion above illustrates the importance to the study of normal galaxies of understanding ISM physics and star formation processes on scales from a parsec to a kpc. This understanding must be derived from empirical and physical modeling studies of the Milky Way and Local Group galaxies, at the best available spatial and spectral resolution.
3.2 Correlations
Correlative analysis is a commonly used tool in the study of normal galaxies, and provides a more powerful tool than analysis of individual parameters, as illustrated in §3.1.4. Correlations however may be easier to establish than to interpret correctly. Many correlations are well known between various indicators of star formation activity, for instance IR/B, R(60,100) and are all positively correlated, to an extent that varies with the sample used (Soifer & Neugebauer 1991; Bothun et al. 1989). In principle these correlations contain information on geometry and physical parameters such as density and heating intensity, and on the manner in which star formation affects these parameters, is affected by them, and whether there are balancing forces. In practice however, it can be very difficult to derive such inferences.
Particularly easy to generate are correlations between extensive parameters, those which scale with the extent of a system. Luminosity is such an extensive parameter, scaling with the square of the distance to the galaxy, as opposed to color ratio for instance, which is distance independent. Correlations between extensive parameters are of limited interest because they tend to be exaggerated by the distance scaling, since errors on the distance will affect all such estimators equally, reinforcing the appearance of a positive correlation. Such correlations are also exaggerated by the spread of system sizes, suggesting great significance, whereas the main information content is that all extensive quantities tend to be greater in larger systems. The accepted procedure to avoid such vacuous correlations is to normalize extensive quantities by a system size parameter such as luminosity or mass, thereby reducing as many parameters as possible to distance-independent expressions. Examples of correlations and their interpretation appear in §3.3 and in §5.
3.3 The Infrared-Radio Connection
The tightest and most universal correlation known among galaxy fluxes connects the FIR emission from dust heated by stars with the non-thermal radio emission in the range from 2 to 50 cm, which is known to be synchrotron radiation from trapped in the interstellar magnetic field. This tightest of correlations is also the most puzzling. First, because of the indirect connection between the two mechanisms and populations of emitters, and the many parameters involved in producing the luminosities at the two wavelengths, such as current stellar population properties, dust optical depth, magnetic field strength, and acceleration and escape mechanisms. Secondly, surprising because of the large difference between the two luminosities; the ratio between the two bands is about , with a dispersion of about 50%. See reviews by Helou (1991) and Condon (1992).
The first mention of a close relation between far infrared and radio emission appeared as soon as the relevant data became available. Rickard and Harvey (1984) pointed out a strong correlation in a sample of 30 late type galaxies between the central emission at 20 cm and the emission in the 40 to 160 m spectral range. They related the correlation to star formation activity, and assumed the non-thermal radio emission to be dominated by supernova remnants, as predicted by Harwit and Pacini (1975). Rickard and Harvey (1984) were puzzled however by indications that the same correlation applied to the disk emission, because that would imply cooperation between the magnetic field , the interstellar gas density , and the density of . Since 1984, the vastly superior data returned by the VLA and IRAS have placed the correlation on a far more solid empirical footing without changing the basic facts. The situation on the side of interpretation however has improved more slowly, and a consensus has yet to emerge as to the physical significance of this correlation.
The global correlation was noticed early on in the IRAS data by Dickey and Salpeter (1984), then independently established by de Jong et al. (1985) using a sample of IRAS sources selected from the early mission returns, and by Helou, Soifer and Rowan-Robinson (1985) using an optically selected list of galaxies in the Virgo cluster and in the field. Regardless of the sample selection criteria, the ratio of infrared to radio in samples of star forming galaxies displays an intrinsic population dispersion of 50% or less (Helou, Soifer and Rowan-Robinson 1985; Sanders and Mirabel 1985; Condon and Broderick 1988; Wunderlich and Klein 1988; Unger et al. 1989) over four decades in luminosity, though non-linearities have been claimed, with the radio increasing faster than the infrared power (Cox et al. 1988; Menon 1991). The correlation has been shown to hold at high redshifts (e.g. Karoji, Dennefeld and Ukita (1985), Hacking et al. 1989) and has become an accepted property of all star forming galaxies (Condon 1992).
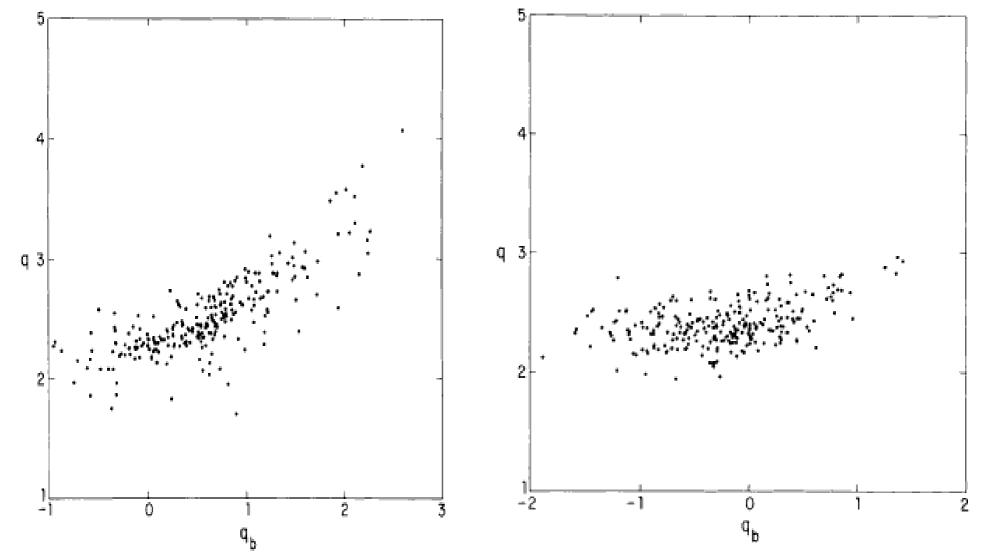
A definitive empirical treatment of the correlation was published by Condon, Anderson & Helou (1991), showing that it is asymptotically linear as the ratio of radio-to-visible, or equivalently of infrared-to-visible, increases, so that the “true” correlation is evident when the system is powered by young stars (Figure 3; see also Xu 1990). This happens consistently for galaxies with infrared-to-visible luminosity ratios greater than , which are still relatively optically thin galaxies. For galaxies less active in star formation, rises slowly above the standard correlation value. Within galaxy disks, the infrared emission is clearly more centrally peaked than the radio emission (Marsh & Helou 1998; Marsh & Helou 1995; Bicay & Helou 1990; Rice et al. 1990; Beck & Golla 1988; Wainscoat et al. 1987).
The theoretical understanding of this correlation is still imperfect. The physical explanation needs to invoke a two-part argument, namely a luminosity balance to explain optically thick systems, and a filtering match to explain optically thin systems. In an optically thick galaxy, all dust-heating radiation is re-radiated in the infrared on the one hand, and all created are trapped by the magnetic fields long enough for their available energy to dissipate as synchrotron luminosity. In this case, linking the dust-heating luminosity and the luminosity is sufficient to produce the observed correlation. This linkage is achieved because stars more massive than dominate the dust heating and produce Type II supernovae whose shocks accelerate cosmic rays including (Völk 1989). Condon (1992) has shown that the ratio of heating to luminosities is not very sensitive to upper mass cut-off of the Initial Mass Function (IMF), nor to age of starburst. See for historical interest also Lequeux (1971), Klein (1982) and Kennicutt (1983).
For optically thin galaxies, the effective dust optical depth of the galaxy to heating radiation must match its efficiency at extracting synchrotron radiation from . Helou & Bicay (1993) presented a model which achieves that match by assuming simple connections among physical parameters in the ISM, most importantly between the density of the medium and the magnetic field intensity. The model takes into consideration geometry of dust and stars and magnetic field, diffusion, radiative decay and escape of , and develops a picture where the radio disk is a smeared version of the infrared disk, the smearing being greater for more transparent disks. This model was found subsequently to be consistent with the observed details of the infrared-radio correlation within disks of galaxies (Marsh & Helou 1998). However, models for the physics underlying the correlation remain sufficiently complex that other mechanisms for the radio emission have been proposed because they provide closer connection to the infrared (e.g., Harwit in this volume).
3.4 The “Two-Component Model”
A “two-component model” is any representation of the spread of properties of a system as the result of the superposition of two components whose properties define the extremes of that spread. Such a model was invoked to explain the IRAS color-color diagram, describing normal galaxies as a linear combination of a quiescent component and a star-forming component, whose mixing ratio determines the colors of a given system (Helou 1986). The FIR-cold, “cirrus-like” component is supposed to arise primarily from low density, low radiation intensity quiescent regions heated primarily though not exclusively by older stars. The FIR-warm “active” component corresponds to dust heated in the vicinity of star-forming regions. Each of these components has its own luminosity and effective optical depth, and one could in principle solve for at least some of these quantities in any given galaxy with sufficient data. The infrared luminosity and optical depth of the active component combine to yield the heating luminosity in star forming regions, and therefore the star formation rate. This type of decomposition is mostly morphological, and particularly useful for nearby, well resolved galaxies such as M31 (Xu & Helou 1996). Note the similar but lower dynamic range decomposition proposed by Larson & Tinsley (1978) using the visible colors U-B and B-V.
A more physical and useful decomposition would be to represent the infrared luminosity as , where the first term reflects heating by ionizing stars, and the second heating by non-ionizing stars. The very existence of has been challenged by Devereux & Young (1990, 1992, and subsequent papers). Their arguments however are critically dependent on very uncertain assumptions about the upper mass cut-off of the stellar mass function in galaxies, and can therefore be easily dismissed. Furthermore, detailed studies of nearby galaxies prove that can contribute more than half (Walterbos et al. 1987; Rice et al. 1990; Rand et al. 1992; Xu & Helou 1996). Smith et al. (1991) show in NGC 4736 a striking example of the infrared emission from the nuclear region being dominated by , and surrounded by a star forming ring whose emission is dominated by .
How can the mixing ratio of the two components in this physical decomposition be estimated? Given its definition, the best indicator would be a measure of the hydrogen recombination rate and thus of the total ionizing flux in the system, preferably obtained from a long-wavelength transition such as Br to avoid extinction effects. That would determine the amount of ionizing flux and the total stellar luminosity, from which the dust heating could be estimated, yielding . Another approach to estimating the mixing ratio is offered by the infrared-radio correlation. Because of the close coincidence between the lower mass limit for ionizing stars , and the lower mass limit for supernova-capable stars , one could associate with the radio-loud component and thus use as an index to /.
In any case, galaxies at the extremes of the / can be readily identified since parameters such as IR/B, L(FIR)/L(HI), IRAS colors or also approach their extreme values in such galaxies. More detailed modeling as in papers mentioned earlier might be needed to estimate the mixing ratio in specific galaxies. On the other hand, infrared luminosity and morphology would be poor indicators of a galaxy’s position on that mixing ratio scale.
The two-component model proposes a simple picture where the infrared properties of a galaxy are determined by the mixing ratio /, and where each of these infrared components results from a heating luminosity and a corresponding optical depth. While the mixing ratio in a given galaxy may be quite uncertain, one can select samples of galaxies for statistical analysis where this ratio is biased towards or . Studies of the star formation rate in galaxies should use samples biased towards high mixing ratios of ionizing to non-ionizing luminosities, to support the simple assumption that L(IR) is a good measure of the star formation rate. Infrared selected samples such as the IRAS Bright Galaxy Sample (Soifer et al. 1989) are populated by galaxies dominated by , and comprise objects dominated by . Objects with high mixing ratios also tend to have high IR/B ratios, since the optical depth associated with star formation naturally tends to be quite elevated. On the other hand, studies aimed at the structure of stars and the ISM in galaxies should use broader samples, such as optically selected or volume-limited samples. Optically selected samples such as one derived from the Uppsala Galaxy Catalogue (Bothun et al. 1989) have 40 to 50% of galaxies dominated by and 20 to 25% dominated by . Volume-limited or cluster samples may be even richer in quiescent galaxies. In galaxies with low mixing ratios, the optical depths are harder to estimate, but remain smaller than unity in general.
4 ISO RESHAPES THE DUST CONTINUUM
In assessing the impact of ISO on our knowledge of the continuum emission from galaxies, the most exciting developments to date have touched the mid-infrared, as might be expected from ISO’s substantial gains in sensitivity and spatial resolution at those wavelengths. Gains at the longer wavelengths are more subtle.
First, the various surveys conducted by ISO are reviewed, then new results in the mid-infrared spectral range are described, in the areas of spectro-photometry and broad-band colors, and implications for the overall spectral energy distribution are mentioned. Finally, spatially resolved studies of galaxies at wavelengths available to ISO are presented.
4.1 ISO Surveys of Galaxies
While ISO was an observatory rather than a survey mission, many surveys were carried out using various capabilities of its versatile payload. Some prominent surveys that concern normal galaxies either directly or indirectly are listed below. This is by no means an exhaustive list, especially since most ISO data have yet to be published.
-
1.
Mid-infrared maps of nearby galaxies were obtained under the ISO-CAM (C. Césarsky et al. 1996) guaranteed time (GT) program, targeting large angular-size galaxies in various categories, such as early-type, spirals barred and non-barred, dwarf irregulars, and active (Vigroux 1997). There were also surveys of galaxies in Virgo, Coma and other clusters. All galaxies were surveyed in the LW2 (6.75) and LW3 (15) filters, and some in other filters within the 3 to 18 wavelength range of ISO-CAM. In addition, several were observed with the Circular Variable Filter (CVF), which yields images at a spectral resolution of about 20 over most of the same wavelength range. These data were taken mostly with pixels, with an effective resolution of 7 to half-maximum width.
-
2.
Far-infrared spectral surveys were carried out under the GT program of the ISO-LWS (Clegg et al. 1996), most notably for a sample of infrared-bright galaxies, meaning those with a flux density greater than 50 Jy at 60, and of ultra-luminous galaxies (Fischer et al. , 1999). Most objects were observed with a LWS low-resolution full spectral scan covering 45 to .
-
3.
Far-infrared maps of well-resolved nearby galaxies were obtained under the ISO-PHOT (Lemke et al. 1996) GT program at 60, 100 and , most notably of M31, M33 and M101.
-
4.
Photometry at was also carried out under the ISO-PHOT GT program for several samples, including 75 bright (B12 mag) galaxies from the Revised Shapley-Ames Catalog, and selected objects in the Virgo Cluster. These samples were observed (PI R. Joseph) at 60, 100 and 175, as well as 12 (ISO-CAM filter LW10), with additional data collected from the ground in the near-infrared and the submm. The purpose was to extend the spectral energy distribution, look for cold dust, and investigate nuclear activity.
-
5.
The surveys above were coordinated by J. Lequeux, resulting in several coherent data sets of great interest to normal galaxy studies. The imaging with CAM at 6.75 and 15 sampled galaxies at different distances, from the Magellanic Clouds out to the Virgo Cluster, under programs ‘‘CAMSPIR’’ and ‘‘VIRGO’’; program ‘‘CAMSFR’’ imaged star-forming regions at additional wavelengths, and with the CAM-CVF mode. In Virgo, at least thirty galaxies were imaged with CAM, and measured with PHOT at , while their CII line was targeted with LWS (PI K. Leech).
-
6.
Open time projects included several galaxy surveys, such as the Knapp et al. (1996) study of early type galaxies, the Lu et al. study of infrared-cold galaxies, and the Metcalfe et al. (1996) BCD/Irr survey.
-
7.
The ISO Key Project on the Interstellar Medium of Normal Galaxies (Helou et al. 1996) under NASA GT collected data on a set of sixty galaxies that explore the full range of morphology, luminosity, infrared-to-blue ratio and far-infrared color among star-forming galaxies. These sixty objects were selected to be small in their IRAS emission size compared to the LWS beam and the ISO-CAM field of view, so as to allow studies of their global properties. In addition, nine nearby galaxies were mapped to the extent possible, including NGC 6946, NGC 1313, IC 10, and parts of M 101. For most galaxies, maps were obtained at 7 and with ISO-CAM, spectro-photometry was obtained with ISO-PHOT-S between 3 and , and far-infrared fine-structure lines were targeted with ISO-LWS, attempting to measure as many as possible of the following lines, in the order listed: CII , OI , NII , OIII , NIII , OIII , NII .
-
8.
The ISO-PHOT Serendipity Survey gathered data during satellite slews between target observations with the channel. By the end of the mission, data had been collected over of slew track, with an estimated 4,000 galaxies detected (Stickel et al. 1998). This data set will be a unique source of far-infrared fluxes for thousands of galaxies with IRAS detections at Jy.
-
9.
By its nature as an observatory-class mission, ISO has generated a rich archive containing all the observations of individual galaxies, groups, or clusters of galaxies investigated by various observers for specific questions. This collection constitutes a de-facto survey of unique or peculiar objects from which one could learn much about the less exotic cases (e.g. Smith 1998; Smith & Madden 1997; Lu et al. 1996; Jarrett et al. 1999; Valentijn et al. 1996; Xu et al. 1999). Many useful survey samples can also be constructed after the fact by selecting objects out of the ISO archive once it becomes available in the summer of 1999.
Though not addressed directly in this review, ground-based infrared surveys will make fundamental contributions to our view of normal galaxies, especially the Two-Micron All-Sky Survey (2MASS, Skrutskie et al. 1999) and Deep European Near-Infrared Survey (DENIS, Epchtein et al. 1999), Apart from these large systematic surveys, several near-infrared imaging surveys of nearby galaxies are already revealing some surprising results. Grauer & Rieke (1998) for instance demonstrate that spiral arms are almost as contrasted in the K band as they are in the B band. See also Terndrup et al. (1994).
4.2 Mid-Infrared Spectra
In the integrated spectra of galaxies, the mid-infrared marks the transition from emission dominated by stellar photospheres to re-radiation by interstellar dust. ISO has shown the details of this transition for the first time by providing continuous coverage, and filling in some crucial details as discussed in this and the next two sections. The relevant data were acquired with ISO-PHOT, PHT-S module from 2.5 to 5 and from 5.7 to 11.6 (Lemke et al. 1996); with ISO-CAM in the CVF (Circular Variable Filter) mode from 5 to 16.5 (C. Césarsky et al. 1996); and with SWS from 2.5 to 45 (de Graauw et al. 1996).
The transition from stellar to interstellar emission is well illustrated by the spectra of Virgo Cluster galaxies collected by Boselli et al. (1998). Its precise location and therefore the interpretation to attach to mid-infrared fluxes can be parametrized by a ratio such as IR/B (§3.1.2). Interstellar dust emission takes over by 5when this ratio exceeds 0.5, and at shorter wavelengths for higher ratios. As might be expected, Elliptical galaxies are dominated by stellar emission, both photospheric and from circumstellar dust shells, and therefore provide the templates that one subtracts to isolate the interstellar emission component in Spiral galaxies (Boselli, Lequeux & Contursi 1997; Madden, Vigroux & Sauvage 1997). In addition, ISO sensitivity has allowed us to study the small amounts of ISM contained in Elliptical galaxies, and to look into differences with the ISM of Spirals (Knapp et al. 1996; Fich et al. 1999, Madden et al. 1999, Malhotra et al. 1999; note also the study of E+A galaxies in the Coma Cluster by Quillen et al. 1999).
4.2.1 The Aromatic Features
IRAS data had already indicated (Beichman 1987; Puget & Léger 1989; Boulanger & Cox in this volume) that the mid-infrared emission from the ISM was dominated by small fluctutating grains and Aromatic Features in Emission (AFE). ISO has not only established into fact what had been hypothesis, but is also allowing us to address quantitatively the mid-infrared energy budget across various emission components, and to investigate the variation of this budget from galaxy to galaxy. ISO data are generally consistent with older data from ground observations, including early M82 spectra by Willner et al. (1977), ground-based surveys (Roche et al. 1991), and IRAS-LRS data (Cohen & Volk 1989).
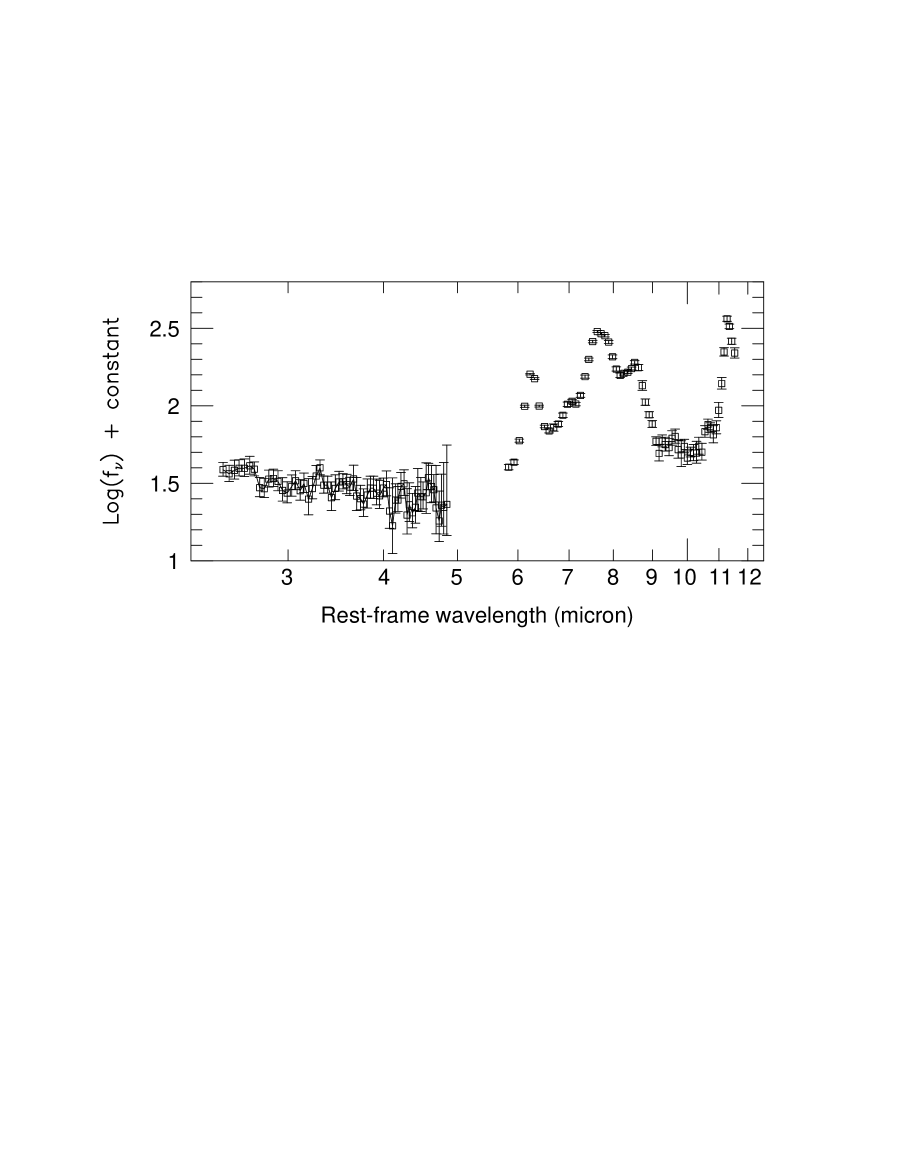
The AFE appear in two main groups, one stretching from 5.5 to 9, with peaks at 6.2, 7.7 and 8.6, and the other one starting at 11 and extending to 12.5 (Figure 4; Lu et al. 1999; Helou et al. 2000). The shape and relative strengths of the features are quite similar to “Type A sources” which are the most common non-stellar objects in the Milky Way: reflection nebulae, planetary nebulae, molecular clouds, diffuse atomic clouds, and HII region surroundings (Geballe 1997, Tokunaga 1997, and references therein). Quantitatively similar spectra have been reported from spectroscopic observations with PHT-S, ISO-CAM CVF or ISO-SWS on a variety of Galactic sources (Roelfsema et al. 1996; Verstraete et al. 1996; Césarsky et al. 1996a; 1996b; Boulanger et al. 1996; Mattila et al. 1996; Beintema et al. 1996; Uchida, Sellgren & Werner 1998) and a number of galaxies (Boulade et al. 1996; Vigroux et al. 1996; Acosta-Pulido et al. 1996; Metcalfe et al. 1996). ISO-SWS spectra with greater spectral resolution show AFEs with the same shape, a clear indication that they are spectrally resolved by PHT-S data at a resolution of .
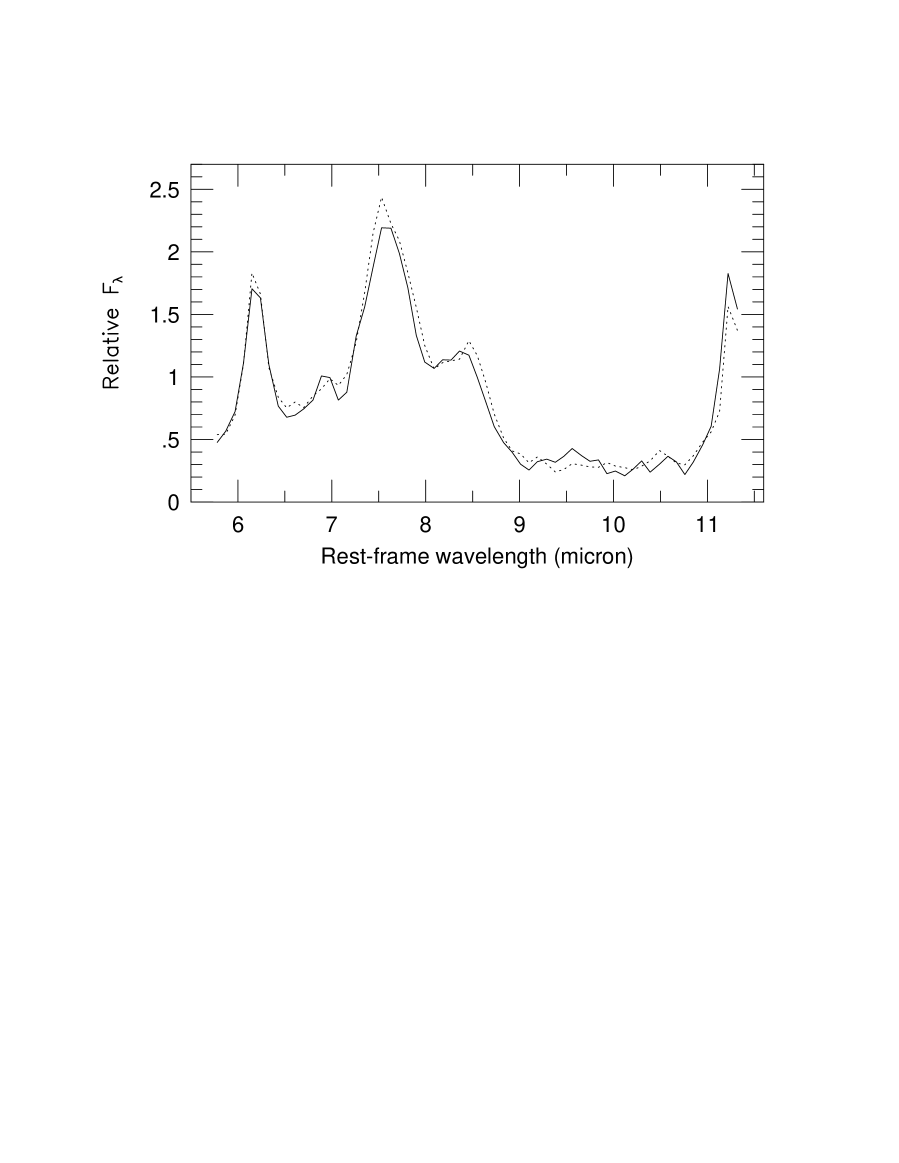
There is good evidence linking the AFE to Polycyclic Aromatic Hydrocarbons (PAH), but no rigorous spectral identification of specific molecules (Tielens 1999; Puget & Léger 1989; Allamandola et al. 1989). It is generally agreed that the emitters are small structures, no more than a few hundred atoms, transiently excited to high energy levels by single photons. The relative fluxes in individual AFE, and the general shape of the specturm, depend very weakly on galaxy parameters such as the far-infrared colors (Figure 5). This is direct evidence that the emitting particles are not in thermal equilibrium. As an estimate of the AFE relative strength, the integrals from 5.8 to 6.6, 7.2 to 8.2, and 8.2 to 9.3 are in the ratio 1:2:1 in the PHT-S spectra obtained under the Key Project on Normal Galaxies (Helou et al. 2000). The strongest detectable variation in the same data set is a slightly stronger 11.3AFE in the colder galaxies (Lu et al. 1999). Since this feature is linked primarily to neutral PAHs as opposed to the shorter wavelength features which have a strong ionized PAH contribution (Tielens, 1999), one is tempted to interpret this trend as a result of the more active galaxies having a greater contribution to their luminosity originating in regions heated by harder radiation fields.
An important consequence of the invariant shape of the spectrum up to 11 , even as the infrared-to-blue ratio reaches high values, is that the 10 trough is best interpreted as a gap between AFE rather than a silicate absorption feature. An absorption feature would become more pronounced in galaxies with larger infrared-to-blue ratios, and that is not observed (Sturm et al. 2000).
The fraction of starlight processed through AFE has been under debate since the IRAS mission (Helou, Ryter & Soifer 1991), and can now be directly estimated using the new ISO data for the sample described above. AFE account for about 65% of the total power within the 3 to 13 range, and about 90% of the total power in the 6 to 13 range. The AFE between 6 and 13 carry 25 to 30% of L(FIR) in quiescent galaxies, or 12% of the total infrared dust luminosity between 3 and 1 mm, whereas all ISM emission at comes up to % of the total dust emission. The ratio AFE-to-FIR gradually drops to less than 10% in the most actively star forming galaxies, i.e. those with the greatest L(IR)/L(B) ratio or IRAS color , following the trend already noted in Helou, Ryter & Soifer (1991). Boselli et al. (1997 and 1998) have interpreted similar trends as evidence for the destruction of AFE carriers in more intense radiation fields. The 3.3 feature carries about 0.5% of the total AFE luminosity longwards of 5 , a significantly smaller value than that reported by Willner et al. (1982) for M 82.
4.2.2 The Mid-Infrared Continuum
In addition to the AFE, there is clear emission bridging between them, even in the 10 trough. This emission may well be related to the AFE carriers, since its shape is constant, scaling with the AFE strength. Boulanger et al. (1998) have discussed this emission in terms of Lorentzian wings to the AFE.
Less energetic but more surprising is the continuum detected in ISO-PHT-S data (Helou et al. 2000) shortward of 5 (see for instance the model spectra of Désert et al. 1990). This unexpectedly strong 4 continuum flux density is positively correlated with the AFE flux, strong evidence linking it to dust rather than stellar photospheres. It appears to follow a power law between 3 and 5, with an uncertainty of 0.15 on the power-law index. However, the flux density around 10 is three times higher than the continuum level extrapolated to 10 from the spectral shape between 3 and 5, leaving open the nature of the connection between the 4 continuum and the carriers of the AFE. Bernard et al. (1994) have reported evidence for continuum emission from the Milky Way ISM in COBE-DIRBE broad-band data at these wavelengths, with comparable amplitude; ISO however provides the first clear detection of the spectral shape of the emission.
Extrapolating the continuum from the 3 to 5 range out to longer wavelengths, and assuming the AFE are superposed on it, one finds that the continuum contributes about a third of the luminosity between 3 and 13, and 10% between 6 and 13, the balance being due to AFE and associated bridge emission. Against this extrapolated continuum, the AFE, defined again as the emission from 5.8 to 6.6, 7.2 to 8.2, and 8.2 to 9.3, would have equivalent widths of about 4 or Hz, 18 or Hz, and 13 or Hz, respectively (Helou et al. 2000).
The natural explanation for this continuum is a population of small grains transiently heated by single photons to apparent temperatures near K. Such a population was invoked by Sellgren et al. (1984) to explain the 3 emission in reflection nebulae, and similar populations by other authors to explain the IRAS 12 emission in the diffuse medium (e.g. Boulanger et al. 1988). Small particles with ten to a hundred atoms have sufficiently small heat capacities that a single UV photon can easily propel them to 1000 K equivalent temperature (Draine & Anderson 1985). Such a population is a natural extension of the AFE carriers, though it is not clear from these data whether it is truly distinct, or whether the smooth continuum is simply the non-resonant emission from the AFE carriers. While the current data cannot rule out other contributions to this continuum component, the shape does rule out a simple extension of the photospheric emission from main sequence stars. Red supergiants and Asymptotic Giant Branch stars may contribute to the continuum in this region but cannot dominate it, because their contribution would not correlate with AFE from the ISM, and cannot match the shape of a spectrum with .
4.2.3 High-Redshift Applications
Since the spectral signature in Figure 4 applies to the majority of star-forming galaxies, it can be used as a template to obtain redshifts of highly extincted galaxies with the next infrared observatory, NASA’s SIRTF (Space InfraRed Telescope Facility). For instance, a galaxy at a redshift z=3 with a flux density average of 0.5 mJy in the range and a total infrared luminosity comparable to Mkn 231 at would be detected by the SIRTF IRS (Infrared Spectrometer; Roellig et al. 1998) in roughly 1000 seconds of integration (D.W. Weedman, private communication).
In surveys with fixed spectral bands, the Aromatic Features will result in a unique K-correction as redshift takes them in and out of the bands. The detection probability would be enhanced or reduced for certain redshift intervals, causing ripples in source counts as a function of flux density; Xu et al. (1998) have modelled this effect for NASA’s WIRE (Wide-Field InfraRed Explorer; Hacking et al. 1999) mission. However, this effect has already been manifested with ISO, in deep 15imaging data in the direction of galaxy clusters. These observations were aimed at detecting background objects boosted by gravitational lensing, thus allowing the survey to penetrate further in space and time. In the Barvainis et al. (1999) survey, one out of every five galaxies detected in the direction of each of Abell 2218 and Abell 2219 turns out to be at a reshift near 1, the others being at redshifts of 0.3 or less. A redshift of 1 places the main AFE clump squarely in the 15band, enhancing the probability of detection. Similar results from a more extensive survey are reported by Metcalfe et al. (1999), and by Fadda et al. (1999).
As the early Universe opens up for mid-infrared exploration, the properties of low metallicity star-forming galaxies become more relevant as a template for high-redshift galaxies. ISO has provided the data for constructing such templates, both from studies of low metallicity dwarf galaxies (Sauvage & Thuan 1999), and the study of nearby galaxy disks with significant metallicity gradients such as M 101 (Vigroux et al. 1999).
4.2.4 Exceptions
The “standard” spectra described above characterize the integrated emission from normal galaxies, but exceptions arise at extreme conditions, and are easiest to detect in specific ISM phases of individual galaxies. At the smallest scales in the most intense parts of HII regions, Contursi (1998), Tran (1998) and Césarsky (1996b) report spectra which depart significantly from the standard ones in the location and strength of features. Similarly distorted spectra are also observed in NGC 4418 (Lu et al. 2000), and close to the Active Nucleus of Cen A (Vigroux et al. 1999). This radical transformation in the spectrum must then result from extremely UV-rich heating radiation, and most likely reflects severe modification of the emitting grains, including the destruction of Aromatic Feature carriers. Significant distortions in the spectrum driven by a rising continuum but without radical changes in the Aromatic Features have also been reported by Lutz et al. (1998) in extremely active galaxies. The mid-infrared spectra of starbursts are relatively “standard”, whereas galaxies with an active Black Hole nucleus (AGN) have a continuum rising towards longer wavelengths with insignificant AFE. Ultra-Luminous Infrared Galaxies show intermediate spectra, modified in addition by large optical depths (Genzel et al. 1998; Laurent et al. 1999).
At the other end of the heating sequence, Césarsky et al. (1999) report that the 5–9AFE are missing from the emission of the bulge and of the quiet parts of the bright infrared ring in M 31. The 11.3 and 12.7features are present, perhaps a result of their originating primarily on neutral PAHs. The relatively weak and UV-poor heating radiation in these parts of M 31 cannot alone explain the absence of Aromatic Features, for other studies (e.g. Uchida et al. 1998, Uchida et al. 1999) show that photons of a few eV are sufficient to generate the standard spectrum. It would appear that the dust properties in M31 are again modified, this time by prolonged shielding from UV processing in the astration cycle. Additional evidence of abnormal ISM properties in the same regions are found by Pagani et al. (2000) in their study of the broad-band mid-infrared emission.
Another peculiar exception is provided by Sauvage & Thuan (1999) in SBS 0335-052, a blue compact dwarf with a metallicity about 1/40 solar. No AFE are detected here, and the spectrum appears best fit by highly extincted blackbody emission. The authors propose the early chemical age of the system as the most likely reason behind the absence of the AFE, though one cannot rule out the possibility that the UV radiation from the intense star formation episode also plays a role in the destruction of the Aromatic Feature carriers. If this spectrum does indeed characterize all low metallicity objects, one would expect the “standard” spectrum to disappear gradually as a function of increasing redshift, thus making it harder to detect the Aromatic signature of dust and distinguish star formation from Black Hole activity as the energy source in the earliest systems.
4.3 The ISO-IRAS Color Diagram
A large number of extragalactic broad-band measurements was collected by ISOCAM at wavelengths between 4 and 18, most frequently using the “LW2” band centered at 6.75, and the “LW3” band centered at 15. The LW2 filter was designed to capture mostly AFE emission, and LW3 was aimed at the continuum range beyond the bulk of the AFE, though it ends up with a small contribution from the 12.5feature. The 6.75-to-15 color ratio has emerged as an interesting diagnostic of the radiation environment. It remains relatively constant and near unity as the ISM of galaxies proceeds from quiescent to mildly active. As dust heating increases further, the 15 flux increases steeply compared to 6.75, pointing to a significant contribution by dust at color temperature , typical of a heating intensity up to times that of the diffuse interstellar radiation field in the local Milky Way (Figure 6; Helou et al. 1997; Helou 1999). While such a temperature could result from classical dust heated within or just outside HII regions, there is no decisive evidence as to the size of grains involved. It is simpler at this time to associate this component empirically with the observed emission spectrum of HII regions and their immediate surroundings (Tran 1998; Contursi 1998). This emission has severely depressed AFE, and is dominated by a steeply rising though not quite a blackbody continuum, consistent with mild fluctuations in grain temperatures, . This HII region hot dust component at becomes detectable in systems where the color temperature from the 60-to-100 ratio is only , demonstrating the broad distribution of dust temperatures within any galaxy. The combined data from ISO and IRAS on these systems are consistent with an extension of the “two-component model” of infrared emission (see §3.4 above) and demonstrate the fallacy of modeling the infrared spectra of galaxies as single temperature dust emission. The low 6.75-to-15 color ratio is associated with the active component, and combines in a variable proportion with a component with a 6.75-to-15 near unity. This color behavior was observed in the sample of galaxies used for the Key Project on normal galaxies (Helou et al. 1996, Silbermann et al. 1999), and confirmed in the sample of galaxies observed under ISOCAM Guaranteed Time (see Figure 1 in Vigroux et al. 1999). See also §4.4 below.
4.3.1 The Global Infrared Spectrum
Turning now to the long wavelength end of the spectrum, photometry at using ISO-PHOT is starting to constrain the distribution of dust temperatures at low heating levels, especially in nearby well resolved galaxies such as M31 (Haas et al. 1998, 1999), M51 or M101 (Hippelein et al. 1996), where cold dust dominates the luminosity. Similar analysis on more active galaxies is also under way (e.g. Klaas et al. 1997; Klaas, Haas & Schulz 1999) to obtain the best possible estimates of the total infrared emission and therefore of the dust mass. Alton et al. (1998) have reported that the emission is more extended at 200 than at shorter wavelengths in several galaxies. This result however hinges closely on a very precise knowledge of the beam shapes at various wavelengths, which was not yet achieved at the time of that publication.
A proper determination of the total infrared luminosity and the long-wavelength spectral shape in normal galaxies is critical to estimating the contribution of galaxies to the infrared and submm extragalactic background light, and thereby deriving the infrared term in the star formation history of the Universe. While work on the ISO-PHOT calibration continues, one could estimate an improved infrared spectral energy distribution by combining the mid-infrared results described above with existing IRAS data (Figure 7). Such a rough estimation is presented in Table 1 for several different levels of activity in galaxies, parametrized by the 60-to-100ratio. It should be noted that all information at in Table 1 is based on modeling IRAS data using a power-law distribution of dust mass as a function of heating intensity, and does not use any empirical constraint (Dale et al. 2000a; Helou et al. 2000). Table 1 illustrates the general trend, but also ignores variations in spectral shape at constant 60-to-100 ratio, including intrinsic scatter in the ratio of mid-infrared to far-infrared (Lu et al. 1999), and dispersion in the 25-to-60ratio. The 20 to 40range appears to show the most significant growth in fractional terms at the expense of the submillimeter as the activity level increases, suggesting that the continuum may be the best dust emission tracer of current star formation in galaxies. Even after ISO, our knowledge of the detailed shape of the spectrum at remains model-dependent, and may not improve significantly until the launch of SIRTF, and then of FIRST (Far infraRed and Submillimeter Telescope).
| F(3–5) | F(5–13) | F(13–20) | F(20–42) | F(42–122) | F(122–1100) | |
|---|---|---|---|---|---|---|
| 0.40 | 0.024 | 0.122 | 0.033 | 0.10 | 0.41 | 0.32 |
| 0.63 | 0.017 | 0.086 | 0.037 | 0.18 | 0.50 | 0.19 |
| 1.00 | 0.008 | 0.048 | 0.043 | 0.28 | 0.54 | 0.09 |
4.4 A Mid-Infrared Look Within Galaxies
ISO-CAM CVF studies between 5 and 17 are turning out to be powerful diagnostics of the radiation field within the disks of nearby galaxies, allowing us to disentangle the variations in heating intensity and hardness of interstellar radiation. The approach is to relate the intensity to the shape of the continuum, and the hardness to the ratios of ionic fine-structure lines (Tran 1998; Contursi 1998). See also the overview on ISOCAM studies of nearby galaxies by Vigroux et al. 1999, and the studies of NGC 891 by Le Coupanec et al. (1999) and by Mattila et al. (1999). Such studies are valuable in establishing the local relation between mid-infrared emission and the star formation intensity, thereby guiding the interpretation of the global fluxes.
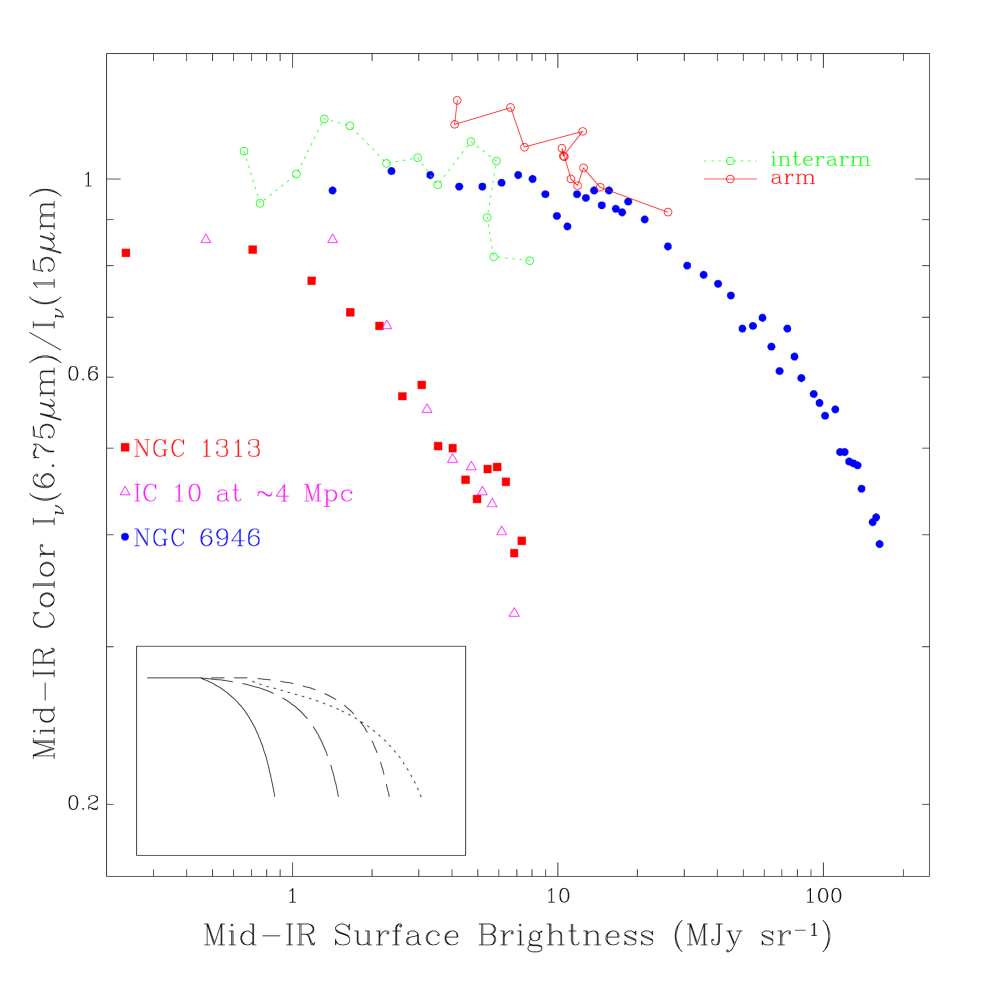
The ISOCAM images of galaxies show dust emission in nuclear regions, in the inner barred disk, outlining the spiral arms, and tracing the disk out to the Holmberg radius and beyond (Malhotra et al. 1996, Sauvage et al. 1996, Vigroux 1997, Smith 1998, Roussel et al. 1999, Dale et al. 2000b). There are clear color variations within spiral galaxies, some of which have not yet found satisfactory explanations (Helou et al. 1996; Tran 1998; Vigroux et al. 1999). Dale et al. (1999) describe behavior similar to the ISO-IRAS color diagram within the disks of three star forming galaxies, IC 10, NGC 1313, and NGC 6946, where the 6.75-to-15 color drops precipitously as the surface brightness exceeds a certain threshold. The point of inflexion in the color curve occurs at a surface brightness which is a function of the dust column density, whereas the shape of the curve seems invariant, and may result from a rise in both the hardness and intensity of the heating radiation (Figure 8). Dale et al. discuss these findings in the context of a two-component model for the interstellar medium, suggesting that star formation intensity largely determines the mid-infrared surface brightness and colors within normal galaxy disks, whereas differences in dust column density are the primary drivers of mid-infrared surface brightness variations among galaxy disks.
Rouan et al. (1996), Block et al. (1997) and Smith (1998) have combined ISOCAM and Br images with other broad-band and line images to estimate star formation rates, ISM parameters, obscuration and dust properties. These studies again point to AFE carriers as a ubiquitous component of interstellar dust, to the likely destruction of these carriers by ionizing UV, and to dust heating in non-starburst disk galaxies being derived from both old stars and OB stars.
In M31, Pagani et al. (2000) demonstrate a very close correlation between mid-infrared emission at both 6.75 and 15and the distribution of neutral gas as traced by HI and CO maps. The correlation is poorer with ionized gas as traced by H, and poorest with UV emission, a result which they attribute to extinction. They conclude that AFE can be excited by visible and near-IR photons, the dominant dust heating vectors in this particular case, and therefore by older disk and bulge stars. They also find evidence that in this environment the AFE carriers are amorphous carbonaceous particles formed in the envelopes of carbon stars, and have not yet been graphitized by ultraviolet radiation.
5 A WALK IN THE LINE FOREST
The unfettered access to the infrared spectrum in space gave ISO a tremendous advantage in studying any infrared line in galaxies regardless of redshift, until the lines leave the window at high redshifts. The low thermal backgrounds of a cryogenic telescope in space allowed it to tackle much lower surface brightness sources. As a result, ISO extended the spectroscopic studies of starburst nuclei that the Kuiper Airborne Observatory (KAO) had carried out to the less intense star formation in normal galaxies. The spectrocopic capabilities of all four instruments were especially valuable tools in characterizing the interstellar gas and radiation field, and in constraining the overall energetics and star formation rate.
Many lines in the infrared range carry substantially more luminosity than the lines most studied from the ground and normally used for probing the non-ionized ISM. The HI 21 cm fine-structure line, popular because its flux can be safely assumed to be proportional to the total emitting HI mass, carries about . The CO pure rotational lines in the millimeter and submillimeter range (J=10, 21, 32, etc. at 2.3 mm, 1.15 mm, etc.) carry a few times . By contrast, the molecular hydrogen rotational lines discussed below carry a few times , and several of the infrared fine-structure lines such as CII, OI, SiII, or OIII carry to . They are thus by far more significant as a measure of the energetics of interstellar gas, and easy to detect at greater distances, making them valuable tools for probing the star formation process in the most distant, youngest galaxies.
5.1 Molecular Lines
One of the great achievements of ISO was the detection of the long-sought molecular hydrogen transitions from rotationally excited states, and the realization of their promise as accurate tracers of the H2 mass (e.g. Draine & Bertoldi 1999), allowing for the first time a direct gauge of the dominant phase of the star-forming ISM. Most of the H2 data were collected by the SWS (de Graauw et al. 1996), and their interpretation and analysis in the Milky Way is discussed by Cox & Boulanger elsewhere in this volume. Several of these lines, especially S(0), S(1) and S(2) were detected in galaxies early in the ISO mission, permitting a detailed discussion of the gas phase conditions and heating mechanisms, as in the study by Valentijn et al. (1996) of the nuclear star burst of NGC 6946. Because of their high excitation levels however, these lines tend to trace H2 warmer than , and are therefore easier to detect in the more intense star formation environments (Kunze et al. 1996; Kunze et al. 1999). Still, Valentijn et al. (1999) report the detection of H2 emission from the extended disk of the edge-on galaxy NGC 891. They detect S(0) and S(1) at eight positions, tracing the emission out to 12 kpc from the nucleus of the galaxy, and derive H2 temperature constraints and molecular mass estimates.
Hydroxyl (OH) was also detected in starburst galaxies, but in absorption rather than emission. A first report by Skinner et al. (1997) showed OH absorption at 35in the spectrum of Arp 220, and confirmed for the first time pumping by infrared photons as the excitation mechanism behind OH mega-masers. Bradford et al. (1999) report OH in absorption at 35, 53 and 119 in NGC 253, and resolve the line at 119 with the LWS Fabry-Pérot mode. They estimate total column and excitation temperatures for the OH, and constrain the geometry of the molecular material and its relationship to the infrared-emitting dust.
5.2 Fine-Structure Lines
Far-infrared fine structure lines, CII and OI in particular, have long been used for estimating density and radiation intensity in photo-dissociation regions (PDR) (e.g. Hollenbach & Tielens 1997), which are the interfaces between HII regions and molecular clouds. These dense ( or more), warm (), neutral media are preferentially cooled by CII because carbon is abundant, easy to ionize (IP=11.26 eV), and easy to excite (). At and , OI takes over as the main coolant, with its higher excitation threshold (). In PDRs, both transitions are excited predominantly by electrons which have been extracted from dust particles by ultraviolet photons usually assumed to have . This well known and studied photo-electric effect (Field, Goldsmith & Habing 1969; Hollenbach & Tielens 1997) is estimated to have a yield in an ISM illuminated by starlight. Traditionally, various line ratios and line-to-continuum ratios are used to constrain the main parameters of PDR regions, by comparison to calculations from models of slab PDRs. In such models, the emission is integrated along a line of sight sampling the PDR, starting at the HII region front, through the molecular cloud, and on towards the molecular cloud core, to the point where emission becomes negligible.
Just as CII and OI are important coolants of the neutral ISM, so are NII , OIII and , and NIII significant for HII regions. While ISO collected substantial data on these lines, they will not be discussed in any detail in this review because little has been published yet on this topic. It should be kept in mind however that CII can arise in HII regions as well as PDRs, and that complicates the interpretation of line ratios. Similarly, the continuum emission from dust will arise from a variety of media, complicating the interpretation of line-to-continuum ratios (§5.3).
ISO-LWS (Clegg et al. 1996) has provided a wealth of data, whose interpretation is creating controversy and challenging theoretical models. Using the Normal Galaxy Key Project sample, Malhotra et al. (1997) showed that while two thirds of normal galaxies have in the range , this ratio decreases on average as the 60-to-100 or the ratios increase, both indicating more active star formation (Figure 9). The same CII deficiency is also observed in ultra-luminous infrared galaxies such as Arp 220 (Luhman et al. 1998). Malhotra et al. linked this decrease to elevated heating intensities, which ionize grains and thereby reduce the photo-electric yield. They discussed other possible causes, such as self-absorption of [CII], heating by non-ionizing stars, or the influence of an AGN. Optical depth effects were dismissed because no deficiency trend is observed in [OI] even though it is expected to have greater optical depth than [CII]. The possibility of non-ionizing stars was dismissed since it required the most unlikely scenario that such stars would dominate the heating systematically in the most actively star forming galaxies, including objects such as Arp 220 (Fischer et al. 1999). Finally, since the normal galaxy sample was selected to avoid AGN, the latter are unlikely to be the sole reason behind the [CII] deficiency trend. Fischer et al. (1999) and Malhotra et al. (1999) give updated discussions of this topic, while Lord et al. (1999) and Unger et al. (1999) discuss PDR properties in NGC 4945 and Cen A.
The relation of the line luminosity to the total star formation rate in a galaxy has been debated just as vigorously as other infrared observables (Stacey 1991). One of the outstanding questions there has been the importance of low density HII regions as a source of emission. Stacey et al. (1999) present detailed maps of M 83 in several fine-structure lines, and address this question directly, estimating that 27% of the total emission may well originate in that diffuse component. This same contribution by diffuse PDRs is invoked by Pierini et al. (1999) in explaining the high -to-CO ratios in quiescent Virgo cluster galaxies. Using the same Virgo galaxies data, Leech et al. (1999) report a trend of decreasing /FIR ratios as galaxies become less active in star formation. Combining the results of Leech et al. with those of Malhotra et al. leads to a picture where /FIR rises by an order of magnitude as galaxies move away from complete quiescence, reaches a broad maximum for normal galaxies actively forming stars, then decreases again by more than an order of magnitude as galaxies begin to approach the extreme properties of starbursts.
5.3 Interpreting the PDR Lines
What could be behind this behavior? At the quiescent end, the relative lack of ionizing photons in the stellar spectrum could naturally explain the low values of /FIR. UV-poor heating would on one hand lower CII abundance, and on the other hand yield less energetic photo-electrons, so a less energetic CII excitation would be expected. At the starburst end, the extreme excitation conditions could generate lower photo-electric efficiency as proposed by Malhotra et al. (1998), and as detailed in the previous section.
While that picture is physically reasonable, there is evidence however favoring a different interpretation at least at the high excitation end of the sequence, namely that the relative drop in is due to a decrease in the concentration of the grains crucial for the photo-electric effect. It is well known (e.g. Hollenbach & Tielens 1997) that the smallest grains such as the carriers of AFE are responsible for the bulk of photo-electric yield in a PDR. Depletion of these carriers would decrease the coupling between radiation field and gas, and lead to weaker fine-structure line emission compared to total dust re-radiation. The evidence in question is that unlike /FIR, the ratio of to AFE flux does not decrease in normal galaxies with increasing activity (Helou et al. 2000). This suggests that the emissions from and AFE originate in the same regions of the ISM, so their ratio is dictated by the physics of the photo-electric effect and remains constant. On the other hand, and FIR originate from distinctly warmer and denser regions, so that the changing ratio /FIR, just like /, reflects the systematic shift in density distribution of the ISM as galaxies approach star-burst conditions.
At the high end of activity, the empirical evidence for decreased AFE carriers is quite clear (Helou, Ryter & Soifer 1991; Genzel et al. 1998), and the evidence is strong that they are destroyed by the intense UV radiation from massive stars. There is less empirical evidence however for a systematic lack of Aromatic grains at the low end of the excitation sequence. Perhaps the most interesting hints come from the detailed investigation of the mid-infrared emission by Césarsky et al. (1999) in M31. It is still a matter of debate whether AFE carriers condense out on larger grains and are re-extracted by exposure to UV radiation (Boulanger et al. 1990), or whether the AFE carriers emerge only as a result of the first photo-processing by UV light of newly formed amorphous carbon grains (Pagani et al. 2000).
Most of the interpretation of [CII] and [OI] line fluxes is done in the context of PDR theories and models, which provide the most powerful tools available. It should be recalled however that this context assumes implicitly that all observed fluxes in line and continuum originate in PDRs. The broadest definition of PDR, usually supported in model calculations, includes any non-ionized region heated by stellar photons. Thus defined, PDRs do provide all [OI] emission from galaxies, but not all [CII] or dust continuum. Indeed, both of the latter can have contributions from HII regions of all descriptions, from the compact to the diffuse, extended low density variety. Additional flux of either [CII] or continuum will throw off the ratios based on which PDR models derive density and heating intensity. One can mitigate the problem by estimating HII regions contributions based on the [NII] line for instance, and adjust the [CII] flux accordingly (Malhotra et al. 2000. See also §7.1).
6 MORE STUDIES
In addition to the topics covered above, the ISO archive will soon offer a wealth of data on a wide variety of extragalactic subjects affecting our understanding of normal galaxies. Studies in galaxy clusters and groups for instance have targeted the population of medium-distant clusters at z=0.1–0.3 (Lémonon et al. 1999, Fadda & Elbaz 1999; Metcalfe et al. 1999). Stickel et al. (1998) have reported the detection of intracluster dust in Coma at 200, and related it to the cooling flows revealed by X-ray observations, while Xu, Sulentic & Tuffs (1999) have studied intergalactic star formation in Stefan’s Quintet using mid-infrared data. Charmandaris et al. (1999) and Gallais et al. (1999) have taken a detailed look at some of the nearest interacting galaxy systems in order to study collisionally induced star formation.
Beichman et al. (1999) and Gilmore & Unavane (1998) report on deep searches for mid-infrared haloes around edge-on galaxies, and place upper limits on the contribution to the missing mass by low-mass stars. Jarrett et al. (1999) report on mid-infrared detection of a bridge of interstellar gas and magnetized plasma created between two galaxies after a collision which caused the two disks to pass through each other and entangle the interstellar media.
Observations of Local Group members allow detailed analysis of the ISM and star formation on the few parsec scale, and are a crucial stepping stone to understanding the integrated emission in more distant objects. Such detailed studies of HII and star formation regions, or of the stellar population in the Magellanic Clouds are reported by Comerón & Claes (1999), Henning et al. (1999), Loup et al. (1999), Missoulis et al. (1999), and Vermeij, van der Hulst & Baluteau (1999).
7 TOMORROW’S INFRARED GALAXIES
7.1 Challenges and Prospects
The two-component model approach is clearly an over-simplification of the complexities in a real system, representing what is almost certainly a continuous distribution over some parameter by a linear combination of the extremes. One challenge ahead is to formulate more realistic descriptions of star-forming galaxies, incorporating a distribution of ISM mass over the key parameters density, intensity and hardness of heating radiation. Additional parameters such as cosmic ray flux, metallicity, dust abundance and properties, or X-ray flux might be added as secondary parameters. From such a description, one would estimate observables as integrals over the phase space defined by the key parameters (see §2 above), and translate empirical properties of galaxies into constraints on the ISM properties.
A related challenge is to formulate a realistic description of the geometry of dust, gas and heating stars. The ISM appears clumpy on all scales, perhaps best described as fractal in its structure as evident from IRAS, HI or CO maps of emission (Falgarone & Phillips 1996). Detailed studies of nearby PDRs suggest substantial ultraviolet penetration far from the boundary of the HII region (Howe et al. 1991; see also discussion in § 2.1 of Hollenbach & Tielens 1997). Geometry may well be a critical factor in some of the observed properties of galaxies; it may well affect the averaging over regions and directions in ways that inject apparent simplicity in otherwise quite complex systems. Detailed models may be the only way to establish the role of geometry in normal galaxies.
Neglecting for now the complexities above, one can expect substantial progress in understanding normal galaxies by exploiting ISO data with new approaches. In addition to the powerful spectroscopic techniques offered by ISO, the improved spatial resolution of ISO-CAM should allow us to go beyond luminosity, and work with surface brightness in the infrared. This is a distance-independent quantity which can be measured and compared in nearby as well as distant galaxies, and combines information on the intensity of heating radiation and the column density of dust, and therefore might help us disentangle these two quantities using additional information from other observables. Some work along these lines based on IRAS data has been published (Wang & Helou 1994; Helou & Wang 1995; Meurer et al. 1997), but ISO data offer much better sensitivity and spatial resolution (Dale et al. 1999; Dale et al. 2000a).
With ISO data in hand, it should be possible to answer some basic questions about galaxies, deriving for instance an accurate star formation rate from a combination of observables, and attaching specific physical meaning to standard paramaters commonly used today, such as IRAS colors, line-to-continuum ratios, or infrared-to-blue ratios. More difficult but probably within reach of ISO data interpretation would be a means to distinguish between physical parameters and mixing ratios, so one can tell whether two galaxies differ because their PDRs are systematically different, or because they have a different mix of PDR, HII regions and molecular clouds.
7.2 Suggestions
The study of normal galaxies will remain exciting because of, and in spite of, the complexities and bewildering abundance of data and correlations. A few suggestions might help in navigating these complexities:
-
1.
In statistical studies, it is critical to understand the sample being used, its biases and limitations.
-
2.
The questions to pursue should be physical rather than statistical in nature. The latter will flow from the former, but should not overshadow them.
-
3.
Quantities studied, statistically or in detail, should have clear physical significance. Distance-independent “intensive” quantities are preferable to luminosities or similarly scaling extensive parameters.
-
4.
In constructing quantities from observables, one should avoid complex parameters with multiple built-in assumptions, such as dust mass which combines a flux with an uncertain color temperature taken to a power of 5 or so.
8 CONCLUSION
Normal galaxy studies with ISO have already yielded major progress beyond the knowledge of the IRAS era, improving dramatically our empirical understanding of mid-infrared spectra, mid-infrared images, the global spectral energy distribution and the far-infrared fine-structure lines. This progress has already led to rethinking plans for other surveys and missions addressing those observables.
ISO data are also re-shaping our physical understanding of galaxies: allowing for a better decomposition of the infrared luminosity from a combination of spectral energy distribution and imaging; providing narrower constraints on density and radiation intensity from analysis of fine-structure lines, surface brightness, and the spectral energy distribution; providing a broader perspective on objects with extreme values of luminosity or star formation rate, based on an understanding of the sequence that lies in-between these extremes. Much remains to be learned from ISO, suggesting several years of productive research on the ISO Science Archive still lie ahead.
SIRTF (Space InfraRed Telescope Facility), scheduled for a December 1, 2001 launch, will build on ISO and tackle the new puzzles with its greater sensitivity, finer spatial resolution and larger fields of view. SOFIA (Stratospheric Observatory for Infrared Astronomy) is expected to fly starting in 2002, bringing to the field greater spatial and spectral resolution and instrumental versatility. FIRST (Far-Infrared and Submillimeter Telescope) will then open up the submillimeter spectrum from space starting in 2007, providing access to the colder material in molecular clouds, so all ISM phases from cold clouds to HII regions and shocked gas can be studied, bringing into focus the full picture of the star formation cycle.
References
- (1) Aalto, S. et al. 1994, A&A, 286, 365.
- (2) Allamandola, L. J, Tielens, A. G. G. M., & Barker, J. R. 1989, ApJS, 71, 733
- (3) Acosta-Pulido, J. A., et al. 1996, A&A, 315, 121
- (4) Alton, P.B. et al. 1998, A&A, 335, 807
- (5) Barvainis, R., Antonucci, A. & Helou, G. 1999, AJ, 118, 645
- (6) Beck, R. & Golla, G. 1988, A&A, 191, L9
- (7) Beichman, C.A., Neugebauer, G., Habing, H., Clegg, P.E. & Chester, T.C. 1988, editors, “IRAS Catalogs and Atlases: Explanatory Supplement”, NASA RP-1190 (Washington: NASA)
- (8) Beichman, C.A. 1987, ARA&A, 25, 521
- (9)
- (10) Beichman, C.A., Helou, G., Van Buren, D., Ganga, K. & Désert, F.X. 1999, ApJ, 523, 559
- (11)
- (12) Beintema, D. A. et al. 1996, A&AL, 315, L369
- (13) Bernard, J.-P., Boulanger, F., Désert, F.X., Giard, M., Helou, G. & Puget, J.-L. 1994, A&A, 291, L5
- (14) Bicay, M.D. & Helou, G. 1990, ApJ, 362, 59
- (15) Block, D.L., Elmegreen, B.G., Stockton, A. & Sauvage, M. 1997, ApJ, 486, L95
- (16)
- (17) Boselli, A., Lequeux, J. & Contursi, A. 1997, A&A, 324, L13
- (18)
- (19) Boselli, A. et al. 1998, A&A, 335, 53
- (20) Bothun, G.D. et al. 1989, ApJ, 341, 129
- (21) Boulade, O. et al. 1996, A&A, 315, L85.
- (22) Boulanger, F. et al. 1988, ApJL, 332, 328.
- (23) Boulanger, F., Falgarone, E., Puget, J.-L., & Helou, G. 1990, ApJ, 364, 136.
- (24) Boulanger, F. et al. 1996, A&AL, 315, L325.
- (25) Boulanger, F. et al. 1998, A&A, 339, 194
- (26) Boulanger, F., in this volume.
- (27) Bradford, C.M. et al. 1999, in “The Universe as Seen by ISO”, ed. P.Cox & M.F. Kessler, ESA SP-47 (Noordwijk: ESA), p. 861
- (28)
- (29) Césarsky, C. et al. 1996, A&AL, 315, L32.
- (30) Césarsky, D. et al. 1996a, A&AL, 315, L305.
- (31) Césarsky, D. et al. 1996b, A&AL, 315, L309.
- (32) Césarsky, D., Lequeux, J., Pagani, L., Loinard, L., Ryter, C. & Sauvage, M. 1999, A&A, in press.
- (33) Charmandaris, Y. et al. 1999, in “The Universe as Seen by ISO”, ed. P.Cox & M.F. Kessler, ESA SP-47 (Noordwijk: ESA), p. 869
- (34) Clegg, P. et al. 1996, A&A, 315, L38
- (35)
- (36) Cohen, M., & Volk, K. 1989, AJ, 98, 1563.
- (37) Comerón, F. & Claes, P. 1999, in “The Universe as Seen by ISO”, ed. P.Cox & M.F. Kessler, ESA SP-47 (Noordwijk: ESA), p. 873
- (38) Condon, J.J. & Broderick, 1988, AJ, 96, 30.
- (39) Condon, J.J., Anderson, M.L. & Helou, G. 1991, ApJ, 376, 95
- (40) Condon, J.J. 1992, ARA&A, 30, 575
- (41) Cox, P. et al. 1988, MNRAS, 235, 1227
- (42) Cox, P., in this volume
- (43) Contursi, A. 1998, PhD Thesis, Univ. de Paris
- (44)
- (45) Dale, D., Helou, G., Silbermann, N., Contursi, A., Malhotra, S. & Rubin, R.H. 1999, AJ, 118, 2055
- (46) Dale, D. et al. 2000a, in preparation
- (47)
- (48) Dale, D., Silbermann, N., Helou, G. et al. 2000b, AJ, in press
- (49) de Graauw, T. et al. 1996, A&A, 315, L49
- (50) de Jong, T. et al. 1985, A&A, 147, L6
- (51) Désert, F.X., Boulanger, F. & Puget, J.L. 1990, A&A, 273, 315.
- (52) Devereux, N.A. & Young, J.S. 1990, ApJL, 350, L25
- (53) Devereux, N.A. & Young, J.S. 1992, AJ, 103, 1536
- (54) Dickey, J.M. & Salpeter, E.E. 1984, AJ, 284, 461
- (55) Draine, B.T. 1985, Protostars and Planets II, ed. D.C. Black & M.S. Matthews (Tucson: University of Arizona), p. 621.
- (56) Draine, B.T. & Anderson, N. 1985, ApJ, 292, 494.
- (57) Draine, B.T. & Bertoldi, F., 1999, in “The Universe as Seen by ISO”, ed. P.Cox & M.F. Kessler, ESA SP-47 (Noordwijk: ESA), p. 553
- (58) Epchtein, N. et al. 1999, in “Astrophysics with Infrared Surveys: A Prelude to SIRTF”, ed. M.D. Bicay et al. (ASP Conf Series 177), 242
- (59) Fadda, D. et al. 1999, in “The Universe as Seen by ISO”, ed. P.Cox & M.F. Kessler, ESA SP-47 (Noordwijk: ESA), p. 1037
- (60) Fadda, D. & Elbaz, D. 1999, in “The Universe as Seen by ISO”, ed. P.Cox & M.F. Kessler, ESA SP-47 (Noordwijk: ESA), p. 1037
- (61) Fich, M. et al. 1999, in “The Universe as Seen by ISO”, ed. P.Cox & M.F. Kessler, ESA SP-47 (Noordwijk: ESA), p. 877
- (62) Field, G.B., Goldsmith, D.W. & Habing, H.J. 1969, ApJL, 155, L149
- (63) Fischer, J. et al. 1999, in “The Universe as Seen by ISO”, ed. P.Cox & M.F. Kessler, ESA SP-47 (Noordwijk: ESA), p. 817
- (64) Gallais, P. et al. 1999, in “The Universe as Seen by ISO”, ed. P.Cox & M.F. Kessler, ESA SP-47 (Noordwijk: ESA), p. 881
- (65) Gilmore, G. & Unavane, M. 1998, MNRAS, 301, 813
- (66)
- (67) Geballe, T.R. 1997, From Stardust to Planetesimals: Contributed Papers, ed. M.E. Kress, A.G.G.M. Tielens, & Y.J. Pendleton, NASA Conference publication 3343 (Moffett Field: NASA ARC), p. 119.
- (68) Genzel, R. et al. 1998, ApJ, 498, 579
- (69)
- (70) Grauer, A.D. & Rieke, M.J. 1998 ApJS, 116, 29
- (71) Haas, M., Lemke, D., Stickel, M. et al. 1998, A&A, 338, L33
- (72) Haas, M. et al. 1999, in “The Universe as Seen by ISO”, ed. P.Cox & M.F. Kessler, ESA SP-47 (Noordwijk: ESA), p. 885
- (73) Hacking, P.B. et al. 1999, “Astrophysics with Infrared Surveys: A Prelude to SIRTF”, ed. M.D. Bicay et al. (ASP Conf Series 177), 409
- (74) Hacking, P. B. et al. 1989, AJ, 339, 12
- (75) Harwit, M. & Pacini, F. 1975, ApJL, 200, L127
- (76) Harwit M. & Houck, J.R. 1987, ApJ, 315, 28
- (77) Helou, G. 1985, in “Star-Forming Dwarf Galaxies and Related Objects”, ed. D. Kunth, T.X. Thuan & J.T.T. Van (Editions Frontieres: Gif-sur-Yvette), p. 319
- (78) Helou, G., Soifer, B.T. & Rowan-Robinson, M. 1985, ApJL, 298, L7.
- (79) Helou, G. 1986, ApJL, 311, L33
- (80)
- (81) Helou, G., Khan, I., Malek, L. & Boehmer, L. 1988, ApJS, 68, 151
- (82) Helou, G., Ryter, C. & Soifer, B.T. 1991, ApJ, 376, 505
- (83) Helou, G. 1991, in “The Interpretation of Modern Synthesis Observations of Galaxies”, ed. N. Duric & P. Crane (ASP Conf Ser. 18), 125
- (84) Helou, G. & Bicay, M.D. 1993, ApJ, 415, 93
- (85)
- (86) Helou, G. & Wang, Z. 1995, in “The interplay Between Massive Star Formation, the ISM, and Galaxy Evolution”, ed. D. Kunth, B. Guiderdoni, M. Heydari-Malayeri & T.X. Thuan (Editions Frontieres: Gif-sur-Yvette), p. 307
- (87) Helou, G. et al. 1996, A&AL, 315, L157
- (88) Helou, G., Becklin, E., Stencel, R.E. & Wilkes, B. 1997, ASP Conf Ser 124, 393
- (89)
- (90) Helou, G., Lu, N., Werner, M.W., Malhotra, S. & Silbermann, N. 1999, ApJL, in press
- (91) Helou, G. 1999, in “Astrophysics with Infrared Surveys: A Prelude to SIRTF”, ed. M.D. Bicay et al. (ASP Conf Series 177), 197
- (92) Helou, G. et al. 2000, in preparation
- (93)
- (94) Hippelein, H. et al. 1996, A&A, 315, L79
- (95)
- (96) Hollenbach, D.J. & Tielens, A.G.G.M. 1997, ARA&A, 35, 179
- (97) Houck, J.R. et al. 1985, ApJL, 290, L5
- (98) Howe, J.E. et al. 1991, ApJ, 373, 158
- (99) Jarrett, T., Helou, G., Valjavec, E. & Condon, J. 1999, AJ, in press
- (100) Jura, M. 1986, ApJ 306, 483
- (101) Karoji, H., Dennefeld, M. & Ukida, N. 1985, A&A, 155, L3
- (102) Kennicutt, R. 1983, A&A, 120, 219
- (103) Kessler, M.F. et al. 1996, A&AL, 315, L27.
- (104)
- (105) Kim, D.-C. & Sanders, D.B. 1998, ApJS, 119, 41
- (106)
- (107) Klaas, U., Haas, M., Heinrichsen, I. & Schulz, B. 1997, A&A, 325, L21
- (108) Klaas, U., Haas, M. & Schultz, B. 1999, in “The Universe as Seen by ISO”, ed. P.Cox & M.F. Kessler, ESA SP-47 (Noordwijk: ESA), p. 901
- (109) Klein, U. 1982, A&A, 116, 175
- (110) Knapp, G.R., Helou, G. & Stark, A.A. 1987, AJ, 94, 54
- (111) Knapp, G.R. et al. 1989, ApJS, 70, 329
- (112) Knapp, G.R., Rupen, M.P., Fich, M., Harper, D.A. & Wynn-Williams, C.G. 1996, A&A, 315, L75
- (113)
- (114) Kunze, D. et al. 1996, A&A, 315, L101
- (115) Kunze, D.et al. 1999, in “The Universe as Seen by ISO”, ed. P.Cox & M.F. Kessler, ESA SP-47 (Noordwijk: ESA), p. 909
- (116) Larson, R.B. & Tinsley, B.M. 1978, ApJ, 219, 46
- (117) Laurent, O. et al. 1999, in “The Universe as Seen by ISO”, ed. P.Cox & M.F. Kessler, ESA SP-47 (Noordwijk: ESA), p. 913
- (118) Le Coupanec, P. et al. 1999, in “The Universe as Seen by ISO”, ed. P.Cox & M.F. Kessler, ESA SP-47 (Noordwijk: ESA), p. 917
- (119) Leech, K.J. et al. 1999, in “The Universe as Seen by ISO”, ed. P.Cox & M.F. Kessler, ESA SP-47 (Noordwijk: ESA), p. 921
- (120) Lemke, D. et al. 1996, A&AL, 315, L64
- (121) Lémonon, L. et al. 1999, in “The Universe as Seen by ISO”, ed. P.Cox & M.F. Kessler, ESA SP-47 (Noordwijk: ESA), p. 925
- (122) Lequeux, J. 1971, A&A, 15, 42
- (123) Lequeux, J. et al. , A&A, submitted
- (124) Lu, N., Helou, G., Beichman, C.A. et al. 1996, BAAS, 28, 1356
- (125) Lu, N. et al. 1999, in “The Universe as Seen by ISO”, ed. P.Cox & M.F. Kessler, ESA SP-47 (Noordwijk: ESA), p. 929
- (126) Lu, N. Y., et al. , 2000, in preparation
- (127) Luhman, M.L. et al. 1998, ApJL, 504, L11
- (128) Lutz, D. et al. 1996, A&A, 315, L269.
- (129) Lutz, D. Spoon, H.W.W., Rigopoulou, D., Moorwood, A.F.M. & Genzel, R. 1998, ApJ, 505, L103.
- (130) Madden, S.C., Vigroux, L. & Sauvage, M. 1997, in Extragalactic Astronomy in the Infrared, ed. Mamon, Thuan & Van (Editions Frontières: Paris)
- (131) Madden, S.C. et al. 1999, in “The Universe as Seen by ISO”, ed. P.Cox & M.F. Kessler, ESA SP-47 (Noordwijk: ESA), p. 933
- (132) Malhotra, S. et al. 1996, A&A, 315, L161
- (133) Malhotra, S., Helou, G., Stacey, G. et al. 1998, ApJ, 491, L27.
- (134) Malhotra, S. et al. 1999, in “The Universe as Seen by ISO”, ed. P.Cox & M.F. Kessler, ESA SP-47 (Noordwijk: ESA), p. 937
- (135) Malhotra, S. et al. 1999, AJ, submitted.
- (136) Malhotra, S. et al. 2000, ApJ, submitted.
- (137)
- (138) Maloney, P. & Black, J. 1988, ApJ, 325, 389.
- (139) Marsh, K.A. & Helou, G. 1995, ApJ, 445, 599
- (140) Marsh, K.A. & Helou, G. 1998, ApJ, 493, 121
- (141) Mattila, K. et al. 1996, A&AL, 315, L353.
- (142) Mattila, K. et al. 1999, in “The Universe as Seen by ISO”, ed. P.Cox & M.F. Kessler, ESA SP-47 (Noordwijk: ESA), p. 941
- (143) Menon, T.K. 1991, ApJ, 372, 419
- (144) Metcalfe, L. et al. 1996, A&AL, 315, L105.
- (145) Metcalfe, L. et al. 1999, 99P p. 1019
- (146) Meurer, G.R., Heckman, T.M., Lehnert, M.D., Leitherer, C. & Lowenthal, J. 1997, AJ, 114, 54.
- (147) Moshir et al. 1992, “Explanatory Supplement to the IRAS Faint Source Survey, Version 2”, JPL D-10015 8/92 (Pasadena: JPL)
- (148)
- (149) Pierini, M. et al. 1999, MNRAS, 303, 29
- (150) Puget, J.-L. & Léger, A. 1989, ARA&A, 27, 161.
- (151) Rand, R.J. et al. 1992, ApJ, 390, 66
- (152) Rice, W. et al. 1990, ApJ, 358, 418
- (153) Rickard, L.J. & Harvey, P.M. 1984, AJ, 89, 1520.
- (154) Roche, P.F., Aitken, D.K., Phillips, M.M. & Whitmore, B. 1985, MNRAS, 207, 35
- (155) Roche, P.F., Aitken, D.K., Smith, C.H. & Ward, .J. 1991, MNRAS, 248, 606
- (156) Roelfsema et al. 1996, A&AL, 315, L289
- (157) Roellig, T.L., Houck, J.R., Van Cleve, J.E. et al. 1998, in Proc. SPIE, ed. A.M. Fowler, 3354, 1192
- (158) Rouan, D. et al. 1996, A&A, 315, L141
- (159) Sanders, D.B. & Mirabel, I.F. 1996, ARAA, 34, 749
- (160) Sauvage, M. & Thuan, T.X. 1994, ApJ, 429, 153
- (161) Sauvage, M. et al. 1996, A&A, 315, L89
- (162)
- (163) Sellgren, K. 1984, ApJ, 277, 623.
- (164) Silbermann, N. et al. 1996, BAAS, 189, 6701.
- (165) Silbermann, N. et al. 1999, in preparation.
- (166)
- (167) Skinner, C.J., Smith, H.A., Sturm, E., Barlow, M.J., Cohen, R.J. & Stacey, G.J. 1997, Nature, 386, 472
- (168) Skrutskie, M.F. 1999, in “Astrophysics with Infrared Surveys: A Prelude to SIRTF”, ed. M.D. Bicay et al. (ASP Conf Series 177), 185
- (169) Smith, B. 1998, ApJ, 500, 181
- (170)
- (171) Smith, B.J. & Madden, S. C. 1997, AJ, 114, 138
- (172) Soifer, B.T. et al. 1986, ApJ, 304, 651
- (173) Soifer, B.T., Houck, J.R. & Neugebauer, G. 1987, ARAA, 25, 187
- (174) Soifer, B.T. & Neugebauer, G. 1991, AJ, 101, 354
- (175) Stickel, M. et al. 1998, A&A, 336, 116
- (176) Tielens, X. 1999, in “The Universe as Seen by ISO”, ed. P.Cox & M.F. Kessler, ESA SP-47 (Noordwijk: ESA), p. 579
- (177) Tokunaga, A.T. 1997, in From Stardust to Planetesimals: Contributed Papers, ed. M.E. Kress, A.G.G.M. Tielens, & Y.J. Pendleton, NASA Conference publication 3343 (Moffett Field: NASA ARC).
- (178) Tran, D. 1998, PhD Thesis, Univ. de Paris
- (179) Uchida, K., Sellgren, K. & Werner, M., 1998, ApJ, 493, L109
- (180) Uchida, K., Sellgren, K., Werner, M.W. & Houdashelt, M.L. 1999, ApJ, in press
- (181) Valentijn, E.A. et al. 1996, A&A, 315, L60
- (182)
- (183) Valentijn, E.A., van der Werf, P.P., de Graauw, T. & de Jong, T. 1996, A&A, 315, L145.
- (184) Verstraete, L., Puget, J. L., Falgarone, E., Drapatz, S., Wright, C. M., & Timmermann, R. 1996, A&A, 315, L337.
- (185) Vigroux, L., et al. 1996, A&A, 315, L93.
- (186) Vigroux, L. 1997, in Extragalactic Astronomy in the Infrared, ed. G. Mamon, T.X. Thuan & J.T.T. Van (Editions Frontières: Paris)
- (187) Wainscoat, R.J. et al. 1987, A&A, 181, 225
- (188) Willner, S., Soifer, B., Russell, R., Joyce, R., & Gillett, F. 1977, ApJ, 217, L121.
- (189)
- (190) Xu, C. et al. . 1998, ApJ, 508, 576
- (191)
- (192) Xu, C., Sulentic, J.W. & Tuffs, R. 1999, ApJ, 512, 178
- (193)