A Pressure Anomaly for HII Regions in Irregular Galaxies
Abstract
The pressures of giant HII regions in 6 dwarf Irregular galaxies are found to be a factor of larger than the average pressures of the corresponding galaxy disks, obtained from the stellar and gaseous column densities. This is unlike the situation for spiral galaxies where these two pressures are approximately equal. Either the HII regions in these dwarfs are all so young that they are still expanding or there is an unexpected source of disk self-gravity that increases the background pressure.
We consider first whether any additional self-gravity might come from disk dark matter that is either cold H2 gas in diffuse or self-gravitating clouds with weak CO emission, or is the same material as the halo dark matter inferred from rotation curves. The H2 solution is possible because cold molecular clouds would be virtually invisible in existing surveys if they were also CO-weak from the low metal abundances in these galaxies. Cosmological dark matter might be possible too because of the relatively large volume fraction occupied by the disk within the overall galaxy potential. There is a problem with both of these solutions, however: the vertical scale heights inferred for Irregular galaxies are consistent with the luminous matter alone. The amount of disk dark matter that is required to explain the high HII region pressures would give gas and stellar scale heights that are too small.
The anomalous pressures in star-forming regions are more likely the result of local peaks in the gravitational field that come from large gas concentrations. These peaks also explain the anomalously low average column density thresholds for star formation that were found earlier for Irregular galaxies, and they permit the existence of a cool HI phase as the first step toward dense molecular cores. The evidence for concentrations of HI in regions of star formation is summarized; the peak column densities are shown to be consistent with local pressure equilibrium for the HII regions. Strongly self-gravitating star-forming regions should also limit the dispersal of metals into the intergalactic medium.
The third possibility is that all of the visible HII regions in these dwarf galaxies are strongly over-pressured and still expanding. The mean time to pressure equilibrium is times their current age, which implies that the observed population is only 7% of the total if they live that long; the rest are presumably too faint to see. The expansion model also implies that the volume filling factor can reach times the current factor, in which case faint and aging HII regions should merge and occupy nearly the entire dwarf galaxy volume. This would explain the origin of the giant HI shells seen in these galaxies as the result of old, expanded HII regions that were formerly driven by OB associations. The exciting clusters would now be so old and dispersed that they would not be recognized easily. The shells are still round because of a lack of shear.
received 16 February 2000; accepted 13 April 2000
1 Introduction
Dwarf Irregular galaxies often have relatively large and bright HII regions indicative of active star formation in dense neighboring clouds. Normal spiral galaxies have equally bright HII regions, but the background stellar disks in spiral galaxies are usually bright too, giving the HII regions less contrast than they have in dwarfs. This difference leads to the well-known patchy and apparent starburst quality of dwarf galaxies. Here we point out that the difference also translates into a pressure anomaly that may have important implications for the distribution of matter or the origin of giant shells.
The pressures in the largest HII regions of 6 dwarf Irregular galaxies are found to be times larger than the pressures from the average gravitational binding of the disk in the vertical direction, unlike the case for spiral galaxies where these two pressures are comparable (Sects. 2, 3). Either the HII regions are actively expanding to fill the disk volume and part of the halo (their volumes have to increase by a factor of before they reach pressure equilibrium), or there is additional mass in the star-forming regions that increases the ambient disk pressure. We show below that this additional mass corresponds to a factor of enhancement in column density if it is in the form of gas, and a factor of enhancement in column density if it is in the form of non-interacting cosmological particles.
We first consider the possibility that there might be additional mass in a pervasive dark form (Sects. 4). The factor of needed to account for the disk pressure anomaly is comparable to the mass factor needed to account for dwarf galaxy rotation curves. Disk dark matter was previously considered for dwarf galaxies based on the gravitational instability threshold for star formation and on the need for a cool atomic phase of interstellar matter (Hunter, Elmegreen, & Baker 1998; hereafter Paper I). There seems to be a problem with scale heights in this case, however: if pervasive dark matter in any form explains the HII region pressure anomaly, then the interstellar scale heights would be 3 to 10 times smaller than the values usually inferred for dwarf galaxies (Sect. 5).
A better solution is to have the visible matter distributed non-uniformly, with large concentrations of gas around the HII regions and relatively small column densities elsewhere (Sect. 6). Observations of dwarfs already suggest that most of the inner-disk HI gas is concentrated directly in the regions of star formation (see also van Zee et al. 1997). This raises the pressure locally, and provides some resistance to HII region expansion. A comparison with the gas distributions in spiral galaxies (Sect. 8) suggests that the same physical processes may be at work in the formation of clouds, but the presence of shear and spiral waves in the larger systems makes the morphology, and possibly the ages, of the equivalent gas concentrations different.
Any systematic concentration of gas in the immediate vicinity of star formation raises the possibility that enriched outflows from dwarf galaxies may be less likely than previously believed (Dekel & Silk 1986). The outflow would not feel the weak potential of the galaxy at first, allowing its easy escape, but the deep potential well of the star-forming concentration and the enhanced drag from all of the additional gas around it. Only if the outflow can get around this local resistance may it get a chance to leave the galaxy.
Another possibility is that the HII regions are only the brightest and highest-pressure members of a larger population of HII regions that are still expanding into an anomalously low pressure interstellar medium (Sect. 7). This is consistent with our detection limitations, and also has interesting implications for the origin of giant HI shells.
Distinctions between these possibilities can be determined by independent measures of the turbulent pressures and disk dark matter contents of dwarf galaxies, by observations of the kinematics and morphology of extremely faint HII regions, and by any correlation between old and dispersed OB associations and giant HI shells.
2 Pressures of HII regions
The pressures of the largest HII regions in a galaxy, if they are not too faint to be seen, should be a good indicator of the ambient interstellar pressure. HII regions expand quickly when they are young, but they decelerate after a few internal sound crossing times and expand more slowly after this. In a galactic population with a wide age spread, most of the HII regions are close to their largest sizes and lowest pressures (Sect. 3). Many of them should be nearly stalled in pressure equilibrium, although a few of the largest might still break out of the disk when their radii exceed a scale height.
A primary concern is whether the pressure-equilibrium HII regions are too faint to be observed. If the ambient pressure is high, then a large fraction of the HII regions in a galaxy should be observable because their limiting sizes are relatively small and their final emission measures relatively high. If the ambient pressure is low, then the expansion to pressure equilibrium takes a very long time and most of the HII regions in a galaxy may be too faint to see. Such a hidden population of old HII regions would have interesting consequences for interstellar structure.
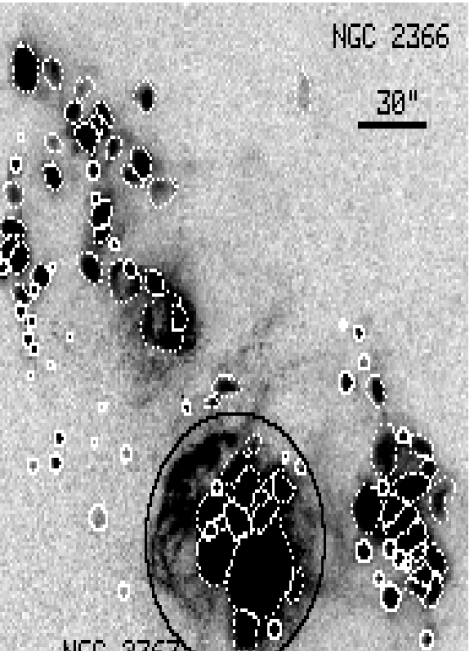
Figure 1 shows an H image of NGC 2366. Prominent HII regions as defined by Youngblood & Hunter (1999) are outlined, and a circle is drawn around the supergiant HII complex NGC 2363 (which was recently studied by Drissen et al. 1999). Many of the HII regions have well-defined edges, making them appear to be bounded by some external pressure. The arcs or partial shells of emission around the complex have the same character.
We examined the radii, , and H luminosities, , of these HII regions in NGC 2366, and of similar HII regions in five other dwarf Irregular galaxies, listed in Table 1. The luminosities were measured from CCD photometry by Youngblood & Hunter (1999) and converted to Lyman Continuum photon counts per second by multiplying by erg-1. The result was converted to by dividing by the recombination rate cm-3 s-1 (case B recombination at K; Osterbrock 1974). This quantity was then divided by for the observed HII region radius, and the square root of this gives the rms density. To get a measure of the rms thermal pressure, we multiply the rms density by , which assumes contributions from electrons, protons, and a 10% abundance of He at K. The results are plotted as points in Figure 2. The cross in the panel for NGC 2366 is the value for the whole complex of HII regions outlined in Figure 1 (NGC 2363).
Detection limits were estimated for the HII regions in our galaxies by Youngblood & Hunter (1999). They were determined for a moderately crowded field and are only meant to be representative of limiting surface brightness. These limits are shown in Figure 2 as circles on the y-axes. They are usually at the lower borders of the HII regions plotted, indicating that the observation have found emission down to the detection limit. This implies that fainter HII regions may be present.
The rms thermal pressures in Figure 2 are not the peak pressures in the HII regions because the densities vary as a result of clumpy structure and because turbulent motions increase the overall velocity dispersion in the ionized gas. The pressure can also increase by a factor of 100 or more in the ionization front at the edge of an embedded neutral cloud. For example, in NGC 2366, our [OII] spectra give densities of cm-3 and 50 cm-3 (Hunter & Hoffman 1999) in HII regions where the rms densities calculated above equal 3.3 and 1.4, respectively. This [OII] emission is coming from an ionization front that has a pressure much larger than the average. The rms thermal pressures are useful primarily as a measure of the minimum pressure near the diffuse edge of the HII region. It is expected to be smaller than the total pressure there by perhaps a factor of because of the exclusion of turbulent motions in our calculations. This boundary is an important part of the HII region for the present discussion because it is where the expanding gas interacts with the ambient ISM.
The HII region density used for this calculation is the rms density obtained from the emission, not the average density. The average density in a region is always less than the rms density, so we have to demonstrate that the pressure obtained from the rms density is a useful concept. This is most easily done when the density fluctuations result from supersonic turbulence, as is likely to be the case far from neutral cloud edges. The pressure we really want is not the thermal pressure obtained above using the rms density, which may be written for mean atomic mass , but the total of the thermal and turbulent pressures, which is obtained from the average density and the quadratic sum of the sound speed and the turbulent velocity, . We can get this total pressure using an idealized model in which a fraction of the volume is in turbulence-compressed regions of density , and a fraction of the volume is an interclump gas, of density . For non-magnetic turbulence compression, these two densities are related by the square of the Mach number, . The rms density is related also, by the equation . The average density is . From these expressions, we can get the ratio of the desired total pressure to the rms thermal pressure calculated above. This ratio is:
| (1) |
Sample values of this ratio are shown in Table 2. For , the ratio equals 2 for all , so the value is not tabulated. The ratio exceeds 2 for , and typically exceeds 10 for . Thus, the rms thermal pressures in Figure 1 are reasonable lower limits to the total pressures in turbulent HII regions. The actual pressure could be larger by at least a factor of 2, depending on the strength of the turbulent motions.
Figure 3 shows the rms densities in the HII regions versus their radii for comparison with similar plots of Galactic HII regions made by Habing & Israel (1979) and of the largest HII regions in nearby galaxies, made by Kennicutt (1984). Our survey for dwarf Irregulars includes only the resolved HII regions, and for them, the densities are about the same as for the HII regions with similar sizes in our Galaxy and other giant spirals. Smaller HII regions in our sample of dwarf galaxies should have larger densities like the smaller HII regions in giant galaxies.
The decrease in rms density with increasing HII region size is the result of a combination of expansion for some HII regions, which gives this correlation even for a uniform ambient medium, plus pressure equilibrium for other HII regions, which gives this correlation when the surrounding pressure varies from place to place. In the latter case, the lower pressure regions have lower-density equilibrium HII regions, and larger Strömgren radii for the same luminosities. As a result of these effects, the variation in rms density is between a factor of 3 and 10 for the observed range of sizes. This is a relatively small scatter, considering the inaccuracy of the pressure derivation, but lower-density HII regions cannot be seen with these sizes, so the small scatter is partly an artifact of the detection limit. The scatter from one galaxy to another is even less: most of the observable giant HII regions in these dwarf galaxies have an rms density close to 1 cm-3. This is the same as the rms density of most observable giant HII regions in normal spirals (Kennicutt 1988; see his Fig. 6), but these have comparable detection limits. This similarity to giant spirals gives the impression that the HII regions studied here are normal in terms of their densities, sizes, and rms thermal pressures. Any differences between dwarf galaxy HII regions and spiral galaxy HII regions occurs below the H detection limit.
3 Mean ISM Pressures in the Galactic Disks
The average pressure in the local ISM is K cm-3 from the summation of turbulent and thermal motions, magnetic fields, and cosmic rays (Parker 1966; Boulares & Cox 1990; Ferrara 1993). This is comparable to the average thermal HII region pressure in the largest HII regions in giant spiral galaxies, considering that their electron densities are always about 1 cm-3 (e.g., Kennicutt 1988). This comparison leads to the sensible conclusion that the largest HII regions have expanded to some pressure equilibrium with their environment. Alternatively, the HII regions could still be freshly ionizing the large-scale ambient medium around them, but because the effective rms velocity dispersion of the general ISM is about the same as the effective rms dispersion of an HII region, their pressures are about the same (Kennicutt 1988).
The origin of the average ISM pressure is energy input from a combination of supernovae, stellar winds, and other point sources, and, in the case of the magnetic field, from differential galactic rotation too. However, the disk expands in the vertical direction to adjust its pressure, so we cannot derive the pressure simply by adding up the contributions from midplane energy sources; we also have to consider the height of the gas layer relative to the stars.
The easiest way to estimate the total average ISM pressure is from the self-gravitational binding energy density of the disk in the vertical direction. This automatically includes the energy sources if the vertical velocity dispersion of the gas is chosen correctly. The result is a midplane pressure equal to (Elmegreen 1989)
| (2) |
where is the total gas mass column density, is the stellar mass column density, is the total effective vertical gas velocity dispersion, e.g., as it enters into an expression for the scale height, and is the effective stellar vertical velocity dispersion. The gas velocity dispersion, , contains the magnetic () and cosmic ray () pressures and, in the notation of Parker (1966), may be written in terms of the turbulent pressure and 1-D rms gas speed as where and are of order unity. The term in the parentheses of equation 2 is the total column density of gas and stars inside the gas layer. This total column density is multiplied by the pure-gas column density, outside the parenthesis, to get the total midplane pressure.
To evaluate the average midplane pressure for a galaxy, we need the average gaseous and stellar column densities and some estimate for . The gaseous column density is taken from the radial distribution of the average HI column density given by published radio interferometer observations, corrected for He and heavy elements. For the moment, we ignore the unknown contribution to from H2. The stellar column density is taken from the radial profile of the average V-band surface brightness and the mass-to-light ratio given by the optical color, either as a function of radius or for the galaxy as a whole. The surface brightness is converted into surface mass density by the equation:
| (3) |
In this equation, the surface brightness in mag arcsec-2, scaled to the Sun’s absolute V magnitude of 4.84 mag, is converted into a surface luminosity in L⊙ per pc2 by dividing by the area of 1 square arcsec at a distance of 10 pc (). The result is multiplied by the mass-to-light ratio to get the surface density in M⊙ pc-2. The ratio of velocity dispersions, in equation (2), is taken equal to 0.5.
Figure 2 shows the average midplane pressure versus radius for the 6 dwarf Irregular galaxies in our survey. The average midplane pressure calculated only from the gas column density and the V-band surface brightness is less than the HII region pressure by about an order of magnitude for these galaxies. Table 3 gives the averages of the pressures in the HII regions and in the disks for radii beyond , and it gives the ratios of these averages. These ratios range from to in all cases but DDO155, where it is . Evidently, the rms thermal pressures in all of the HII regions exceed the average midplane pressures calculated from disk self-binding. If we consider that most HII regions also have an equal or greater contribution to pressure from turbulent motions, and that the pressures at some of the ionized edges can be larger than the average pressure if there are ionization fronts (see Table 2), then we conclude that the observable HII regions are typically over-pressured by more than a factor of ten. In what follows, we consider this factor of 10 to be representative of the measured HII region over-pressures in dwarf Irregular galaxies.
In giant spiral galaxies, the average midplane pressure calculated in the same way is essentially the same as the rms thermal pressure of giant HII regions, namely several K cm-3. The HI column densities are about the same in the two galaxy types too. The difference from the present result is that the average surface brightness of giant spirals is several magnitudes larger than the surface brightnesses of dwarfs, and this factor of translates directly into an ISM pressure difference. Note that even if we took (Bottema, Shostak & van der Kruit 1986), which is the maximum likely value, the HII regions in dwarfs would still be over-pressured.
The HII regions in these dwarf galaxies are either confined by some additional background pressure that was not included in the average disk pressure determined above, or they are expanding into a much lower-pressure interstellar medium and disappearing at the detection threshold. We consider in the next three sections the first of these options: whether star formation in dwarf galaxies might typically occur in anomalously high pressure clouds compared to the rest of the disk. Then we consider the implications of the second option, a prolonged expansion of HII regions into low pressure galaxies.
4 Disk Dark Matter
The ambient pressure in a galaxy disk depends entirely on the column density of material. If the ambient pressure is larger than the average column density suggests, then there has to be an additional mass in the disk that has not yet been counted. We first consider whether this additional mass can be dark matter in some form.
The possibility that a substantial fraction of a spiral galaxy’s dark matter is in its disk has been discussed extensively over the last several years, particularly in regard to unseen molecular gas. Lequeux, Allen, & Guilloteau (1993) found cold CO in the outer Galaxy disk and suggested it might account for a significant fraction of the dark matter inferred from the rotation curve. Anomalous extinction in the outer part of the SMC led to the same suggestion by Lequeux (1994). Pfenniger, Combes & Martinet (1994) reviewed the evidence for large amounts of unseen molecular material in other galaxies. Pfenniger & Combes (1994) provided a model for how it might be hidden, while Combes & Pfenniger (1997) gave several suggestions for how it might be observed. In M31, cold CO was inferred from observations of the inner disk by Loinard, Allen, & Lequeux (1995).
Dark molecules might also be present in galactic halos. In the thick disk of NGC 891, a substantial amount of warm H2 (150-230K), enough to account for the rotation curve, was directly observed by Valentijn & van der Werf (1999). Dark molecular gas in the Galactic halo was discussed by de Paolis, et al. (1995a,b) as an explanation for microlensing events, and by Kalberla, Shchekinov, & Dettmar (1999) as an explanation for the background gamma ray emission.
This picture of dark baryonic matter is not without problems, however. Early attempts to detect substantial amounts of cold H2 in our Galaxy were unsuccessful (Evans, Rubin, & Zuckerman, 1980; Wilson, & Mauersberger 1994), and the COBE flux in the Milky Way is accounted for entirely by dust associated with known gas (Sodroski et al. 1997). Surface photometry of other galaxies also shows too little extinction for the dynamical dark matter to be in the form of dispersed gas (D. Elmegreen 1980; Beckman et al. 1996; Berlind et al. 1997; Pizagno & Rix 1998). Moreover, the expected effects of hidden cold disk matter on disk stability and the gaseous scale height are unobserved (Knapp 1987; Merrifield 1992; Malhotra 1994, 1995; Elmegreen 1996; Olling & Merrifield 2000). In the solar neighborhood, the vertical scale height of both gas (van der Kruit & Shostak 1984) and stars (Kuijken & Gilmore 1989, 1991) can be explained without much disk dark matter at all. The same is true for the edge-on galaxy NGC 891 (van der Kruit 1981). However, Olling (1996) obtained a different result for NGC 4244, suggesting that the dark matter has an aspect ratio of unless the gas motions are non-isotropic, and Becquaert & Combes (1997) proposed a flattened distribution for NGC 891 considering also a warp.
There is probably a substantial amount of warm H2 in galaxies that is not associated with CO emission or any other currently-observed emitting phase, as is the case for many of the diffuse clouds in the local ISM (Spitzer & Jenkins 1975), and there may also be cold CO+H2 gas that is too poorly excited to emit in CO. The molecular fraction of the ISM is high in the inner regions of spiral galaxies anyway (Honma, Sofue, & Arimoto 1995), presumably because of the high dust abundance to enhance molecule formation (Smith et al. 2000), and because of the high pressure for enhanced self-shielding (Elmegreen 1993). If it is high in dwarf galaxies, which have low metal abundances and lower stellar column densities, making it more difficult to have high pressures, then the reason for this would have to be different.
The situation is indeed very different in dwarf galaxies. There the radiation field can be so low in regions far from star formation that cold molecular gas might be more prevalent, particularly in large, low-density self-gravitating clouds. A similar situation might occur in the far-outer regions of spiral galaxies. Secondly, dwarf galaxies have such a low mass that the virial velocity or rotation speed is only a few times the gaseous velocity dispersion. In this situation, the two-fluid instability (Jog & Solomon 1984) couples the dark matter and the gas, enhancing the effective mass of the latter (Paper I). This gives the disk a larger self-gravity and lower Toomre Q value than it would have from the visible gas and stars alone. It also increases the midplane pressure (Paper I).
The amount of disk dark matter necessary to equilibrate the back pressure of the ISM on an HII region depends on the form of this matter. If it contributes to the pressure directly, in addition to the disk self-gravity, then it acts like an additional term in , and only a factor of times the HI column density is necessary to increase in equation (2) by the required factor of . This is because occurs both outside and inside the parenthesis: the one outside acts like a density in the expression for pressure (actually it is the midplane gas density times twice the scale height), and the one inside determines the squared velocity dispersion (in the expression for scale height). If, on the other hand, the disk dark matter contributes only to the self-gravity, then it acts in equation (2) like the stellar surface density, , and a factor of times the current total disk column density is needed to give pressure equilibrium.
In either case, there is no known material that is present in these galaxy disks at a pervasive level of times the average HI column density or stellar surface density. If the unseen material is distributed gas, then the associated dust would increase the opacity of the disk to unacceptable levels. If it is stellar, then the mass function would require an unusually large peak at the brown dwarf mass in order to hide 10 times the stellar luminosity from the optical bands. It has to be in a dark and compact, unresolved state, such as tiny clouds (Pfenniger & Combes 1994), old degenerate stars, or elementary particles. In this case, it would seem to be unable to contribute to the ISM back-pressure directly, and so would need the factor of enhancement rather than the factor of .
One possibility is that the dark matter is distributed and gaseous but only in the outer disk, beyond the HII regions. Then it may show up as extinction for background galaxies (Lequeux 1994), but not contribute to the disk pressure directly. In this case, the gravity from the outer disk would still contribute to the perpendicular force in the inner disk, and therefore enter into the parenthesis of equation (2), but a factor of mass enhancement would be needed, not just for inner-disk gas.
A factor of enhancement in dwarf galaxy disk dark matter is close to the factor needed for dwarf galaxy dark matter overall, as determined from the rotation curves (Kormendy 1988; Carignan & Freeman 1988; Carignan & Beaulieu 1989; van Zee et al. 1996; Swatters 1999). If we consider the large disk thicknesses for these galaxies (Hodge & Hitchcock 1966; van den Bergh 1988), and the correspondingly large disk aspect ratios ( in Staveley-Smith et al. 1992; in Carignan & Purton 1998), then perhaps half of the total dark matter is within the disk anyway. Thus cosmological dark matter could solve the pressure problem: the fraction of it that happens to reside in the disk volume would participate in the dynamics of the disk, contributing to the overall disk self-gravity and therefore the ambient ISM pressure, and also helping to form clouds by large scale gravitational instabilities (Paper I). The part of it that is in the halo would have no disk or pressure consequences.
Cosmological dark matter in spiral galaxies would, in principle, have the same effect, but because the disk is a much smaller fraction of the volume in the inner regions of spiral galaxies, and the velocity dispersion of the halo dark matter is a much larger factor times the disk dispersion (not an independent statement), the impact of this dark matter on the disk dynamics should be relatively small.
5 A Problem with Disk Dark Matter
Although disk dark matter could, in principle, explain the HII region pressure anomaly, there is no direct evidence for substantial amounts of dark matter in galaxy disks, and there is also direct evidence for a lack of it in the Milky Way, considering the scale heights in the Solar neighborhood and outer disk (cf. Sect. 4). What can we learn about disk dark matter in dwarf galaxies from the scale heights there?
Figure 4 shows the theoretical gaseous scale heights for our galaxies based on the equation from equilibrium:
| (4) |
The denominator should be the total column density inside the gas layer, including dark matter if there is any, but here it is written with only the known gaseous and stellar disk matter to see if we get a reasonable result in this limit. The numerator is the total effective gaseous velocity dispersion, including cosmic rays and magnetic fields, as discussed above. In the figure we use km s-1 (van der Kruit, & Shostak 1982, 1984; Shostak & van der Kruit 1984; Dickey, Hanson & Helou 1990; Boulanger & Viallefond 1992). If km s-1 without any contribution from magnetic effects (i.e., as measured directly by the HI velocity dispersion in some galaxies; van der Kruit & Shostak 1984; Walter & Brinks 1999), the scale heights would be about half the values in the figure.
The figure indicates that the theoretical scale heights range between pc for km s-1 and half of that for km s-1. These values are comparable to the estimates for dwarf Irregulars based on bubble size ( pc for DDO 50 in Puche et al. 1992; pc for IC 2574 in Walter & Brinks 1999), large disk aspect ratios (Staveley-Smith et al. 1992; Carignan & Purton 1998), and direct thickness measurements ( pc for NGC 5023 in Bottema, Shostak, & van der Kruit 1986). This implies there is already enough mass in the disks of these galaxies to account for the gaseous scale heights, without the addition of any dark matter. It is not possible to increase the disk dark matter by a factor of without making the scale heights too small by the inverse proportion.
Other evidence for negligible disk dark matter was given by Swaters (1999), who measured the stellar velocity dispersion in the face-on dwarf galaxy UGC 4325. He found the dispersion to be too small to allow the dark matter inferred from the rotation curve to be present in the disk.
The only way substantial disk dark matter can be present and still have the inferred large scale heights is if the effective velocity dispersion is large, km s-1. This would also increase the ISM pressure to the value required by HII region near-equilibrium. However, there is no evidence for such fast motions in the HI observations, and it is unlikely that a dwarf galaxy, which has very little shear, can generate a strong enough magnetic field to give an effective dispersion that large when the actual rms speed of the gas is only km s-1. Consideration of only a cold ISM component, such as molecular clouds with a dispersion of km s-1, makes the scale height problem worse. We conclude that there must be some explanation for the systematically high HII region pressures that does not rely on either disk dark matter or high gas velocity dispersions.
6 Locally high disk pressure and self-gravity from giant cloud complexes
The pressure anomaly found here may be related to the critical column density anomaly found in Paper I and by van Zee, et al. (1997). In both cases, the self-gravities of the disks near regions of star formation are not large enough if the average column densities of the gas and stars are used to determine them; the higher values given by the local column density peaks should be used instead. An increase in by a factor of on the scale of the average interstellar Jeans length would account for both anomalies.
The HI distributions in dwarf Irregulars are indeed clumpy on large scales. This differs from the morphology of giant spiral galaxies, where the HI is mostly in the form of spiral arms and in the giant cloud complexes of these arms. In dwarfs, there may be two or three HI concentrations in the whole optical disk, and these are the main regions where stars form.
The peak HI column density in a typical concentration of a dwarf Irregular is larger than the peak HI column density in a spiral galaxy (Skillman 1985; Lo, Sargent & Young 1993; Cayatte et al. 1994; Broeils & van Woerden 1994). HI surveys of dwarfs give peak column densities in the range of 1 to 3 cm-2 on scales of several hundred parsecs. In DDO 75 (Sextans A), the peak is cm-2 (Skillman, et al. 1988). In DDO 154, it is cm-2 (Carignan & Purton 1998), and in DDO 155, it is cm-2 (Lo et al., 1993). These column densities would correspond to several magnitudes of extinction for Milky Way gas, sufficient to allow the formation of molecules with self-shielding and dust-shielding. In dwarfs, however, the gas is still HI (presumably because of the low metal abundance), although there may be additional gas that is H2 also.
The peak HI mass column density in dwarf Irregulars is also larger than the stellar mass column density (Lo et al. 1993). This means that the pressure is easily estimated from the equation where gm cm-2, considering He and heavy elements. This is a lower limit to the mid-disk pressure because is a lower limit to the column density if there is also H2 in the clouds. For the observed range of peak column densities, cm-2, the pressure is in the range K cm-3. The upper range is about what is observed for the HII regions in Figure 2.
This result implies that a likely explanation for the relatively high HII region pressures shown in Figure 2 is a relatively high local column density of gas on the 100–300 pc scale of the star formation regions. The average HI column density in a dwarf Irregular is comparable to that in a giant spiral, but the large-scale peaks are much higher than the average in the dwarfs, and the valleys between the peaks are much lower than average.
Most of the HII regions in our dwarf galaxy sample are indeed where the HI column density exceeds cm-2. For NGC 2366, our HI data (Hunter, Elmegreen, & van Woerden 2000) has a resolution of 530 pc, which is too large to make a detailed comparison, but the supergiant HII region is clearly resolved on this scale, and it sits within an HI contour of cm-2. The other giant HII region to the west is to the side of an HI peak, but within a contour of cm-2. The collection of HII regions to the northeast sit around HI peaks and within a contour of cm-2. There is one HII region there that does not sit on a peak but is still within the cm-2 contour. A lone HII region to the extreme northeast is within a contour of cm-2. Off to the southwest there are two faint small HII regions that sit in a contour of cm-2. Thus, all but a few small HII regions are within an HI contour of about cm-2. There the pressure from the self-gravity of the local gas alone exceeds K cm-3, and can easily account for the confinement of the HII regions.
Similarly in DDO 50, the HII regions are in the HI clumps rather than in any of the HI holes, according to Figure 21 in Puche et al. (1992). Their HI beam size was 70 pc, but there are no contours for in Puche et al., so we cannot determine the self-gravitating pressures.
For DDO 75, Figure 5 in Hodge, Kennicutt, & Strobel (1994) shows the HII regions sketched on the HI contours of Skillman et al. (1988), where the beam size was 340 pc. A big HII complex to the east is offset from the center but still closely associated with an HI cloud, within a contour of about cm-2. The same is true for an H shell to the west, which is in another distinct HI cloud. Hodge et al. identify some HII regions between these two HI clouds, but our H image suggests they are filaments associated with the big HII complex. There are also smaller HII regions to the northeast of the big HII complex, but they also fall within the same big HI cloud.
In DDO 154, Carignan & Beaulieu (1989) mapped HI with a beam size of 870 pc. Their HI contour map (Fig. 8) is rather featureless, but it appears as if most of the HII regions lie within a contour of about cm-2. Carignan, Beaulieu, & Freeman (1990) also studied DDO 155 in HI with a beam size of 107 pc. We compared our H image to their HI map, and it appears that the HII regions are associated with HI peaks having cm-2. DDO 168 was mapped in HI by Broeils (1992) with a beam size of 320 pc. The HI contours on the optical image suggest that the HII regions are all within a contour of cm-2.
These HI column densities should be considered lower limits because of the additional molecular mass that is likely to be present in the HI cloud cores, because the HI can be optically thick in a cool center, and because the peaks in the HI are washed out by the relatively low resolution of most of the HI maps. The implication is that the pressures in the star-forming regions of dwarf Irregular galaxies are determined primarily by the self-gravities of the local HI concentrations. These pressures are comparable to those in the star-forming regions of giant spiral galaxies even though the background stellar disks have much lower column densities in the Irregulars, and even though the average pressures are much lower in the Irregulars.
The dominance of local gravity in regions of star formation would make these regions somewhat autonomous in the galactic environment. They would be like mini-galaxies inside the overall dwarf galaxy, possibly producing a patchy metallicity distribution if the wind and supernova ejecta get partially trapped. They could even remain coherent on a cosmological time scale, migrating around the disk, perhaps even into the nuclear region, where by continued star formation, they eventually make a bright nuclear cluster as in a nucleated dwarf elliptical (Sandage & Hoffman 1991; Phillips, et al. 1996).
The proposed increase in the local HI column density over the average used for equation (2) implies a lower scale height in regions of star formation than elsewhere. This would seem to contradict the discussion in Section 5 about the need for a scale height in the range of pc, but this is not the case. The density at a particular height above the midplane does not decrease much if the scale height decreases by a factor of following an increase in the local disk column density. This is because the mass density at a particular height is given by for mass column density and scale height . If increases, then decreases, making the exponential factor smaller, but the term in front of the exponential increases to compensate. For example, suppose the density at a height of 300 pc is required to be large in order to contain the observed giant shells and to account for the large inferred galaxy aspect ratios, as discussed in Section 5. If the scale height is assumed to be 300 pc in order to account for this high density using the average column density, then we can calculate what the density at that same height will be if the column density increases by various factors. The relative density at a fixed height varies with column density as , where the normalization gives the density relative to the value at one scale height before the variation in . For 1, 1.5, 2, 2.5, and 3, the density at the fixed height equals 1, 1.2, 0.89, 0.45, and 0.16. Thus, the gas column density all around a region of star formation can be higher than the galactic average at that radius by a factor of without seriously affecting the ability of the gas to contain giant shells, and without greatly affecting the galaxy aspect ratio at a fixed density.
7 Overpressure and Continued HII Region Expansion: The Origin of Giant Shells?
The similarity between the detection limit for HII regions and the lower limit of the densities plotted in Figure 2 suggests that there are probably more HII regions that are too faint to see. These would have lower pressures that could conceivably come all the way down to the average disk pressure.
The radius of a Strömgren sphere expanding into a uniform density increases with time as for sound speed and initial radius . For very late times, , and since to contain all of the recombination, . This implies that the time required for the density to drop by another factor of to reach pressure equilibrium is times longer than the average age of the oldest HII regions in the present study. Consequently, in a steady state, we could be missing 93% of the HII regions below the detection limit if they stay ionized that long. Moreover the volume of a Strömgren sphere increases as , so the summed volumes of all the HII regions could be larger than the observed volume by a factor of . This summed volume is enough to fill the entire disk and spill out into the halo. It follows that if the ISM in a dwarf galaxy has a pressure as low as the average disk pressure calculated in Section 3, then common HII regions should expand and merge to fill the entire disk.
The continued expansion of HII regions as a result of their large total pressures from ionization, supernovae, and stellar winds would lead to the slow creation of giant shells that have such a large volume filling factor that they could cover an entire dwarf galaxy. Shear will not distort these shells much because the rate of shear is relatively low. The disk will therefore be in a permanent state of severe disruption, possibly resembling the shell-filled galaxy Ho II (= DDO50; Puche et al. 1992). A significant amount of material should also flow into the halo, since the disk self-gravity is low if the average disk column density is low.
The ages of the giant shells in HoII could be large, perhaps times larger than the ages of the HII regions now seen in the disks if they continue to expand in a snowplow phase after the OB stars leave the main sequence. Such large ages, approaching My, imply that the central OB associations would have dispersed because of random stellar motions, and they would have lost their most massive stars because of stellar evolution. This appears to have been the case for the giant shell LMC4 in the Large Magellanic Cloud, which may have begun its expansion My ago at the site of what is now a dispersed cluster of A stars (Efremov & Elmegreen 1998). The lack of detection of OB associations or other clusters inside the shells of HoII (Rhode, et al. 1999) does not imply these shells had peculiar pressure sources. Common stellar pressures could have made them, as observed in some cases (Steward, et al. 2000). Such shells are expected if the average ISM pressure is times lower than the visible HII region pressures in these galaxies.
8 A Comparison Between Dwarf Irregulars and Giant Spirals
Section 6 suggested that dwarf galaxies have large pressure fluctuations in their disks resulting from highly irregular gas distributions, and that star formation systematically occurs at the positions of the giant cloud complexes, where the gas column density is locally high. Such clouds can confine the HII regions and give them a higher pressure than the average ISM at that radius, and they should also help to confine any giant shells that might be produced there, making them appear round even at a radius of several hundred parsecs. Such large-scale irregularities in the gas distribution make sense for dwarf galaxies, which are also irregular in their star formation, but why isn’t there a similar irregularity in giant spirals? Section 7 also suggested that without such systematic local confinement of the HII regions, there should arise a pervasive network of giant shells, filling the entire galaxy. What prevents this from happening in spiral galaxies?
There are three primary differences between dwarf Irregulars and giant spiral disks with regard to their ISM kinematics: the spirals have larger average surface brightnesses, they often have strong density waves, and they always have shear. These three differences contribute toward our perception that the pressures, threshold column densities, and gas morphologies are anomalous in dwarfs. Without shear or spiral waves, the giant clouds that are formed by turbulence compression and gravitational instabilities can remain for a long time as clumpy objects with locally high pressures and locally strong self-gravity. With the shear in a larger galaxy, these clouds are rapidly stretched and distorted. Pressure-driven shells can also become very large without shear and with the low background pressures implied by the low surface brightnesses of dwarfs. If there is no density wave, or a wave is very weak as in a flocculent galaxy, then the sheared clouds and their associated star formation take the form of short irregular spirals separated by low-density interspiral regions. In flocculent spiral arms, the peak gaseous column density and the pressure can be high, and the self-gravity can be strong, allowing stars and normal HII regions to form. Between the arms the pressure is low. This is similar to the situation in dwarfs except that the larger sizes of the spiral galaxies lead to more clouds and the shear makes these clouds spiral-like, but the pressure variations are the same.
When there are density waves in a large spiral galaxy, the wave modulates the overall gas dynamics and again prevents the gas from clumping into long-lived complexes. However, the way it does this is different than for flocculent galaxies. Inside a density wave arm, the shear is locally low, and the clouds and shells that form can avoid distortion. The clouds remain like clumps in the usual beads-on-a-string pattern (Elmegreen 1994) and the shells can become large, like several in the southern arm of M83. Spiral arm clumps are similar in size, mass, and gravitational self-binding to the gas concentrations in dwarf Irregulars (aside from overall scaling differences for the Jeans length – Elmegreen et al. 1996), but they are short-lived in the spirals because the flow-through time in the arm is short. The interarm region is a hostile environment for large clouds and shells: it tears them apart with heightened tidal forces and greater-than-average shear.
9 Warm and Cool Phases of Interstellar Gas
Another implication of a large-scale clumpy structure of HI in dwarf galaxies concerns the phase of the gas, i.e., whether cool clouds are allowed to exist in thermal equilibrium as a precursor to star formation. When the pressure is low, as in the outer parts of galaxies and in low surface brightness galaxies, the neutral interstellar gas is mostly in the warm phase; there is no cool phase except in regions with locally high pressures (Elmegreen & Parravano 1994). In fact, the outer regions of spiral galaxies are observed to be mostly in this pure-warm phase (Braun 1997). This means that star formation is not likely to begin in the extremely low pressure environment of a dwarf galaxy until a giant HI concentration forms, increasing the pressure up to a value that supports cool HI. This difficulty in forming stars explains the problem raised by Lo, Sargent, & Young (1993), namely how dwarf galaxies can remain so long at a low surface brightness without converting their abundant HI into stars. The solution is that the gas is usually in the warm phase and has to clump up gravitationally first in order to permit a cool phase of the neutral medium to form. High pressure, strong self-gravity, and star formation then follow. This is presumably why the star formation and HII regions in dwarf galaxies look remarkably normal even though the average galaxy is different from the Milky Way.
The existence of much of the HI gas in a warm state except where it is associated with star formation is consistent with the observations of DDO 69 (Leo A) by Young & Lo (1996). They found that there were two components of the HI: a broad-lined (9 km s-1) component that was observed everywhere and a narrower component (3.5 km s-1) near HII regions. They interpreted these two components as a warm and cold phase of the neutral gas. These two components are also observed in Sag DIG (Young & Lo 1997). The prevalence of the warm phase in dwarf galaxies also explains the anomalously high HI spin temperatures of HI (eg., Lo, Sargent, & Young 1993). Most of the gas on the periphery of a giant HI concentration and elsewhere in the disk is in the warm phase. Only the cores of the condensations have a high enough pressure to be cool. These cores should be highly molecular as well.
10 Conclusions
Near-equilibrium between the average pressures of old HII regions and the back-pressure of the local interstellar medium requires that dwarf galaxies have a larger disk column density in the vicinity of the star formation than the average at that radius observed in the form of HI or starlight emission. The mass enhancement is a factor of if the unseen material is gas-like and able to contribute to the ISM pressure directly, and a factor of if it is star-like or in the form of non-interacting cosmological particles, able to contribute only to the disk self-gravity.
A factor of enhancement in disk dark matter is close to the factor required to bind dwarf galaxies overall, as inferred from the rotation curves or virial velocities. This implies that a large fraction of the dark matter in a dwarf galaxy could be in the disk, contributing to the disk self-gravity in the perpendicular direction, and therefore to the overall gas pressure (through its effect on the scale height of the gas).
A direct measurement of such a contribution to the scale heights of these galaxies gave a negative result, however. The dark matter that contributes to the rotation cannot be in the disk or the scale height and disk aspect ratio would be much smaller than the observations permit. The dark matter is therefore in the halo, and the high pressure that may be confining the HII regions has to have another source.
We suggested that this source is the self-gravitational binding pressure from the clouds that formed the stars in the HII regions. Most of the gas in the optical disks of dwarf Irregular galaxies is concentrated in a small number of relatively large HI clouds. The cores of these clouds have large enough pressures to explain the anomaly with the HII regions. They can also account for other peculiarities about star formation in dwarfs, including the low average surface density threshold, and the suspected inability of the gas to make cool neutral clouds in a low pressure environment.
HII regions that are not confined by the large pressure from a surrounding cloud can expand into the low ambient pressure for a long time. Considering how far they have to go to reach pressure equilibrium in dwarf galaxies, there could be 10 times as many HII regions in dwarf galaxies than what we observe here, and their total volume filling factor could approach 100%. If this is the case, then the numerous giant shells observed in Ho II (DDO50) would be old expanded HII regions and wind-swept bubbles from star formation that took place as long as My ago. The associations would be difficult to see now.
Consideration of the differences between dwarfs and giant spiral galaxies clarifies the importance of pressure variations somewhat further. In flocculent spirals, giant clouds that may be analogous to the HI concentrations in dwarfs get sheared into spiral-like shapes, after which they are not readily recognized as having the same basic properties and formation mechanisms. In spirals with density waves, the high pressure HI is primarily in the arms. A lack of shear at the arm crests gives the HI concentrations a similar globular form to the giant HI clouds in dwarfs, but not necessarily a similar life time. Giant clouds are relatively short lived in spiral arms because of the changing pressure from the wave motion. They could in principle live much longer in dwarf galaxies.
A potentially important application of these results concerns the dispersal of the heavy elements that are made in the star-forming regions of dwarf Irregular galaxies. If the gravitational potential wells of these regions are as deep as those inferred here from the local HI column densities and the HII region pressures, then this dispersal may not be as straightforward as was once thought. Numerical modeling is required to determine what luminosities are needed for supernova- and wind-swept bubbles to break out of the high-pressure gas concentrations around each star-forming region, and get into the galaxy halo or the intergalactic medium.
| Galaxy | paaaPosition angles and inclinations are taken from the HI references. The exception is DDO 50 where the HI position angle did not make sense for the optical image; instead we used a position angle determined from the broad-band optical image. | iaaPosition angles and inclinations are taken from the HI references. The exception is DDO 50 where the HI position angle did not make sense for the optical image; instead we used a position angle determined from the broad-band optical image. | bbVelocity dispersion of the gas. Values in parenthesis are assumed; values for DDO 155 and DDO 50 are galaxy-wide averages. | HI Reference | Reference |
|---|---|---|---|---|---|
| (°) | (°) | (km/s) | |||
| DDO 50 | 30 | 40 | 6.8 | Puche et al. 1992 | Hunter, Elmegreen, & Baker 1998 |
| DDO 75 | 50 | 36 | 9.0 | Skillman et al. 1988 | Hunter & Plummer 1996 |
| DDO 154 | 38 | 57 | (9) | Carignan & Beaulieu 1989 | Carignan & Beaulieu 1989 |
| DDO 155 | 47 | 47 | 9.5 | Carignan et al. 1990 | Carignan et al. 1990 |
| DDO 168 | 328 | 76 | (9) | Broeils 1992 | Broeils 1992 |
| NGC 2366 | 32 | 73 | 15 | Hunter, Elmegreen, & van Woerden 2000 | Hunter, Elmegreen, & van Woerden 2000 |
| M=3.16 | 5 | 10 | |
|---|---|---|---|
| f | |||
| 1 | 11 | 26 | 101 |
| 0.316 | 7.4 | 16 | 58 |
| 0.1 | 6.3 | 11 | 35 |
| 0.0316 | 7.0 | 10 | 23 |
| 0.01 | 8.5 | 12 | 20 |
| Galaxy | P(HII) | P(disk) | |
|---|---|---|---|
| ( K cm-3) | ( K cm-3) | ||
| DDO50 | 30.2 | 4.3 | 7.1 |
| DDO75 | 35.2 | 3.2 | 11.0 |
| DDO154 | 10.8 | 2.1 | 5.2 |
| DDO155 | 41.9 | 0.8 | 55 |
| DDO168 | 22.2 | 4.9 | 4.5 |
| NGC 2366 | 29.6 | 2.0 | 14.8 |
References
- (1)
- (2) Beckman, J. E., Peletier, R. F., Knapen, J. H., Corradi, R. L. M., & Gentet, L. J. 1996, ApJ, 467, 175
- (3) Becquaert, J.F., & Combes, F. 1997, A&A, 325, 41
- (4) Berlind, A.A., Quillen, A.C., Pogge, R. W., & Sellgren, K. 1997, AJ, 114, 107
- (5) Bottema, R., Shostak, G.S., & van der Kruit, P.C. 1986, A&A, 167, 34
- (6) Boulanger, F. & Viallefond, F. 1992, A&A, 266, 37
- (7) Boulares, A., & Cox, D.P. 1990, ApJ, 365, 544
- (8) Braun, R. 1997, ApJ, 484, 637
- (9) Broeils, A. 1992, Ph.D. thesis, Rijksuniversiteit Groningen
- (10) Broeils, A., & van Woerden, H. 1994, A&AS, 107, 129
- (11) Carignan, C., & Freeman, K. 1988, ApJ, 332, 33
- (12) Carignan, C., & Beaulieu, S. 1989, ApJ, 347, 760
- (13) Carignan, C., Beaulieu, S., & Freeman, K. C. 1990, AJ, 99, 178
- (14) Carignan, C. & Purton, C. 1998, ApJ, 506, 125
- (15) Cayatte, V., Kotanyl, C., Balkowski, C., & van Gorkom, J. H. 1994, AJ, 107, 1003
- (16) Combes, F., & Pfenniger, D. 1997, A&A, 327, 453
- (17) Dekel, A., & Silk, J. 1986, ApJ, 303, 39
- (18) de Paolis, F., Ingrosso, G., Jetzer, P., Qadir, A., & Roncadelli, M. 1995a, A&A, 299, 647
- (19) de Paolis, F., Ingrosso, G., Jetzer, P., & Roncadelli, M. 1995b, A&A, 295, 567
- (20) de Vaucouleurs, G., de Vaucouleurs, A., Corwin, H., Buta, R., Paturel, G., & Fouqué, P. 1991, Third Reference Catalogue of Bright Galaxies (New York:Springer-Verlag)
- (21) Dickey, J.H., Hanson, M.M. & Helou, G. 1990, ApJ, 352, 522
- (22) Drissen, L., Roy, J.-R., Robert, C., Devost, D., & Doyon, R. 2000, AJ, 119, 688
- (23) Efremov, Y.N. & Elmegreen, B.G. 1998, MNRAS, 299, 643
- (24) Elmegreen, B.G. 1989, ApJ, 338, 178
- (25) Elmegreen, B.G. 1993, ApJ, 411, 170
- (26) Elmegreen, B.G. 1994, ApJ, 433, 39
- (27) Elmegreen, B.G. 1996, in New Extragalactic Perspectives in the New South Africa: Cold Dust and Galaxy Morphologies, ed. D. Block, Dordrecht: Kluwer, p. 468
- (28) Elmegreen, B.G., & Parravano, A. 1994, ApJ, 435, L121
- (29) Elmegreen, B.G., Elmegreen, D. M., Salzer, J. J., & Mann, H. 1996, ApJ, 467, 579
- (30) Elmegreen, B.G., & Efremov, Y.N. 1966, ApJ, 466, 802
- (31) Elmegreen, D.M. 1980, ApJS, 43, 37
- (32) Ferrara, A. 1993, ApJ, 407, 157
- (33) Evans, N. J., II, Rubin, R. H., & Zuckerman, B. 1980, ApJ, 239, 839
- (34) Habing, H.J., & Israel, F.P. 1979, ARAA, 17, 345
- (35) Hodge, P.W., & Hitchcock, J.L. 1966, PASP, 78, 79
- (36) Hodge, P., Kennicutt, R.C., & Strobel, N. 1994, PASP, 106, 765
- (37) Honma, M., Sofue, Y., & Arimoto, N. 1995, A&A, 304, 1
- (38) Hunter, D. A., Elmegreen, B. G., & Baker, A. 1998, ApJ, 493, 595
- (39) Hunter, D. A., Elmegreen, B. G., & van Woerden, H. 2000, in preparation
- (40) Hunter, D. A., & Hoffman, L. 1999, AJ, 117, 2789
- (41) Hunter, D. A., & Plummer, J. D. 1996, ApJ, 462, 732
- (42) Jog, C., & Solomon, P.M. 1984, ApJ, 276, 114
- (43) Kalberla, P. M. W., Shchekinov, Yu. A., & Dettmar, R.-J. 1999, A&A, 350, 9
- (44) Kennicutt, R.C., Jr. 1984, ApJ, 287, 116
- (45) Kennicutt, R.C., Jr. 1988, ApJ, 334, 144
- (46) Knapp, G.R. 1987, PASP, 99, 1134
- (47) Kormendy, J. 1988, in Origin, Structure and Evolution of Galaxies, ed. Fang Li Zhi (Singapore: World Scientific), p. 252.
- (48) Kuijken, K. & Gilmore, G. 1989, MNRAS, 239, 605
- (49) Kuijken, K. & Gilmore, G. 1991, ApJ, 367, L9
- (50) Lequeux, J. 1994, A&A, 287, 368
- (51) Lequeux, J., Allen, R. J., & Guilloteau, S. 1993, A&A, 280, L23
- (52) Lo, K.Y., Sargent, W.L.W., & Young, K. 1993, AJ, 106, 507
- (53) Loinard, L., Allen, R. J., & Lequeux, J. 1995, A&A, 301, 68
- (54) Malhotra, S. 1994, ApJ, 433, 687
- (55) Malhotra, S. 1994, ApJ, 448, 138
- (56) Merrifield, M. 1992, AJ, 103, 1552
- (57) Olling, R.P., & Merrifield, M.R. 2000, MNRAS, 311, 361
- (58) Osterbrock, D. E. 1974, Astrophysics of Gaseous Nebulae (San Francisco:W. H. Freeman and Co), p 17
- (59) Parker, E.N. 1966, ApJ, 145, 811
- (60) Pfenniger, D., Combes, F. & Martinet, L. 1994, A&A, 285, 79
- (61) Pfenniger, D., & Combes, F. 1994, A&A, 285, 94
- (62) Phillips, A.C., Illingworth, G.D., MacKenty, J.W., & Franx, M. 1996, AJ, 111, 1566
- (63) Pizagno, J., & Rix, H.-W. 1998, AJ, 116, 2191
- (64) Puche, D., Westpfahl, Brinks, E., & Roy, J-R. 1992, AJ, 103, 1841
- (65) Rhode, K.L., Salzer, J.J., Westpfahl, D.J., & Radice, L.A. 1999, AJ, 118, 323
- (66) Sandage, A., & Hoffman, G.L. 1991, ApJ, 379, L45
- (67) Shostak, G.S., van der Kruit, P.C. 1984, A&A, 132, 20
- (68) Skillman, E.D. 1985, in Star Forming Dwarf Galaxies, ed. D. Kunth, T.X. Thuan, & J.T.T. Van, Gif-sur-Yvette: Editions Frontiers, p. 263
- (69) Skillman, E. D., Terlevich, R., Teuben, P. J., & van Woerden, H. 1988, A&A, 198, 33
- (70) Smith, D.A., Allen, R.J., Bohlin, R.C., Nicholson, N., & Stecher, T.P. 2000, submitted to ApJ
- (71) Sodroski, T. J., Odegard, N., Arendt, R. G., Dwek, E., Weiland, J. L., Hauser, M. G., & Kelsall, T. 1997, ApJ, 480, 173
- (72) Spitzer, L., Jr., & Jenkins, E.B. 1975, ARAA, 13, 133
- (73) Stavely-Smith, L., Davies, R. D., & Kinman, T. D. 1992, MNRAS, 258, 334
- (74) Swatters, R. 1999, PhD Dissertation, Rijksuniversiteit, Groningen
- (75) Valentijn, E.A., & van der Werf, P.P. 1999, ApJ, 522, L29
- (76) van den Bergh, S. 1988, PASP, 100, 344
- (77) van der Kruit, P.C. 1981, A&A, 99, 298
- (78) van der Kruit, P.C., & Shostak, G.S. 1982, A&A, 105, 351
- (79) van der Kruit, P.C., & Shostak, G.S. 1984, A&A, 134, 258
- (80) van Zee, L., Haynes, M.P., Salzer, J.J., & Broeils, A.H. 1996, AJ, 112, 129
- (81) van Zee, L., Haynes, M.P., Salzer, J.J., & Broeils, A.H. 1997, AJ, 113, 1618
- (82) Walter, F. & Brinks, E. 1999, AJ, 118, 273
- (83) Stewart, S.G., Fanelli, M.N., Byrd, G.G., Hill, J.K., Westpfahl, D.J., Cheng, K.-P., O’Connell, R.W., Roberts, M.S., Neff, S.G., Smith, A.M., & Stecher, T.P. 2000, ApJ, 529, 201
- (84) Wilson, T. L., & Mauersberger, R. 1994, A&A, 282, L41
- (85) Young, L. M., & Lo, K. Y. 1996, ApJ, 462, 203
- (86) Young, L. M., & Lo, K. Y. 1997, ApJ, 490, 710
- (87) Youngblood, A. J., & Hunter, D. A. 1999, ApJ, 519, 55
- (88)