1E 0117.2-2837 and the NLR of Narrow-Line Seyfert 1 galaxies
Abstract
Based on photoionization calculations we present a study of the NLR emission line ratios of Narrow-line Seyfert 1 (NLS1) galaxies. In particular, we investigate the influence of different EUV - soft-X-ray spectral shapes (a giant soft excess, a steep X-ray powerlaw, the presence of a warm absorber) and NLR cloud properties (density, abundances, distance from the continuum source) on the predicted optical emission-line ratios like [OIII] and [FeXIV].
keywords:
AGN, emission lines, photoionization models, NLS1 galaxies, individual: 1E 0117.2-2837, ,
1 Introduction
Narrow Line Seyfert 1 (NLS1) galaxies have recently received much attention due to their unusual optical–X-ray properties which are not yet well understood. Photoionization models of the circum-nuclear emission/absorption regions allow us to investigate scenarios to explain the main characteristics of NLS1s, i.e., (i) extremely steep X-ray spectra within the ROSAT energy band, (ii) narrow (FWHM 2000 km/s) Balmer lines and strong FeII emission, and (iii) weak forbidden lines except for some relatively strong high-ionization iron lines. Here, we concentrate on (iii); for a discussion of (i) and (ii) see Komossa & Fink (1997a), and Komossa & Meerschweinchen (2000). In particular, we study the influence of different EUV - soft-X-ray spectral shapes (a giant soft excess, a steep X-ray powerlaw, the presence of a warm absorber) and NLR cloud properties (density, abundances, and distance from the nucleus) on the predicted optical emission-line ratios. First results of this study were presented by Komossa & Janek (1999).
2 1E 0117.2-2837
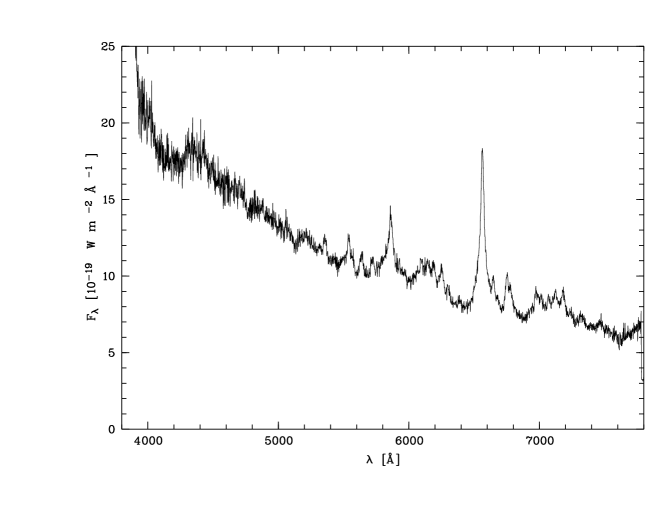
1E 0117.2-2837 (QSO 0117-2837) was discovered as an X-ray source by Einstein and is at a redshift of =0.347 (Stocke et al. 1991, Grupe et al. 1999). Its X-ray spectrum is extremely steep (see Komossa & Meerschweinchen 2000 for a detailed X-ray analysis of this source). We have obtained new optical spectra of 1E 0117.2-2837 with the ESO 1.52 m telescope at LaSilla, in September 1995. The optical spectrum reveals several signs of a NLS1 galaxy (we do not distinguish between NL Seyferts and NL quasars, here): weak [OIII]5007 emission and strong FeII complexes (Fig. 1). After subtraction of the FeII spectrum (see Grupe et al. 1999 for details) we derive FWHMHβ=2100 km/s, FWHM[OIII]=820 km/s (based on single-component Gaussian fits to the emission lines; this leaves some broad wings as residuals), and the ratio [OIII]/H=0.056.
3 The NLR of NLS1 galaxies: results from photoionization modeling
The narrow emission lines, i.e. those originating from the narrow line region (NLR), like [OIII]5007 and [OI]6300, are rather weak in 1E 0117.2-2837 and in NLS1 galaxies in general. Occasionally, however, fairly strong high-ionization iron lines are present. We investigate several models to explain these observations, starting with the assumption that the NLR is ‘normal’ (i.e. a typical type 1 Seyfert, as far as distance from the nucleus, gas density and covering factor are concerned). All photoionization calculations were carried out using the Cloudy code (Ferland, 1993).
In the first step, non-solar metal abundances were assumed. Over abundant metals (with respect to the solar value) were shown to delay the complete removal of a BLR multiphase equilibrium (Komossa & Meerschweinchen 2000). Due to their rather strong influence on the cooling, metals, if overabundant, can lead to weaker optical line emission. However, we find the effect to be insufficient to explain the observed line intensities.
As shown in Komossa & Schulz (1997), the weak [OIII]5007 domain of the line correlations in the usual diagnostic diagrams of Seyfert 2 galaxies can be explained by very steep EUV continua with –2.5. Although, e.g., the NLS1 RX J1225.7+2055 indeed exhibits a rather steep EUV spectrum (determined by a powerlaw connection between the flux at the Lyman limit and 0.1 keV), that of RX J1239.3+2431 is very flat (Greiner et al. 1996).
Placing warm absorbing material along the line of sight to the NLR would make the latter see a continuum that is only modified in the soft X-ray region, with negligible influence on the line emission. The same holds for an intrinsically steep X-ray powerlaw, which only leads to a slight weakening of the low-ionization lines.
In cases where a warm absorber is present, the high-ionization iron lines ([FeX] and higher) can be produced within the warm gas itself (see Komossa & Fink 1997a,b,c for details). However, no one-to-one match between the observed coronal lines in the NLS1 NGC 4051 and those predicted to arise from the X-ray warm absorber in this galaxy was found (Komossa & Fink 1997a, and these proceedings), suggesting that in general, the coronal line and warm absorber regions are separate components.
In order to assess the influence of a strong EUV - soft-X-ray excess on optical line emission, we have calculated a sequence of models with an underlying mean Seyfert continuum plus a black body of varying temperature, for a range of densities and distances of the NLR gas from the central continuum source. Although the contribution of a hot bump-component can considerably strengthen the high-ionization iron lines (eg. [FeX]6374, [FeVII]6087 and [FeXIV]5303), reflecting the fact that their ionization potentials are at soft X-ray energies, these models overpredict the [OIII] emission.
We conclude that the weakness of forbidden lines in NLS1s must be due to an overall lower emissivity of the NLR. If this is caused by shielding of the NLR from ionising photons, the model must avoid boosting the low-ionization lines like [OII]. More likely, the region is gas poor, i.e. less of the impinging photons can be reprocessed into line emission. ‘Normal’ line ratios would then result in weak forbidden lines being undetected. For those objects with strong high-ionization (iron) lines, models favor the dominance of low-density gas and small distances to the ionizing source.
Acknowledgements:
We thank Gary Ferland for providing Cloudy.
Preprints of this and related papers can be retrieved from our webpage
at
http://www.xray.mpe.mpg.de/skomossa/
References
- (1) Ferland G.J., 1993, Univ. of Kentucky, Phys. Department, Int. Report
- (2) Greiner J., et al., 1996, A&A 310, 384
- (3) Grupe D., et al., 1999, A&A 350, 805
- (4) Komossa S., Fink H., 1997a, A&A 322, 719
- (5) Komossa S., Fink H., 1997b, in ‘Emission Lines in AGN: New Methods and Techniques’, B.M. Peterson et al. (eds), ASP conf. ser. 113, 246
- (6) Komossa S., Fink H., 1997c, Lecture Notes in Physics 487, 250
- (7) Komossa S., Schulz H., 1997, A&A 323, 31
- (8) Komossa S., Janek M., 1999, Astron. Nachrichten 320, 310
- (9) Komossa S., Meerschweinchen J., 2000, A&A 354, 411
- (10) Stocke J.T., et al., 1991, ApJS 76, 813