FOS Observations of Four NLS1s
Abstract
Ultraviolet through optical spectroscopy of four NLS1s shows strong absorption features in the high-ionization UV resonance lines such as C IV, N V, and Si IV. Mg II is not absorbed. The absorption could originate in the warm absorber.
1 Introduction
We observed four NLS1s with the HST Faint Object Spectrograph (FOS). Spectra were obtained on consecutive orbits to provide near-simultaneous coverage from the UV through the optical (). The effects of variability should be minimized in these data. Three of the targets, Mrk 493, WPVS007, and RX J, show strong optical Fe II emission and weak [O III] narrow-line emission. Two objects, WPVS007 and RX J, show steep X-ray spectra and large X-ray variability. Two, Akn 564 and RX J, have been reported to have warm X-ray absorbers.
The original goals were: (a) to calculate physical parameters of the gas from the diagnostic UV emission lines, (b) to study the UV iron-line complexes, and (c) to obtain a good piece of the spectral energy distribution (SED).
2 UV Absorption
We found strong absorption in the UV resonance lines in three of the four NLS1s: Akn 564, WPVS007, and RX J. In the fourth, Mrk 493, asymmetric UV line profiles may hint at weak absorption on the red side of the line (discussed below). The absorption is seen at low velocities in high-ionization lines such as Ly, N V, Si IV, and C IV, but not in lower-ionization lines such as Mg II .
2.1 Akn 564
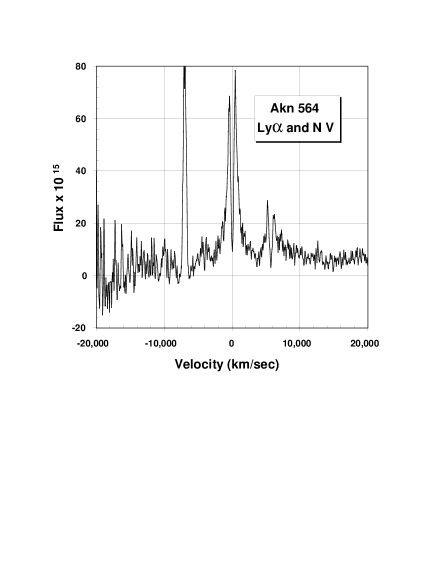
Figure 1 shows the Ly/N V region of the FOS spectrum. The zero-point of the velocity scale was determined from the H emission line, which does not show absorption. Note the strong, zero-velocity absorption in both Ly and the N V doublet. In the latter case there is some evidence that the absorption extends below the local continuum level, but this should be confirmed with higher resolution, higher S/N spectroscopy.
There are two observational effects of such absorption. First, a spectrum with poorer S/N and/or poorer resolution may not resolve the absorption feature. However, the resulting line profile would look broader than the true emission line profile, since the absorption is removing flux near the line center. Secondly, it becomes highly problematic to determine the original emission line flux, and hence to determine physical parameters (density, ionization parameter, etc.) of the emission-line gas from the UV resonance lines.
A footnote about this region of the spectrum. At km s-1 there is an apparent, weak emission line with central absorption. The combination of emission and absorption makes this identification as a weak line reasonably secure, and the sharpness of the absorption feature allows us to pinpoint the wavelength: Å. A search of wavelengths of known high ionization resonance lines near this wavelength indicates that this may be S V] , although this identification must be considered tentative.
2.2 WPVS007
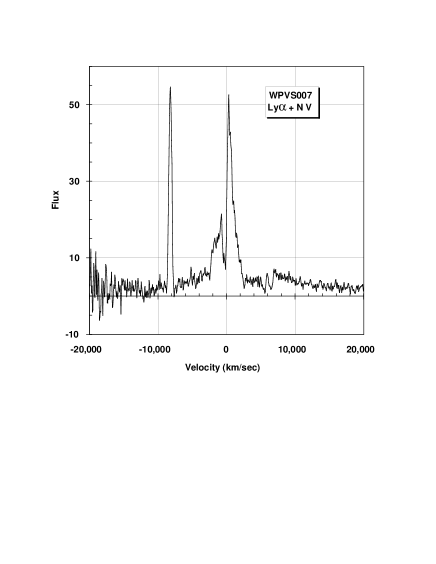
WPVS007 (Fig. 2) shows absorption similar to that seen in Akn 564. It is slightly blue-shifted, with a second component seen near km s-1.
2.3 RX J0134–42
RX J is unusual, showing very weak emission lines and apparently red-shifted absorption. It is the faintest of the four NLS1s observed, and our spectrum (Fig. 3) is of lower quality. There is clear absorption in the C IV line, and the N V line profile (not shown) is consistent with somewhat weaker absorption. It is worth noting that emission seen at is most likely blue-shifted N V emission, corresponding closely to the blue-shifted C IV emission peak seen in Fig. 3. There is apparently no sign of Ly emission!
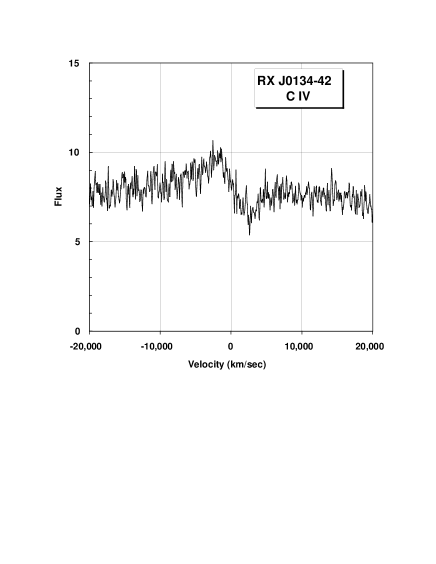
Red-shifted absorption is rather unusual in AGN. Blue-shifted absorption from outflows lying in front of the AGN’s continuum source is common and sometimes occurs at very high velocities (e.g. broad-absorption line QSOs), but red-shifted absorption is rare and generally occurs only at low velocities. The occurrence of strong red-shifted absorption in RX J supports the interpretation of the blue asymmetries seen in some NLS1 UV emission lines (e.g. Mrk 493, not shown in this contribution) as being formed by weaker red absorption, rather than a broad blue wing from the emission source.
2.4 Discussion
Note that the high incidence of UV absorption in our sample differs from that of the Leighly sample presented at this conference. Small number statistics could be at work, or there could be some difference in the selection criteria. Luminosity has been suggested as one possible difference.
3 Relationship to the Warm Absorber
X-ray spectra of Akn 564 were presented at this conference which were variously interpreted as showing absorption at 1 keV, emission at 1 keV, or a lack of any features. This may be a result of X-ray variability, but clearly higher spectral resolution and signal-to-noise is needed in order to derive physical parameters such as the ionization level. This can be compared to the ionization level apparent in the UV absorber. Currently there seems to be no compelling evidence that to conclude that the two absorbers are different. Given the large X-ray variability in some NLS1s, it seems reasonable to obtain multi-epoch UV observations to search for variability of both the emission and absorption features seen in our FOS data.
The argument has been made that the X-ray absorber cannot be outflowing at the high velocities typical of, e.g., broad-absorption line QSOs, without carrying a major fraction of the energy of the AGN in kinetic form. In the NLS1s studied here, however, the UV absorption shows only very low velocities, so the kinetic content of the gas is not a problem.
4 Spectral Energy Distributions (SEDs)
Few near-simultaneous SEDs of NLS1s have been published. With the extremes of X-ray variability seen in some objects, simultaneity is a major concern. Grupe et al. (1995) show an optical-to-X-ray SED of WPVS007. Our optical-to-UV SED is redder than theirs, but we have no corresponding X-ray data. With the large number of optical telescopes available, it seems a shame not to obtain at least optical spectra simultaneous with future X-ray observations.
References
- (1) Grupe, D., Beuerman, K., Mannheim, K., Thomas, H.-C., Fink, H. H., and de Martino, D. 1995, A&A, 300, L21.