Variability of NGC 4051 and the Nature of Narrow-Line Seyfert 1 Galaxies
Abstract
We report on a three-year program of coordinated X-ray and optical monitoring of the narrow-line Seyfert 1 galaxy NGC 4051. The rapid continuum variations observed in the X-ray spectra are not detected in the optical, although the X-ray and optical continuum fluxes are correlated on time scales of many weeks and longer. Variations in the flux of the broad H line are found to lag behind the optical continuum variations by approximately 6 days (with an uncertainty of 2–3 days), and combining this with the line width yields a virial mass estimate of , at the very low end of the distribution of AGN masses measured by line reverberation. Strong variability of He ii is also detected, and the response time measured is similar to that of H, but with a much larger uncertainty. The He ii line is almost five times broader than H, and it is strongly blueward asymmetric, as are the high-ionization UV lines recorded in archive spectra of NGC 4051. The data are consistent with the Balmer lines arising in a low-inclination (nearly face-on) disk-like configuration, and the high-ionization lines arising in an outflowing wind, of which we observe preferentially the near side. During the third year of monitoring, both the X-ray continuum and the He ii line went into extremely low states, although the optical continuum and the H broad line were both still present and variable. We suggest that the inner part of the accretion disk may have gone into an advection-dominated state, yielding little radiation from the hotter inner disk.
keywords:
Black hole masses; accretion disk; optical emission-line variability1 Introduction
Beginning in early 1996, the International AGN Watch111All International AGN Watch papers and data are available at the AGN Watch website at URL http://www.astronomy.ohio-state.edu/agnwatch/. undertook a program of contemporaneous X-ray and optical spectroscopic monitoring of the galaxy NGC 4051, the only NLS1 galaxy in Seyfert’s Sey43 original list of high surface-brightness galaxies with strong emission lines. The X-ray variability characteristics of NGC 4051 are typical of the NLS1 class Law87 ; McH95 . X-ray observations were made with the Rossi X-Ray Timing Explorer (RXTE), and optical spectra were obtained with the Perkins 1.8-m telescope at Lowell Observatory and the 1.6-m Tillinghast Reflector on Mt. Hopkins. The purpose of this program has been twofold:
-
1.
To determine the nature of the relationship between the X-ray and UV–optical continuum variations. This is a particularly interesting question in the case of NGC 4051 since the X-ray flux dropped to an extremely low level towards the end of this campaign Utt99 .
- 2.
The emission-line cross-correlation lag can be taken to be the light-travel time across the BLR, so the BLR size is given by . By combining this with the emission-line width , the mass of the central source can be inferred to be
| (1) |
where is a factor of order unity that depends on the still unknown geometry and kinematics of the BLR. There is an implicit assumption that the gravitational force of the central object dominates the kinematics of the BLR; this is formally unproven, but at least in the case of the well-studied Seyfert 1 galaxy NGC 5548, the reverberation-mapping data are consistent with the required relationship Pet99 . Virial mass estimates based on reverberation-mapping data are now available for nearly 40 AGNs Wan99 ; Kas00 .
2 Results
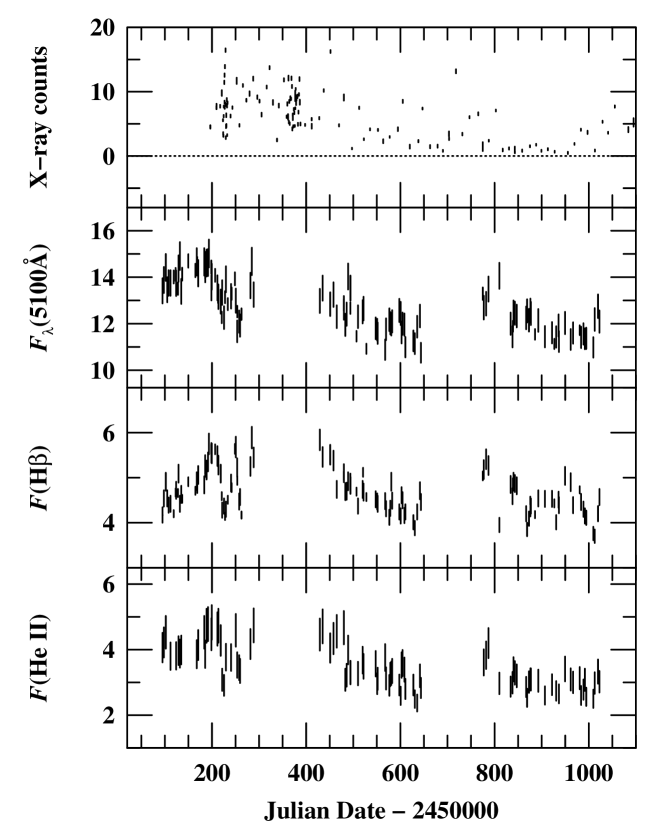
In Fig. 1, we show the continuum and emission-line light curves obtained during this three-year program. While there is a clear lack of correlated short time-scale behavior of the X-ray and optical continua, the light curves in Fig. 1 suggest that a correlation on longer time scales is possible. To test this quantitatively, we have suppressed the rapid variations, smoothing both the optical continuum and X-ray light curves with a rectangular function of width 30 days, similar to what was done in a comparison of X-ray and optical variability in the Seyfert 1 galaxy NGC 3516 Mao00 . Cross-correlation of the overlapping parts of these light curves yields a lag of the optical variations relative to the X-ray of days with a correlation coefficient , i.e., the mean X-ray and optical fluxes are indeed correlated once the high-frequency variability is suppressed. The lag between variations in the two wavebands is highly uncertain, but consistent with zero or any small time lag expected in the continuum emitting region.
The time delay between continuum and emission-line variations has been determined by cross-correlation of the light curves. The period from JD2450183 to JD2450262 is particularly well-suited to this type of analysis because the light curves are well-sampled and the character of the variations permits an accurate cross-correlation measurement. The time delays, or lags, we measure are days for H and days for He ii , where the uncertainties are based on a model-independent Monte Carlo method Pet98 .
By combining this lag with the Doppler width of the emission line, we can estimate a virial mass, as in eq. (1); for consistency with previous work Wan99 ; Kas00 , we take . Since the broad emission-line features are comprised of a number of different components (or contaminants), it is desirable to measure the Doppler width of only the variable part of the emission line. In order to isolate the variable part of the emission line and exclude constant components (such as contamination from the narrow-line region), we measure the relevant line widths in the root-mean-square (rms) spectrum constructed from the spectra used to determine the time lag; the principal virtue of the rms spectrum is that it isolates the features in the spectrum that are actually varying. We measure widths km s-1 for H, and km s-1 for He ii ; the latter is also strongly blueward asymmetric. Examination of archival IUE spectra show that the UV high-ionization lines are similarly asymmetric. On the basis of the H variations, a virial mass of is inferred; unfortunately however, the extremely large uncertainty in the He ii lag renders the virial mass obtained from it not very enlightening (i.e., ), but it is consistent with the H result. It is also important to keep in mind that because of the unknown geometry and kinematics of the BLR, the virial mass is reliable to only about an order of magnitude, i.e., the systematic uncertainties are much larger than the errors quoted here.
3 Discussion
3.1 The Continuum
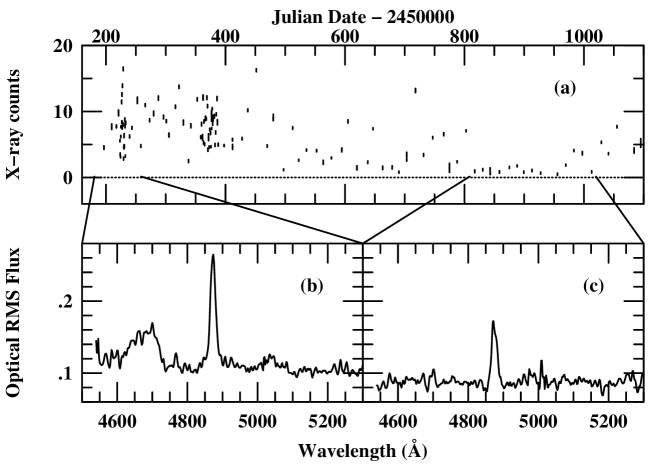
It has already been pointed out based on these same RXTE data Utt99 that the X-ray continuum of NGC 4051 virtually “turned off” in early 1998. However, the optical spectroscopic data show that the optical continuum and emission lines (and therefore, by inference, the ionizing UV continuum) did not disappear at the same time. Figure 2a shows the RXTE light curve. The two lower panels of Fig. 2 show the optical rms spectra based on data obtained during the intervals marked on Fig. 2a. Figure 2b shows the rms spectrum obtained during a period of relatively active X-ray and optical continuum variability. The rms spectrum in Fig. 2c is based on spectra obtained during the period when the X-rays were about an order of magnitude fainter than normal. Figure 2b shows that when the X-ray flux was high and variable, the optical continuum and the H and He ii emission lines were also variable. Figure 2c, however, shows that when the X-rays were in a faint state, both the optical continuum and the H line were still varying, but the He ii emission line was no longer varying. A possible interpretation of the behavior of NGC 4051 is that the inner X-ray producing part of the accretion disk has entered an advection-dominated accretion-flow (ADAF) state, in which radiation is emitted with very low efficiency Nar94 ; Nar98 . The outer part of the disk, which produces the UV–optical continuum and drives the emission lines, remains relatively unaffected, however. The implication is that there is a transition radius inside of which the disk is an ADAF and outside of which it radiates efficiently, perhaps like a classical thin disk Sha73 , and the persistence of the optical continuum and the H emission line suggests that this transition radius is somewhere between the regions that are most responsible for the soft X-rays and the H-ionizing continuum.
3.2 The Virial Mass and Implications for NLS1s
Reverberation-based size estimates for the broad emission lines and resulting virial mass estimates provide a potential means of distinguishing among the various NLS1 models. In Fig. 3a, we show the relationship between the BLR radius as measured from the Balmer-line lags as a function of the optical continuum luminosity for all AGNs with Balmer-line lags known to reasonable accuracy Wan99 ; Kas00 . This compilation contains six additional AGNs that could be classified as NLS1s as they meet the criterion km s-1. The best-fit regression line (), based on all objects (excluding NGC 4051), is shown as a dotted line. NGC 4051 lies approximately 2.8 above this regression line, although all the other narrow-line objects clearly fall in the locus defined by the AGNs with broader lines. Given the large dispersion in this relationship, reflected in the high of the fit, the offset of NGC 4051 is not unusual.
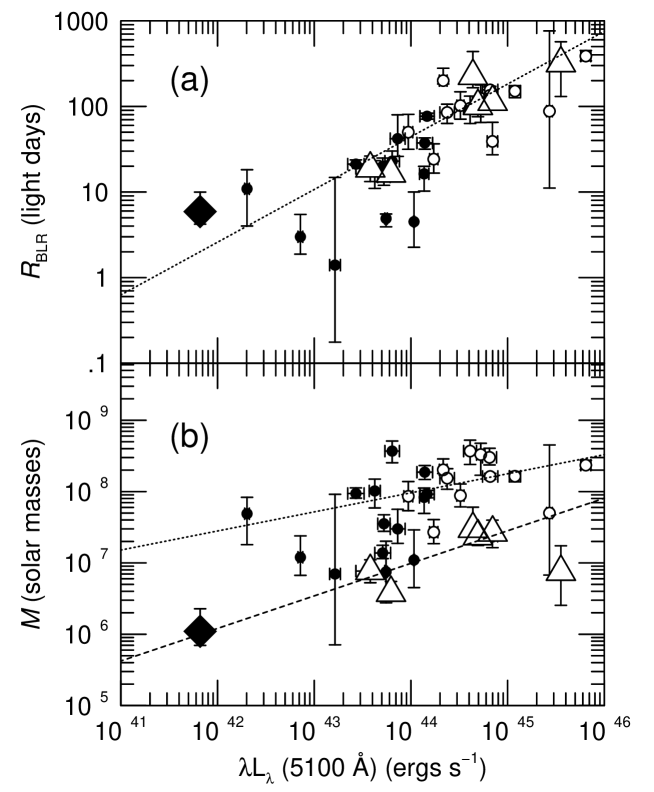
Figure 3b shows the mass–luminosity relationship for these AGNs. We show (a) the best-fit regression line based on all objects except the seven narrow-line objects and (b) that based on the narrow-line objects alone. These two fits are separated by typically an order of magnitude in black-hole mass; the black holes in the narrow-line objects are about a factor of 10 lower than those of other AGNs of comparable luminosity.
How well do these results allow us to distinguish among the various explanations for the NLS1 phenomenon? We consider the possibilities:
-
1.
Do the BLRs of NLS1s have anomalously large radii? The position of NGC 4051 in Fig. 3a might suggest that this is possible, but the distribution of other narrow-line objects does not support this. Furthermore, as noted above, the scatter in the BLR-radius luminosity relationship is very large, and NGC 4051 is in a statistical sense not the largest outlier in this relationship (simply because other sources have smaller uncertainties in their measured lags).
-
2.
Are NLS1s simply low-inclination systems? If the BLR is a flattened system, at low inclination (i.e., nearly face-on) the line widths will be decreased by a factor , but the measured emission-line lags will be relatively unaffected. On the other hand, assuming that the UV–optical continuum arises in an accretion disk at the same inclination, the apparent UV–optical luminosity is higher at lower inclination. Thus, relative to similar sources at intermediate inclination, the masses of low-inclination sources will be underestimated, and their luminosities will be overestimated, displacing the narrow-line objects in Fig. 3b towards the lower right. This is generally consistent with the location of all seven of the narrow-line objects, including NGC 4051. The line transfer function for H would provide a more definitive test of this hypothesis since it would allow determination of the inclination of the system. This would require more and better data than we have obtained in this experiment.
-
3.
Are NLS1s undermassive systems with relatively high accretion rates? Again, the distribution of the narrow-line objects, including NGC 4051, in Fig. 3b is consistent with this hypothesis. The narrow-line sources on this plot lie below the mass-luminosity relationship for other AGNs, at the lower end of the envelope around this relationship.
In summary, the hypothesis that NLS1s have unusually distant BLRs for their luminosity is probably not viable in general, although it could apply to the specific case of NGC 4051. At the present time, however, we cannot distinguish between the low-inclination and low-mass, high accretion-rate hypotheses on the basis of the reverberation results alone, although considerations based on X-ray data favor the latter. Indeed, it is entirely possible that both effects (i.e., low inclination and low black-hole mass) contribute. An improvement in the quality and quantity of the optical spectroscopic data could allow determination of the H transfer function, which could allow discrimination between these competing models.
The differences between the characteristics of the H emission line on one hand and of the high-ionization lines such as He ii on the other suggests a two-component BLR, which has been proposed on numerous occasions on other grounds Col88 . In this particular case, an interpretation that is at least qualitatively consistent with all the data and relatively simple is that the Balmer lines arise primarily in material that is in a flattened disk-like configuration at a low inclination (to account for the narrow width of the H line), and the high-ionization lines arise in an outflowing polar wind, of which we see preferentially the component on the near side of the disk (to account for high velocity and blueward asymmetry) Col88 . If indeed the H emission arises primarily in a low-inclination disk, our virial mass estimate of might seriously underestimate the black-hole mass. It could then be inferred that the NLS1 class might be best explained as low-inclination rather than low-mass, high accretion-rate systems. The strong rapid X-ray variability of NLS1s seem to favor the latter explanation, but we note that at least some low-inclination accretion-disk models predict relatively strong, variable EUV/soft X-ray fluxes Net87 ; Mad88 , consistent with observations of NLS1s.
4 Summary
On the basis of three years of combined X-ray and optical spectroscopic monitoring of the narrow-line Seyfert 1 galaxy NGC 4051, we reach the following conclusions:
-
1.
The rapid and strong X-ray variations that characterize narrow-line Seyfert 1 galaxies are detected in our X-ray observations of NGC 4051, but are not detected in the optical, consistent with previous findings Don90 .
-
2.
On time scales of many weeks and longer, there does appear to be a correlation between the X-ray and optical continuum fluxes.
-
3.
The variable part of the H emission line has a Doppler width of about km s-1, and a time delay relative to the continuum of about six days. Combining these quantities leads to a virial mass estimate of approximately .
-
4.
The He ii emission line is strongly variable, although an accurate time delay cannot be measured. This line is about five times as broad as the H line, and is strongly blueward asymmetric, as are the UV high-ionization lines in this object.
-
5.
In the BLR radius–luminosity relationship, we find that narrow-line objects (those with km s-1) seem to fall on the same locus as AGNs with broad lines.
-
6.
In the virial mass–luminosity relationship, narrow-line objects populate the low-mass end of a rather broad envelope; they have virial masses typically an order of magnitude lower than other AGNs of similar luminosity.
-
7.
During the third year of this program, both the X-rays and He ii nearly disappeared, while the optical continuum and broad H emission line were only slightly fainter than previously and continued to vary significantly. This suggests that the innermost part of the accretion disk went into an ADAF state, greatly reducing the production of high-energy continuum photons from the inner part of the accretion disk.
A picture that is consistent with the emission-line characteristics is one in which the Balmer lines arise primarily in a disk-like configuration seen at low inclination (i.e., close to face-on), and the high-ionization lines arise primarily in an outflowing polar wind. The high-ionization lines are blueward asymmetric because we see emission preferentially from the near side, with the far side at least partially obscured by the disk component (which might be an extension of the accretion disk). If this interpretation is correct, the virial mass estimate of is lower than the actual black hole mass by a factor of . If NGC 4051 is typical of the NLS1 class, then it might be that NLS1s are best described as low-inclination rather than low-mass, high accretion-rate systems. While the observed X-ray characteristics of NLS1s rather favor the latter explanation, they are not inconsistent with an inclination-based origin. Indeed, the full explanation of the phenomenon may involve both inclination and black-hole mass.
For support of this work, we are grateful to the National Science Foundation (grant AST–9420080 to The Ohio State University).
References
- (1) Blandford, R.D., & McKee, C.F. 1982, ApJ, 255, 419
- (2) Collin-Souffrin, S., Dyson, J.E., McDowell, J.C., & Perry, J.J. 1988, MNRAS, 232, 539
- (3) Done, C., Ward, M.J., Fabian, A.C., Kunieda, H., Tsuruta, S., Lawrence, A., Smith, M.G., & Wamsteker, W. 1990, MNRAS, 243, 713
- (4) Kaspi, S., et al. 2000, ApJ, in press (astro-ph/9911476)
- (5) Lawrence, A., Watson, M.G., Pounds, K.A., & Elvis, M. 1987, Nature, 325, 694
- (6) Madau, P. 1988, ApJ, 327, 116
- (7) Maoz, D., Edelson, R., & Nandra, K. 2000, AJ, in press (astro-ph/9910023)
- (8) McHardy, I.M., et al. 1995, MNRAS, 273, 549
- (9) Narayan, R., Mahadevan, R., Grindlay, J.E., Popham, R.G., & Gammie, C. 1998, ApJ, 492, 554
- (10) Narayan, R., & Yi, I. 1994, ApJ, 428, L13
- (11) Netzer, H. 1987, MNRAS, 225, 55
- (12) Peterson, B.M. 1993, PASP, 105, 247
- (13) Peterson, B.M., et al. 1998, PASP, 110, 660
- (14) Peterson, B.M., & Wandel, A. 1999, ApJ, 521, L95
- (15) Seyfert, C. 1943, ApJ, 97, 28
- (16) Shakura, R.I., & Sunyaev, R.A. 1973, A&A, 24, 337
- (17) Uttley, P., et al. 1999, MNRAS, 307, L6
- (18) Wandel, A., Peterson, B.M., & Malkan, M.A. 1999, ApJ, 526, 579