The Mass Assembly and Star Formation Characteristics of Field Galaxies of Known Morphology
Abstract
We discuss a new method for inferring the stellar mass of a distant galaxy of known redshift based on the combination of a near-infrared luminosity and multi-band optical photometry. The typical uncertainty for field galaxies with in the redshift range is a factor 2. We apply this method to a newly-constructed sample of 321 field galaxies with redshifts and Hubble Space Telescope morphologies enabling us to construct the stellar mass density associated with various morphologies as a function of redshift. We find a marked decline with time in the stellar mass associated with peculiar galaxies accompanied by a modest rise in that observed for ellipticals. The result suggests that peculiars decline in abundance because they transform and merge into regular systems. The star formation rate per unit stellar mass indicates that massive systems completed the bulk of their star formation before redshift one, whereas dwarfs continue to undergo major episodes of activity until the present epoch.
1 Introduction
Our understanding of the evolution of galaxies during the important redshift range has advanced significantly in recent years through the completion of statistically-complete redshift surveys (Lilly et al 1995, Ellis et al 1996) and the association of these data with morphological information from Hubble Space Telescope (HST, Brinchmann et al 1998, B98). This progress has been mirrored by the formulation of detailed semi-analytic models which attempt to reproduce the observational trends in the context of hierarchical galaxy formation (Baugh et al 1998; Kauffmann et al 1999).
One of the most intriguing results from HST imaging and ground-based spectroscopy is that the steep slope in the blue number counts arises from a surprisingly abundant population of irregular, star-forming galaxies whose local counterparts are unclear (Glazebrook et al. 1995). Such galaxies contribute a negligible amount to the local rest-frame blue luminosity density (Marzke et al 1998) but equal the contribution of regular spirals at redshifts 1 (B98). In hierarchical models, “morphologies” transform according to the mass characteristics of mergers. Recent merging leads to growth in regular systems at the expense of lower mass irregulars (Baugh et al 1998).
It is observationally difficult to verify this hypothesis using traditional methods based on magnitude-limited morphological counts, not only because galaxies transform from one kind to another but also since they presumably brighten in optical luminosity as they merge. To make progress we require an independent ‘accounting variable’ capable of tracking the likely assembly and transformation of galaxies during the interval . The colour and emission line characteristics are transient properties and poorly-suited for this purpose (Glazebrook et al 1999). Ideally we seek a quantity that is readily observable but unaffected by morphological transformations and mergers.
The dynamical or stellar mass is the obvious choice. The former is directly connected to theoretical predictions but difficult to observe except in favourably oriented regular systems (e.g. Vogt et al 1997). The stellar mass is less well-determined by theory but has the very considerable advantage that it can be derived robustly for complete samples of galaxies arranged morphologically using multi-band optical and near-infrared (near-IR) photometry enabling a complete inventory to be made for each type at various epochs. Since stellar mass is either conserved, or a slowly increasing quantity, it enables us to track the fate of the abundant irregular systems.
This paper is concerned with demonstrating the promise of this technique and its initial application to a statistically-complete sample of field galaxies of known redshift. We have adopted a cosmological model with , and throughout but our results are not sensitive to this choice.
2 Infrared Photometry for a Complete HST-based Sample
Our dataset is an extension of that introduced by B98 which resulted from HST imaging of the CFRS and LDSS redshift surveys. The key features are spectroscopic redshifts for a statistically-complete sample with WFPC-2 imaging suitable for morphological classifications, both visually and with automated classifiers (Abraham et al 1996). By adding archival data for the Hubble Deep Field North (HDF-N) and its flanking fields (Williams et al 1996) and the Hawaii Deep Fields (Cowie et al 1996), we obtain a spectroscopic and morphological sample of 498 field galaxies with . Further details of this sample and its uniformity are discussed by Brinchmann (1999).
Here we analyse a subset of 321 galaxies for which deep K-band (2.2m) photometry has been obtained from the 3.8m UK Infrared Telescope and the literature. Imaging was performed by the authors using IRCAM3 during three photometric nights 21–24/5 1998 using a K filter. Additional data came from Menanteau et al’s (1999) survey of the Medium Deep Fields, Dickinson’s (unpublished) exposures of HDF-N and Barger et al’s (1999) imaging of the HDF flanking fields and some original CFRS photometry (Hammer et al. 1997). Total magnitudes & aperture colours have been re-measured in a consistent manne; the various IR filter differences are taken into account in the SED fitting algorithm discussed below.
3 An Improved Estimator of Stellar Mass for Distant Galaxies
| Parameter | Range |
|---|---|
| Age | – years in steps of 0.1 in log age. |
| SFR | 0.1, 0.5, 1.0, 2.5, 5.0 Gyr and constant |
| Metallicity | , |
| 0.0, 0.2, 0.4 — Calzetti (1997) law |
Many authors have pointed out that the infrared luminosity of a galaxy is a more robust estimator of its stellar mass than that derived at optical wavelengths. The key role of -band magnitudes was emphasised as a possible test of the merging hypothesis by Broadhurst, Ellis & Glazebrook (1992) and this has motivated numerous infrared-based deep surveys (Cowie et al 1996, Cohen et al 1999). The luminosity distribution of distant galaxies was discussed in support of the hierarchical picture by Kauffmann & Charlot (1998) who demonstrated its insensitivity to the previous star formation history. The main uncertainty in the inferred stellar masses arises from the age of the stellar population (Rix & Rieke 1993).
The basis of our new method is to apply a correction for this uncertainty. We adopt a grid of evolutionary synthesis models with simple star formation histories (Bruzual and Charlot 2000, BC, Table 1) and select the most appropriate evolutionary history by optimal fitting of the optical+IR photometry. Extinction, age and metallicity are allowed to vary within the bounds tabulated in a manner similar to that adopted for photometric redshift determination (c.f. Giallongo et al 1998) and the mass is estimated by normalising the best fit SED to the observed -band magnitude.

Clearly there are some significant assumptions in this approach. Our approach here is to introduce the method and its potential whilst stressing that independent verification is clearly desirable. We assume (a) that the IMF does not vary systematically with morphological type, and b) that the BC code gives reasonable eastimates of the near-IR fluxes for a range of stellar populations. Both assumptions are, to some extent, supported by data for external galaxies (e.g. Kennicutt 1998) and comparisons of spectral synthesis codes by Charlot, Worthey & Bressan (1996). For much of the discussion, relative stellar masses will suffice but where absolute masses and estimates of star formation rates are required we adopt a Salpeter IMF with lower and upper mass cut-offs of 0.1 and 125 .
To assess the random errors arising from our method, we propagate magnitude errors through the fitting procedure using a Monte Carlo method. This gives an intrinsic error on the mass estimates with a median error of dex in (see inset histogram in Figure 1). Further errors might arise due to our choice of exponentially declining star formation histories, and to quantify this we have explored the sensitivity of the method to a secondary burst of SF and find that this can introduce scatter of in with no sign of systematic offsets. Taken together this gives an estimate of the theoretical uncertainty in the mass estimates of dex in .
One potentially useful test of our method is a comparison of our stellar mass estimates with those determined dynamically using rotation curves. We currently have a small overlap of 6 galaxies with Vogt et al (1997) and assuming that these have accurately estimated terminal velocity speeds we can estimate the dynamical mass within three scale-radii using . The comparison of this mass estimate with the stellar mass is shown in Figure 1. The same exercise has been performed with the local sample of Boselli et al (1997) although we expect a larger scatter here as the photometric scales have not been accurately aligned. Figure 1 shows both masses correlate with a scatter consistent with earlier estimes. Of course, the relationship between dynamical and stellar mass depends on the physical properties and is of intrinsic interest. The mean offset corresponds to = 0.3-0.5 . Clearly it will be instructive to construct Figure 1 for a larger sample.
4 Mass Assembly and Specific Star Formation Rates
Although considerable progress has been made in delineating the star formation history of field galaxies (e.g. Madau, Pozzetti & Dickinson 1998), such probes remain uncertain particularly as there is not yet good agreement on what represents a reliable diagnostic. Moreover, it is clear from the considerable diversity of predictions in semi-analytic models (c.f. Baugh et al 1998) that cosmic star formation histories cannot precisely test hierarchical theories of galaxy formation. Whilst considerable effort has been invested in incorporating realistic aspects of star formation and feedback into numerical models of galaxy evolution, here we explore an alternative route, viz. using our method to bring the empirical data closer to the fundamental aspects of hierarchical theory by constructing the redshift dependence of the stellar mass function.
To complement the co-moving volume-averaged star formation history , we seek to construct its stellar mass equivalent and particularly its dependence on galaxy morphology. With sufficient data we could also construct the stellar mass function , analogous to the luminosity function, using a formalism. Its consideration allows us to discuss the important question of possible incompleteness which would otherwise underestimate the stellar mass density .
Incompleteness can arise in various ways. The most critical is that galaxies beyond our limit in a given redshift range contribute to the infrared flux and hence the stellar mass density. Ultimately we seek a -limited version of our current sample from which galaxies can, to first order, be selected to a fixed stellar mass limit at a given redshift. Meanwhile, to assess this incompleteness, we utilise the form of the K-band galaxy luminosity function (LF) obtained by combining the recent infrared survey of Cohen et al (1999) with the -band LF of Loveday (1999).
Assuming a fixed mass/light ratio of =0.8, this LF suggests that if we restrict ourselves to galaxies with stellar masses in the range , we will be complete in across the interval , with the greatest incompleteness in the highest redshift bin. In the subsequent discussion we have restricted our analysis to this mass range and taken the incompleteness corrections and their uncertainty into account.
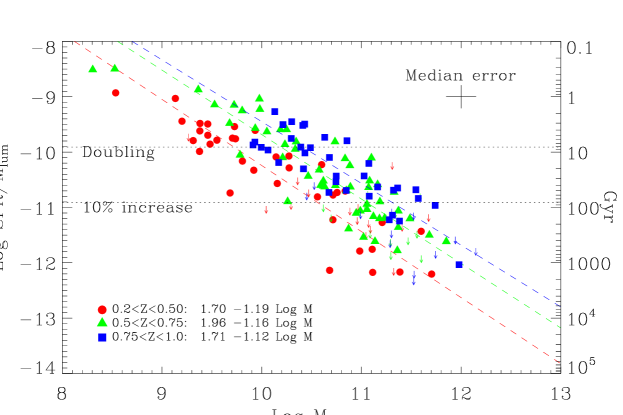
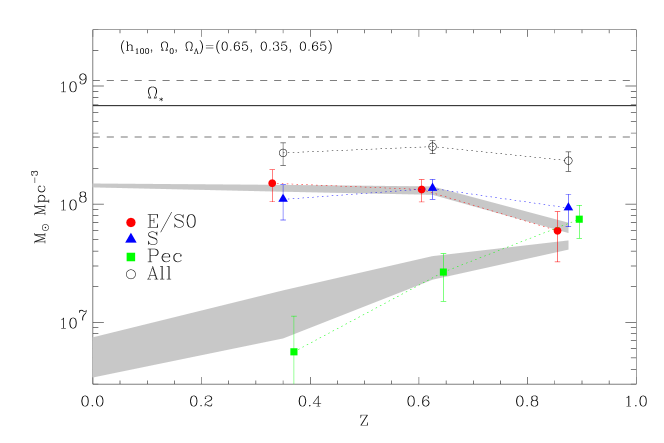
Figure 2 shows the comoving stellar mass density in galaxies partitioned by morphology as a function of redshift with error bars derived by bootstrap resampling methods. The solid horizontal line shows the total local stellar mass density inferred from a recent review by Fukugita, Hogan & Peebles (1998) adjusted to our IMF. The most significant feature is the remarkable decline in mass density associated with galaxies of irregular morphology. This is complemented by a modest increase in that associated with regular galaxies, particularly spheroidals, ensuring that the mean stellar mass density remains approximately constant at all redshifts probed. Inspection of the mass function for high redshift irregulars (Brinchmann 1999) shows a significant number harbour stellar masses as large as those for the most massive regular galaxies suggesting that these simply transform into the latter systems perhaps as a result of the onset of more regular star formation patterns. However, the decline in the irregular galaxy luminosity density may also be driven by merging, causing a gradual increase in the mass density associated with regular galaxies.
What rate of merging is necessary to explain Figure 2? By accounting for evolution in terms of stellar mass, rather than blue luminosity, we can consider this issue using recent estimates of the redshift-dependent merger fraction (Le Fèvre et al 2000, and references therein). Adopting a merger fraction , Brinchmann (1999) finds a good fit to the morphologically-dependent redshift distribution and luminosity functions if 5-10% of the present population of E/S0s formed via mergers over . This solution and its uncertainty is illustrated by the shaded area in Figure 2 where the upper locus refers to a model where the merger progenitors are assumed to be of average mass and with colours similar to local Sbc galaxies over the entire redshift range. However the data indicate that peculiar galaxies become less massive at low redshift, hence we show a model where merger progenitors at are 30% less massive than those at as the lower locus. The total mass density is normalised to the observed amounts in each redshift range, and the model chosen such that it reproduces the local morphologically-split LFs from Marzke et al. (1998). The increase with time in the E/S0 mass density is well matched in both models whereas the decrease in the peculiar mass fraction is overestimated. Converting some peculiar galaxies into spirals (whose mass density was assumed to be constant in the foregoing) would improve the fit.
A further important result can be extracted from Figure 2, namely that the total stellar mass density in massive galaxies is approximately constant over the interval . This, in turn, implies that most of the stellar content of these galaxies must have formed at higher redshift. At first sight this seems a surprising result given, over the same redshift range, the volume-averaged star formation rate remains high (Madau et al. 1998). Our results can be more easily understood by considering the contribution that star formation makes to the total mass of a galaxy.
Consider the specific star formation rate which defines a useful measure of the rate at which new stars add to the assembled mass of a galaxy. For massive galaxies, a much larger is needed to make a fractionally significant mass contribution than would be the case for a low mass system. Figure 3 shows as a function of stellar mass for the CFRS galaxies in our survey (Hammer et al. 1997). Different symbols relate to three redshift ranges, arrows show 2 upper limits. Star formation rates were derived using the luminosity observed in the [O II]3727 Å emission line using (Guzman et al. 1997)
| (1) |
where is the blue luminosity. Note that Figure 3 makes a strong statement about the upper envelope of the distribution where incompleteness has no effect.
The derivation of stellar masses for each galaxy in our survey enables us to ask when galaxies of a particular mass range formed most of their stars. The right hand axis in Figure 3 shows the doubling time for the stellar mass of a galaxy assuming constant star formation, with the horisontal lines indicating the value of required to double and increase by 10% the stellar mass of a galaxy from to the present. Clearly massive galaxies for the bulk of their stellar content at . At lower redshift, the pattern continues for lower mass galaxies consistent with the ”downsizing” picture first introduced by Cowie et al (1996) and our findings are also in very good agreement with Guzman et al. (1997) when the differences in mass estimation are taken into account. Given our incompleteness, dwarf galaxies may well form over a wide redshift range since we cannot probe such mass ranges at all redshifts.
A potential problem with this argument would be massive amounts of obscured star formation, since we have made no dust correction beyond the local calibration. We cannot rule this out conclusively, but observe that only few galaxies in our sample show significant far-IR emission (Flores et al. 1999), and even a constant star formation rate of will only cause a 10% increase in the mass density over the redshift and mass range we here consider.
5 Conclusions
We have presented a new method for determining reliable stellar masses for field galaxies of known redshift and applied it to a uniform sample of 321 galaxies with HST morphologies. We demonstrate via comparisons and simulations that our method yields stellar masses with a precision of dex, although further calibrations and comparisons with dynamical estimates would be valuable. The main advantage of our method is that, with few assumptions, it provides stellar masses with greatly reduced observational requirements and with no bias against galaxy type or orientation. It is therefore particularly well-suited for considering the mass density of galaxies of different types as a function of redshift.
Whereas only a small proportion (%) of massive field spheroidal galaxies can have formed by merging between and , this most likely arises from a significant demise in the mass density of high- peculiar galaxies. The transformation of irregulars into more massive regular systems is shown to be in reasonable agreement with the evolution of the merger fraction found independently from pair statistics.
We find no evidence for any change in the mass density of spiral galaxies, suggesting the merging of spiral galaxies into elliptical galaxies between and the present cannot be a dominant process. Moreover, the total stellar mass density hardly increases over the range sampled. Both results support the contention that most massive galaxies formed their stars prior to or around . Lower mass galaxies remains active to much more recent epochs consistent with the ”downsizing” picture introduced by Cowie and collaborators.
References
- Abraham, et al. (1996) Abraham, R. G., van den Bergh, S., Glazebrook, K., Ellis, R. S., Santiago, B. X., Surma, P., Griffiths, R. E. 1996, ApJS, 107, 1
- Barger et al. (1999) Barger, A. J., Cowie, L. L., Trentham, N., Fulton, E., Hu, E. M., Songaila, A., Hall, D. 1999, AJ, 117, 102.
- Baugh et al. (1998) Baugh, C. M., Cole, S., Frenk, C. S., Lacey, C. G. 1998, ApJ, 498, 504.
- Boselli et al. (1997) Boselli, A., Gavazzi, G., Lequeux, J., Buat, V., Casoli, F., Dickey, J., Donas, J. 1997, A&A, 327, 522.
- Brinchmann (1999) Brinchmann, J. 1999, The physical evolution of galaxies. Ph.D. thesis, University of Cambridge.
- Brinchmann et al. (1998) Brinchmann, J., Abraham, R., Schade, D., Tresse, L., Ellis, R. S., Lilly, S., Le Fevre, O., Glazebrook, K., Hammer, F., Colless, M., Crampton, D., Broadhurst, T. 1998, ApJ, 499, 112, B98
- Broadhurst, Ellis & Glazebrook (1992) Broadhurst, T. J., Ellis, R. S., Glazebrook, K. 1992, Nature, 355, 55
- Bruzual & Charlot (2000) Bruzual, A. G., Charlot, S. 2000, in preparation.
- (9) Calzetti, D. 1997, AJ, 113, 162
- Charlot et al. (1996) Charlot, S., Worthey, G., Bressan, A. 1996, ApJ, 457, 625.
- Cohen et al. (1999) Cohen, J. G., Blandford, R., Hogg, D. W., Pahre, M. A., Shopbell, P. L. 1999, ApJ, 512, 30.
- Cowie et al. (1996) Cowie, L. L., Songaila, A., Hu, E. M., Cohen, J. G. 1996, AJ, 112, 839.
- (13) Flores, H., Hammer, F., Thuan, T. X., Césarsky, C., Desert, F. X., Omont, A., Lilly, S. J., Eales, S., Crampton, D., Le Fèvre, O. 1999, ApJ, 517, 148
- Fukugita et al. (1998) Fukugita, M., Hogan, C. J., Peebles, P. J. E. 1998, ApJ, 503, 518.
- Giallongo et al. (1998) Giallongo, E., D’Odorico, S., Fontana, A., Cristiani, S., Egami, E., Hu, E., McMahon, R. G. 1998, AJ, 115, 2169.
- (16) Glazebrook, K., Ellis, R., Santiago, B., Griffiths, R. 1995, MNRAS, 275, L19
- Glazebrook et al. (1999) Glazebrook, K., Blake, C., Economou, F., Lilly, S., Colless, M. 1999, MNRAS, 306, 843.
- Guzman et al. (1997) Guzman, R., Gallego, J., Koo, D. C., Phillips, A. C., Lowenthal, J. D., Faber, S. M., Illingworth, G. D., Vogt, N. P. 1997, ApJ, 489, 559
- Hammer et al. (1997) Hammer, F., Flores, H., Lilly, S. J., Crampton, D., Le Fèvre, O., Rola, C., Mallen-Ornelas, G., Schade, D., Tresse, L. 1997, ApJ, 481, 49.
- Kauffmann & Charlot (1998) Kauffmann, G., Charlot, S. 1998, MNRAS, 297, L23.
- Kauffmann et al.Kauffmann, Colberg, Diaferio & White (1999) Kauffmann, G. , Colberg, J. M., Diaferio, A., White, S. D. M., 1999, MNRAS, 303, 188.
- Kennicutt (1998) Kennicutt, J., R. C. 1998, In ASP Conf. Ser. 142: The Stellar Initial Mass Function (38th Herstmonceux Conference), 1.
- Le Fèvre et al. (2000) Le Fèvre, O., Abraham, R., Lilly, S. J., Ellis, R. S., Brinchmann, J., Tresse, L., Colless, M., Crampton, D., Glazebrook, K., Hammer, F., Broadhurst, T. 2000, MNRAS, 311, 565.
- Lilly et al. (1995) Lilly, S. J., Le Fèvre, O., Crampton, D., Hammer, F., Tresse, L. 1995, ApJ, 455, 50.
- Loveday (2000) Loveday, J. 2000, MNRAS, 312, 557
- Madau, Pozzetti & Dickinson (1998) Madau, P., Pozzetti, L., Dickinson, M. 1998, ApJ, 498, 106
- Marzke et al. (1998) Marzke, R. O., Da Costa, L. N., Pellegrini, P. S., Willmer, C. N. A., Geller, M. J. 1998, ApJ, 503, 617.
- Menanteau et al. (1999) Menanteau, F., Ellis, R. S., Abraham, R. G., Barger, A. J., Cowie, L. L. 1999, MNRAS, 309, 208
- Rix & Rieke (1993) Rix, H. W., Rieke, M. J. 1993, ApJ, 418, 123.
- Vogt et al. (1997) Vogt, N. P., Phillips, A. C., Faber, S. M., Gallego, J., Gronwall, C., Guzman, R., Illingworth, G. D., Koo, D. C., Lowenthal, J. D. 1997, ApJ, 479, L121.
- Williams et al. (1996) Williams, R. E., et al. 1996, AJ, 112, 1335.