Monte Carlo Predictions of Far-Infrared Emission from Spiral Galaxies
Abstract
We present simulations of Far Infrared (FIR) emission by dust in spiral galaxies, based on the Monte Carlo radiative transfer code of Bianchi, Ferrara & Giovanardi (1996). The radiative transfer is carried out at several wavelength in the Ultraviolet (UV), optical and Near Infrared (NIR), to cover the range of the stellar Spectral Energy Distribution (SED). Together with the images of the galactic model, a map of the energy absorbed by dust is produced. Using Galactic dust properties, the spatial distribution of dust temperature is derived under the assumption of thermal equilibrium. A correction is applied for non-equilibrium emission in the Mid Infrared (MIR). Images of dust emission can then be produced at any wavelength in the FIR.
We show the application of the model to the spiral galaxy NGC 6946. The observed stellar SED is used as input and models are produced for different star-dust geometries. It is found that only optically thick dust disks can reproduce the observed amount of FIR radiation. However, it is not possible to reproduce the large FIR scalelength suggested by recent observation of spirals at 200m, even when the scalelength of the dust disk is larger than that for stars. Optically thin models have ratios of optical/FIR scalelengths closer to the 200m observations, but with smaller absolute scalelengths than optically thick cases. The modelled temperature distributions are compatible with observations of the Galaxy and other spirals. We finally discuss the approximations of the model and the impact of a clumpy stellar and dust structure on the FIR simulations.
Key Words.:
Radiative transfer – dust, extinction – Galaxies: individual: NGC 6946 – Galaxies: spiral – Galaxies: structure – Infrared: galaxies1 Introduction
Dark lanes in edge-on spirals clearly reveal the presence of dust in galactic disks. Depending on the dust amount and distribution, the extinction of starlight may affect to different degrees our knowledge of the objects harboring dust and of the distant universe in the background. However, deriving the amount of dust from the extinction features in spiral galaxies is not easy, because of the uncertainty in the relative distributions of dust and stars. Indeed, realistic models are needed to avoid equivocal results (Disney et al. 1989). Recently, Xilouris et al. (1999) have analised a sample of seven edge-on spirals by fitting optical and NIR images with a complex radiative transfer model inclusive of scattering. They derived a small opacity, with their exponential dust disks having a mean face-on optical depth in the B-band . Unfortunately, the method can only be applied successfully to a limited numer of cases, i.e. edge-on galaxies, where it is possible to analyze the vertical surface-brightness distribution and the dust extinction is maximised by the inclination.
Further constrains on the structure and opacity of dust disks can be obtained by studying dust emission. Assuming that all the stellar radiation absorbed by dust is reemitted in the MIR and (mainly) in the FIR, the amount of extinction in a galaxy can be simply derived by comparing the total dust emission with the stellar one (the energy balance technique). The extinction is then used, together with a radiative transfer model, to study the dust disk properties (Evans 1992; Xu & Buat 1995; Trewhella 1998a). However, the dust emission is treated as a bulk and generally only the disk optical depth is derived. The parameters for the geometrical distributions of dust and stars have to be assumed a priori.
Three-dimensional models of FIR emission from spiral galaxies can help to retrieve information about the relative star-dust geometry from the SED of dust emission and the spatial distribution of the radiation, when available. However, an additional factor is introduced in such models. Not only it is necessary to assume a dust distribution, but also a knowledge of the variation of the ISRF heating throughout the disk is needed. The ISRF could be in principle derived from the observed profiles of stellar emission, but a complicate de-projection is needed involving assumption on the dust distribution. This approach is adopted by Walterbos & Greenawalt (1996). They compute fluxes and surface brightness gradients at 60m and 100m for a sample of 20 spirals. The diffuse ISRF is derived from B band profiles and the dust distribution from the HI column density. The problem of defining an ISRF can be avoided by assuming a temperature gradient for dust grains. Davies et al. (1997) modelled the 140m and 240m Galactic emission observed by DIRBE, by adopting a gradient that matches the longitudinal variation of temperature observed in the data themselves.
Otherwise, the dust heating by the ISRF can be derived in a self-consistent way from a radiative transfer model of the stellar radiation in the dusty environment. Sauty et al. (1998) produced a Monte Carlo radiative transfer model for the clumpy ISM of the spiral galaxy NGC 6946, although a self-consistent ISRF is derived only for the UV radiation, relying on optical profiles for radiation at longer wavelelngth. Dust heating in a clumpy galactic ISM is also included in the photometric evolution model of Silva et al. (1998). They carry out the radiative transfer in a proper way for stellar emission embedded in the clumps and use an approximation for the smooth medium. In the emission model of Wolf et al. (1998) the radiative transfer is computed with the Monte Carlo technique for the whole spectral range, both in the smooth medium and clumps. However, the adopted geometry is typical of star-formation environment.
In this paper, we present a self-consistent galactic model for the FIR emission. The model is based on the Bianchi, Ferrara & Giovanardi (1996, hereafter, BFG) Monte Carlo code for the radiative transfer (complete with scattering) in dusty spiral galaxies. A map of the energy absorbed by dust is derived from the output of the radiative transfer for stellar radiation at several wavelength. The grain temperature along the dust distribution is therefore computed from the radiative transfer itself. Luminosity, spectrum and surface brightness distribution of the FIR radiation can be retrieved, for any wavelength. The main advantage with respect to other models of FIR emission lies in the relative simplicity. We have limited the number of parameters involved to a minimum, adopting, whenever possible, empyrical data. This will allow an isolation of the effect of the dust distribution on the FIR emission. We will try to explain the characteristic of FIR emission with diffuse dust heated by a diffuse ISRF. Clumping of dust and embedded stellar emission (Bianchi et al. 2000b) are not yet included in this work.
Recent FIR observations suggest large scalelengths for dust emission. In a sample of seven spirals resolved by the ISOPHOT instrument aboard the ISO satellite (Kessler et al. 1996; Lemke et al. 1996), Alton et al. (1998c) found that the 200 m scalelengths are 70% larger than those in the B-band. The large ratio may be a result of a dust disk larger than the stellar distribution. However, the result may also be affected by the transient effects of the ISOPHOT detectors. In fact, the P32 mapping mode with which the Alton et al. (1998c) images were obtained is not yet scientifically validated (Klaas & Richards 2000). We will use the model presented here to test if indeed the observations are compatible with large disks. Other works seems to support the same hypothesis. Davies et al. (1997) could model the Galactic FIR surface brightness only with a dust disk with radial and vertical scalelengths larger than the stellar by a factor 1.5 and 2.0, respectively. Nelson, Zaritsky & Cutri (1998) combined 100 m IRAS images of galaxies with similar angular size and concluded that dust is present well beyond the observed stellar disk. Xilouris et al. (1999) derived intrinsic dust scalelengths larger than the stellar one, by a mean factor 1.4 in the seven edge-on spiral sample. If confirmed, such disks may have a large impact on the observations of the distant universe, because of their larger cross section to radiation from backgroud objects.
The paper is structured as follows: Sect. 2 describes the radiative transfer code, with a particular attention to the chosen dust and stellar distributions and to the modification with respect to the original BFG code. Sect. 3 and 4 show how the map of absorbed energy derived from the radiative transfer model can be converted into a map of the dust temperature distribution and hence, of FIR emission. We then show an application of the model to the spiral galaxy NGC 6946 with the intent of analysing the behaviour of our model and test the influence of the various parameters on the FIR emission. The observed properties of NGC 6946 used in the model are described in Sect. 5. The results are presented in Sect. 6 and discussed in Sect. 7. A summary is given in the last section.
2 The radiative transfer model
The original BFG radiative transfer code carries out the radiative transfer for typical galactic geometries. Simulation of optical surface brightness, as well as light polarisation, are produced. Dust properties are computed from the Draine & Lee (1984) dust model, using Mie’s theory for spherical grains. In this paper we use a simplified version of the code: the treatment of polarization has been omitted; empirical dust properties and scattering phase functions are used. The same approach has recently been adopted in Ferrara et al. (1999) and Bianchi et al. (2000b).
In this Section, we describe the stellar and dust distributions adopted in the galaxy model, and the chosen dust extinction and scattering properties. A brief description is then given of the radiative transfer code.
2.1 The stellar disk
As in BFG, the new version of the code allows the use of both disks and spheroidal bulges to describe the spatial distribution of stars (Bianchi 1999). However, to limit the number of free parameters in the modelling, we adopt here a single stellar disk. The chosen disk is exponential along both the radial and vertical directions. The luminosity density distribution is thus described by
| (1) |
where r and z are the galactocentric distance and the height above the galactic plane, respectively, and and the relative scalelengths. While there is a consensus for the radial exponential behaviour (de Vaucouleurs 1959; Freeman 1970), a number of expressions for the vertical distribution have been used in the literature. van der Kruit & Searle (1981) use a sech2, the solution for a self gravitating isothermal sheet, while van der Kruit (1988) propose a sech, consistent with measures of stellar velocity dispersion out of the Galactic plane. The exponential adopted here (Wainscoat, Freeman & Hyland 1989) has the advantage of mathematical simplicity, but has no firm physical justification. Analysing the vertical profiles of a sample of 24 edge-on galaxies in the relatively dust-free K-band, de Grijs, Peletier & van der Kruit (1997) find that a distribution with a peak intermediate between the exp and the sech fits better the central peak (see also de Grijs & van der Kruit 1996). Since a small inclination from the pure edge-on case can produce a less sharp profile, these results are consistent with an exponential distribution.
The radiative transfer model of the galaxy (Sect. 2.4) is run for several wavelength bands. The radial scalelength of the stellar distribution, , is assumed to be the same for all of these bands. Therefore, any observed colour gradient along the disk of a spiral is interpreted as due to differential extinction with , rather than being a reflection of different stellar components. The wavelength dependence of the intrinsic stellar radial scalelength is uncertain, because a knowledge of the dust distribution is needed for its determination. Peletier et al. (1995) analyzed the variation of the ratio of B and K-band scalelengths with inclination in a sample of 37 Sb-Sc galaxies and concluded that the observed gradient is due to extinction. On the other hand, de Jong (1996) compared colour-colour plots of a sample of 86 face-on galaxies with a Monte Carlo radiative transfer model and finds that reasonable dust models cannot be responsible for the observed colour gradients. However, such a conclusion does not seem to include models with dust disks more extended that the stellar, that is one of the cases studied here. The fits of edge-on galaxies of Xilouris et al. (1999) show a slight variation of the intrinsic scalelength with wavelength.
Observations on the Galaxy show that different stellar populations have different vertical scalelengths. For the sake of simplicity, a single mean value for the vertical scalelength has been adopted here, for each wavelength. Wainscoat et al. (1992) provide a table of vertical scalelengths, B, V, J, H, K-band absolute magnitudes and local number density for the main Galactic stellar sources. A mean value has been computed averaging over the total disk luminosity integrated from the B to the K band. Assuming kpc (Kent, Dame & Fazio 1991; Fux & Martinet 1994), we derive . Similar values for can be found in the literature (van der Kruit & Searle 1982; de Grijs & van der Kruit 1996; Xilouris et al. 1999).
2.2 The dust disk
The parameters for the dust disk are far more uncertain than those for the stellar disk. Usually the same functional form is used as for the stellar distribution, with independent scalelengths (Kylafis & Bahcall 1987; Byun et al. 1994; Bianchi et al. 1996; Xilouris et al. 1999).
A very good correlation is usually found between dust and gas in spirals, especially with the molecular component which is dominant in the inner galaxy (Devereux & Young 1990; Xu et al. 1997; Bianchi et al. 1998; Alton et al. 1998a; Bianchi et al. 2000a). It is therefore reasonable to use the gas distribution as a tracer of dust.
In luminous, face-on, late-type spirals, H2 peaks in the centre and falls off monotonically with increasing galactocentric distance, while the HI distribution shows a central depression and a nearly constant surface density across the rest of the optical disk (Young & Scoville 1991). Some early type galaxies show the same behaviour, although a good fraction of them presents a central depression and a flatter ring distribution for the molecular gas. Indeed, flat or ring-like dust distributions have been derived from FIR and sub-mm observations (Xu & Helou 1996b; Sodroski et al. 1997; Bianchi et al. 1998).
Nevertheless, the gas distribution of most galaxies is dominated by a centrally peaked molecular gas component. This is the case of the late-type spiral NGC 6946 (Tacconi & Young 1986), whose dust distribution is the main concern of this paper (Sect. 5). Therefore, in this paper dust is assumed to be distributed in a smooth radial and vertical exponential disk, similar to the stellar one (Sect. 2.1). The number density of dust grains can be written as
| (2) |
with the central number density. The dust scalelengths and can be selected independently from the analogous stellar parameters. It is usually assumed in radiative transfer models that and (Byun et al. 1994; Bianchi et al. 1996; Davies et al. 1997, and references therein). We will refer to this as the standard model. The choice of the vertical scalelengths is mainly dictated by the impossibility of simulating the extinction lanes in edge-on galaxies with a dust distribution thicker than the stars (Xilouris et al. 1999). The assumption of a similar radial scalelength for stars and dust has no firm justification. As already said in the introduction, recent analysis of extinction of starlight and FIR emission suggests more extended dust distributions.
The central number density of dust is normalised from the chosen optical depth of the dust disk. For a central face-on optical depth in the V-band, , is given by
| (3) |
where is the extinction cross section. The optical depth at any wavelength can then be computed by integrating the absorption coefficient
| (4) |
along any path through the dust distribution. The integral involves knowledge of the ratio , which is found from the assumed extinction law. As for the stellar disk, the dust disk has been truncated at 6 scalelengths both in the vertical and radial direction.
In section 6 various values of , and will be explored.
2.3 Dust extinction
The extinction law adopted here is that typical of diffuse Galactic dust, with a strong bump at 2175Å. Regions of high star formation and starburst galaxies usually have a weaker bump and a steeper far-UV rise (Whittet 1992; Calzetti, Kinney & Storchi-Bergmann 1994; Gordon, Calzetti & Witt 1997). Extinction laws in the optical show smaller differences. From radiative transfer models of seven edge-on galaxies, Xilouris et al. (1999) derive an extinction law similar to the Galactic one longward of the U-band.
The extinction law used is tabulated in Tab. (1), for 17 bands in the spectral range of stellar emission. The bands from UV1 to K have essentially the same spectral coverage as the homonymous described by Gordon et al. (1997), from which the extinction law is taken. Two bands (namely EUV and LMN) have been added to extend the spectral coverage in the ultraviolet up to the ionization limit and in the near infrared. The extinction law for these two bands has been taken from Whittet (1992) and Rieke & Lebofsky (1985), respectively.
We have used the Henyey & Greenstein (1941) phase function for the scattering. This is given by
| (5) |
with the angle of scattering. The asymmetry parameter , as well as the dust albedo , are derived from models of dust scattering by reflection nebulae in the Milky Way. The adopted and are shown in Tab. (1). Again, the values for the bands from UV1 to K are from Gordon et al. (1997). For the EUV band we have used Witt et al. (1993) data at 1000Å while the values for the LMN band have been assumed equal to those in the K band.
band [Å] EUV 912 1125 4.34 0.42 0.75 0.72 UV1 1125 1375 3.11 0.60 0.75 0.54 UV2 1375 1655 2.63 0.67 0.75 0.44 UV3 1655 1900 2.50 0.65 0.73 0.47 UV4 1900 2090 2.78 0.55 0.72 0.58 UV5 2090 2340 3.12 0.46 0.71 0.65 UV6 2340 2620 2.35 0.56 0.70 0.54 UV7 2620 3230 2.00 0.61 0.69 0.43 U 3230 3930 1.52 0.63 0.65 0.36 B 3930 4979 1.32 0.61 0.63 0.28 V 4979 5878 1.00 0.59 0.61 0.23 R 5878 7350 0.76 0.57 0.57 0.18 I 7350 9500 0.48 0.55 0.53 0.14 J 9500 14000 0.28 0.53 0.47 0.12 H 14000 19000 0.167 0.51 0.45 0.12 K 19000 25000 0.095 0.50 0.43 0.12 LMN 25000 37500 0.04 0.50 0.43 0.12
2.4 The Monte Carlo code
We give here a brief description of the radiative transfer code, referring the interested reader to the BFG paper for more details.
Adhering to the Monte Carlo method, the code follows the life of each energy unit (a photon) through scattering and absorption, until the radiation is able to escape the dusty medium. The code is monochromatic, since the optical properties of dust must be specified for a particular wavelength. In principle, the geometrical distributions of stars may depend on too. For a given star-dust geometry and central face-on optical depth , a radiative transfer simulation is produced for each of the 17 bands of Sect. 2.3. Typically, a simulation consists of 107 photons.
The main steps of the computation scheme are:
- Emission:
-
the position of a photon in the 3-D space is derived according to the stellar distributions described in Sect. 2.1. Photons are emitted isotropically and with unit energy.
- Calculation of optical depth:
-
The absorption coefficient (Eqn. 4) is integrated from the emission position along the photon travelling direction to derive the total optical depth through the dust distribution. A fraction of all the energy travelling in that direction propagates through the dust. With the Monte Carlo method it is then possible to extract the optical depth at which the photon impinges on a dust grain. This optical depth can be computed inverting
(6) where is a random number in the range [0,1]. If the derived is smaller than , the photon suffer extinction, otherwise it escapes the dusty medium. This process is quite inefficient when the optical depth of the dust distribution is small, most of the photons leaving the dust distribution unaffected. To overcome this problem, the forced scattering method is used (Cashwell & Everett 1959; Witt 1977): essentially, a fraction of the photon energy is unextinguished and the remaining is forced to scatter. When the optical depth is small () or the photon path is free of dust, the photon escapes the cycle. Once is known, the integral of is inverted to derive the geometrical position of the interaction between the photon and the dust grain.
- Scattering and Absorption:
-
a fraction of the photon energy, given by the albedo , is scattered, while the remaining is absorbed. The scattering polar angle , i.e. the angle between the original photon path and the scattered direction, is computed using the Henyey & Greenstein (1941) scattering phase function (Eqn. 5), inverting
(7) with a random number. The inversion of Eqn. (7) is given by the analytical formula
(8) No preferential direction perpendicular to the original photon path is assumed, as for scattering by spherical grains. The azimuthal angle is thus extracted randomly in the range .
The amount of energy absorbed by the dust grain is stored as a function of the galactocentric distance and the height above the plane, using the two model symmetries, i.e. the symmetry around the vertical axis and the symmetry about the galactic plane, to improve the signal-to-noise. Maps of absorbed energy were not produced by the original BFG code.
- Exit conditions:
-
the last two steps are then repeated, using the new direction of the scattered photon, the coordinates of the scattering point and the energy reduced by absorption, until the energy of the photon falls below a threshold value ( of the initial energy) or until the exit conditions on are verified.
After the exit conditions are satisfied, the photon is characterised by the last scattering point, its travelling direction and its energy. To reduce the computational time, the two model symmetries are exploited to produce a total of 4 photons from each one. Photons are then classified according to the angle between the last direction and the symmetry axis. An image is produced collecting all the photons that fall in a solid angle band of width (BFG) and mean polar angle equal to the chosen model inclination.
Finally, all the photons in an angle band are projected into the plane of the sky according to their point of last scattering. Maps of 201x201 pixels are produced, covering an area of 12x12 stellar radial scalelengths around the centre of the galaxy. Maps of absorbed energy cover 6 dust scalelengths in the radial direction and in the positive vertical direction in 101x101 pixels.
2.5 Normalisation of the radiative transfer output
Each set of 17 radiative transfer simulations is then normalised according to a chosen SED for the stellar radiation. Two kinds of normalization are available: in the first, the input normalization, a SED is chosen for the intrinsic, unextinguished, stellar energy emission. The SED is integrated over the bands limits and the total energy emitted in a band is used to scale each monochromatic simulation. This is suitable, for instance, to predict the FIR emission associated with a synthetic galactic SED.
The second normalisation mode, the output normalisation, is instead based on the observed SED of a galaxy. An observed SED is constructed from observations in several wavelength and the model is scaled to produce images that have the same SED. The intrinsic, unextinguished, SED is then inferred from the radiative transfer model. This second mode, suitable for fitting the FIR emission, is the one used in this paper (Sect. 5).
Together with the optical images, the absorbed energy maps are also normalised. Thus, the output of a model consists of a set of 17 images in the wavelength range of stellar emission and a set of 17 maps of the energy absorbed by dust from stellar radiation emitted in each band. The images are produced in units of surface brightness, while the maps of absorbed energy are in units of energy per unit time per unit volume. The absorbed energy maps can be added together to produce a map of the total energy absorbed by dust. However, for the purpose of modelling the FIR emission, a further step is needed before coadding. This is explained in the next Section.
3 The MIR correction
The energy absorbed from photons heats up dust grains and is re-emitted in the infrared, preferentially at m. We do not consider here the heating of dust grains by collisions with the interstellar gas: this process is normally negligible and the dust temperature is almost entirely determined by radiative processes (Spitzer 1978).
When the energy of the absorbed photon is small compared to the internal energy of the grain, radiation is emitted at the thermal equilibrium. This is the case for larger grains, responsible for most of the FIR emission. For smaller grains, the absorption of a single high-energy photon can substantially alter the internal energy. The grain undergoes temperature fluctuations of several degrees and cools by emission of radiation, mainly in the MIR range (Whittet 1992). The models of this paper are limited to thermal FIR emission only. Therefore, it is necessary to exclude from the total absorbed energy the fraction that goes into non-equilibrium heating.
Désert, Boulanger & Puget (1990) derived an empirical dust model, from an analysis of the features in the Galactic extinction law and in the infrared emission. Three dust components were needed in the model: i) big grains (), responsible for the FIR emission; ii) very small grains () and iii) PAHs, responsible for the MIR emission at . From the parameters and functional forms of Désert et al. (1990), we have derived the mean absorption cross-section of the model, , and for each of its three dust components111Note that . In the Désert et al. (1990) model, very small grains and PAHs are pure absorbers (i.e. ).. Of the light impinging on the grain mixture, a fraction of energy proportional to is absorbed; therefore, the contribution of very small grains and PAHs to the absorption is given by
| (9) |
Values of , the MIR correction, are given in Tab. (1) for each of the model bands and plotted in Fig. 1 as a function of . has a local maximum in the position of the 2175Å bump of the extinction curve: absorption by very small grains in the Désert et al. (1990) model is responsible for this feature. The rise in the Far-UV is due to PAHs.

After multiplying by ), the 17 absorbed energy maps store the energy that is absorbed by large grains only. The final coadded map, , contains the energy absorbed by dust per unit time and unit volume, that goes into thermal equilibrium emission only. The derivation of the dust temperature and FIR emission from is shown in the next Section.
4 The dust emission model
The power absorbed by a single dust grain can be derived by dividing by the grain number density . Because of the conservation of energy, this is equal to the power each grain radiates. Assuming that all dust grains in our model are spherical and with the same mean radius , the thermal equilibrium imposes that
| (10) |
where is the dust temperature distribution and the emission efficiency. By Kirchhof’s law, (Whittet 1992).
For the exponential dust distribution of Eqn. (2) and the central number density of Eqn. (3), Eqn. (10) can be rewritten as
| (11) |
with . The map of dust temperature is derived by inverting Eqn. (11).
For the ratio , we use a value derived for Galactic dust (Bianchi, Davies & Alton 1999),
| (12) |
Eqn.(12) has also been derived assuming that all grains have the same radius. The wavelength dependence of the ratio changes smoothly from to at 200 m, as observed by Reach et al. (1995) using high S/N FIR spectra of the Galactic plane. The absolute value of the ratio has been derived using dust column density maps calibrated to Galactic extinction (Schlegel, Finkbeiner & Davis 1998).
Finally, FIR images are created integrating the emission coefficient,
| (13) |
along a given line of sight through the dust distribution, under the assumption that dust is optically thin to FIR radiation. Using the emissivity of Eqn. (12) this is justified for any model with reasonable values of .
As for the optical images, the far infrared images are produced in units of surface brightness. FIR images have the same extent and resolution of the optical images, i.e. a region of 12x12 stellar radial scalelengths around the centre of the galaxy is mapped in 201x201 pixels.
5 A worked example: NGC 6946
In the following we show an application of the radiative transfer and dust emission model to the spiral galaxy NGC 6946. The final goal is to find the parameters of the dust distribution compatible with the available observations in the optical and FIR range.
RA (J2000) 20h 34m 520 de Vaucouleurs et al. (1991), RC3 Dec. +60 9 15 RC3 inclination 34 Garcia-Gomez & Athanassoula (1991) P.A. 64 Garcia-Gomez & Athanassoula (1991) distance 5.5 Mpc Tully (1988) D25 11.5 RC3 1.73 RC3 Ldust 1.5 - 3 L⊙ this work, Sect. 6 Mgas M⊙ Devereux & Young (1990), rescaled to 5.5Mpc
NGC 6946 is a large nearby Sc galaxy (A few basic properties are presented in Table 2). The optical appearance of the galaxy is characterised by six prominent spiral arms of which the three arms originating from the NE quadrant are brighter and more developed than those in the SW (Tacconi & Young 1990). Trewhella (1998a, b) finds that the NE interarm region suffers high extinction. The region appear fainter because of the dust effect, rather than being intrinsically less luminous. Indeed, polarised light is observed in the interarm regions as well as in the spiral arms (Fendt et al. 1998).
NGC 6946 shows a centrally peaked molecular gas distribution (Tacconi & Young 1989) dominant in the inner 10 over the flatter atomic gas component (Tacconi & Young 1986). The galaxy is marginally resolved in FIR observations with KAO and IRAS (Engargiola 1991; Alton et al. 1998c), with the dust emission tending to follow the spiral arms and the bright central emission. The 117 resolution 200m ISO image shows a morphology similar to the 100m IRAS observation (Alton et al. 1998c). Higher resolution SCUBA images show a tight correlation between the dust emission at 850m and the dominant gas phase (Bianchi et al. 2000a).
We now describe the observed SED for the stellar emission, used in the normalization of the radiative transfer, as shown in Sect. 2.5, and the SED of dust emission, that will be compared to the model results. The procedure adopted in the modelling are presented in Sect. 5.3.
5.1 The stellar Spectral Energy Distribution
We have derived the observed stellar SED from literature data. Values for the flux inside an aperture of 5 (corresponding to the B-band half light radius; Engargiola 1991) are presented in Table 3. All the data have been corrected for Galactic extinction (Table 2) using the assumed extinction law.
Optical and Near Infrared data in the bands U, B, g, V, r, I, J, H, K are from Engargiola (1991). The observed NIR emission is considered as purely stellar. Using the IRAS 12 m flux as a template of small grain emission and the Désert et al. (1990) model, we derived a dust contribution to the K-band emission of only 0.3%. The stellar emission at 5 m has been extrapolated from the K-band, using the Rayleigh-Jeans spectral region in the synthetic galactic SEDs of Fioc & Rocca-Volmerange (1997).
stellar emission fν (5) m Jy 0.091 0.05 short-UV 0.165 0.09 0.02 medium-UV 0.250 0.13 0.09 long-UV 0.315 0.3 0.2 U 0.360 0.50 0.05 B 0.435 0.90 0.06 g 0.495 1.1 0.1 V 0.554 1.38 0.07 r 0.655 2.0 0.2 I 0.850 3.2 0.3 J 1.250 5.1 0.4 H 1.650 7.2 0.6 K 2.200 5.8 0.5 5.000 1.3 dust emission 12 11 2 25 14 3 60 120 20 100 240 50 160 310 60 200 280 80 450 9 – 27 850 2 – 3
The SED in the non-ionising UV is taken from Rifatto, Longo & Capaccioli (1995b). The authors derive fluxes for a large sample of galaxies, by homogenising observation from several satellites (notably IUE), balloon and rocket-borne experiments, with different apertures and sensitivities. An aperture correction depending on the morphologycal type is applied to each flux, and total magnitudes are given for three photometric bands centred at 1650Å (short-UV), 2500Å (medium-UV), 3150Å (long-UV). Using an appropriate aperture correction and calibrating as in Rifatto, Longo & Capaccioli (1995a), we have derived fluxes for our selected aperture. The quoted errors come mainly from the aperture correction. The flux at the Lyman limit (912Å) has been extrapolated after observing that in a versus plot the observed SED is flat for the short- and medium-UV. This trend is assumed to be valid down to the ionization limit. The ionising UV is not included in the model (Sect. 7).
5.2 The dust Spectral Energy Distribution
The SED of dust emission is also shown in Table 3. Surface brightnesses over the half-light aperture shortward of 100m have been derived from IRAS High Resolution (HiRes) images (Rice 1993; Alton et al. 1998b). Derived values have been colour corrected (Rice et al. 1988) and are consistent (within a 20% error; Alton et al. 1998c) with the analogous data provided by Engargiola (1991), derived on previous enhanced resolution IRAS images. The value at 160m has been derived by Engargiola (1991) from the air-borne KAO telescope.
Data at 200m are derived from P32 images taken from the ISOPHOT instrument aboard the ISO satellite (Alton et al. 1998c). The P32 mapping mode is still not scientifically validated and its photometric calibration is highly uncertain (Klaas & Richards 2000). Alton et al. (1998c) compared both the integrated flux with the value derived by Engargiola (1991) on 200m KAO images and the measured background with an extrapolation from the 100m value. They conclude that the calibration may overestimate the flux by about 30%. A 30% error is shown in Table 3.
Finally, lower and upper limit of the flux at 450 and 850 m are derived from SCUBA images (Bianchi et al. 2000a). The lower limit correspond to the signal coming from regions 3 brighter than the sky, inside the selected aperture. The upper limit is derived assuming a 1 emission for the regions without detected signal. Sub-mm fluxes are only given for completeness, the FIR models being constrained mainly by the fluxes at 100, 160 and 200 m. Emission at 12, 25 and 60 m, dominated by small grains (Désert et al. 1990), is used in Sect. 7 to validate the MIR correction.
5.3 Modelling procedure
After choosing the star-dust geometry, a radiative transfer simulation is run for each of 17 bands of the model (Sect. 2.5) and images for the inclination of NGC 6946 are produced (Table 2). An intrinsic scalelength kpc has been used for the stellar emission, derived from a K-band image (Trewhella 1998b), where the effects of extinction are smaller. For the ratio of Sect. 2.1, this leads to 170 pc. The simulations do not depend on the absolute values of the scalelengths, as long as they are shown as functions of scaled galactocentric and vertical distances. However, absolute values are needed if we want to derive correct values for the emitted and absorbed energies in each band.
The simulated images are then integrated inside the half light radius aperture (derived from the B-band simulation). Mean fluxes over each band of Table 1 are obtained by integrating a continuous SED derived from the data in Table 3. These fluxes are then used to scale the results of the aperture photometry on the simulation. Because of this normalisation, the stellar SED derived from the simulated images is the same for each model. The intrinsic unextinguished energy emitted by stars is then derived from the Monte Carlo code. The half-light radius aperture was chosen in the earlier stages of our analysis because of the availability of one more UV data point in Engargiola (1991). However, if the distribution we have adopted is a correct description of the galaxy luminosity density, the normalization is independent of the aperture dimension, being equivalent to assigning a value for in Eqn. (1). After the normalization, FIR images for the selected inclination are produced and the fluxes derived, as for the images of stellar emission. The simulated SED in the FIR is then compared to the observed one.
For a sample of seven spirals, Alton et al. (1998c) measured B-band and FIR scalelengths in a galactocentric distance range from 1.5 to 3.5 after smoothing the optical and the IRAS images to the poorest resolution of the 200m ISO map (FWHM=117). For NGC 6946, they found that the B band scalelength is slightly smaller than the 200 scalelength, by a factor 0.9, while it is larger than the 100m scalelength, by a factor 1.8. The absolute values of the scalelengths are presented in Table 4. The large 200 scalelengths, compared to the optical and IRAS data, are a general property of the sample. The FIR simulation of this work are compared with the observations of Alton et al. (1998c). FIR images are smoothed to the ISO resolution and scalelengths are derived on the same distance range as the observations222As described in Sect. 2.4, a region of 12 is covered by 201 pixels, thus giving a pixel size of 5.7 (150 pc), for the adopted =95. Therefore the ISO beam can be modelled by a gaussian of FWHM20 pixels..
Keeping fixed the stellar distribution, several models are produced with different parameters for the dust distribution. The final goal is to obtain a single model able to describe both the observed FIR SED and the spatial distribution of the emission.
6 Results

The first models presented here have the geometrical parameters of the standard model, i.e. a star-dust geometry with and . As already said in Sect. 2.2, the choice is mainly motivated by the presence of extinction lanes along the major axis of edge-on galaxies. The H2 column density in NGC 6946 has an exponential radial profile, with a scalelength of 90 (Tacconi & Young 1986). Incidentally, this is very close to . Thus, the dust disk discussed here can be thought of as a dust component associated with the molecular phase. Four values for the V-band face-on optical depth have been chosen, 0.5, 1, 5 and 10.
The SED of the four models in presented in Fig. 2. The thick solid line represents the stellar emission of the galaxy as derived from the simulations, normalised to the observed data points as described in the previous section. Each different line shows the intrinsic unextinguished SED in the short-wavelength part of the spectrum and the FIR emission in the long-wavelength side. For the dust-free emission, the SED is derived from the total intrinsic energy, assuming isotropic emission and measuring the half light radius in a transparent model. All the models presented in this paper show a spike at 2000Å in the unextinguished SED. This is due to the extinction feature at 2175Å present in the assumed extinction law (Sect. 2.3), while the observed SED is flat. A possible dip in the stellar SED caused by this extinction feature could be masked by the broad band of the observation or the large errors in the UV photometry. The extinction feature could also be absent, in which case our assumption of Galactic dust for NGC 6946 is not correct.
In all the models, the wavebands from EUV to U contributes tho 30% of the total absorbed energy, while the wavebands from B to LMN to 60%. Therefore, most of the radiation is absorbed from the Optical-NIR light. A similar result was obtained for the same galaxy by Trewhella (1998b).

The MIR corrections are quite similar for all the models: approximately 32% of the total absorbed energy is estimated to go into MIR emission, the remaining 68% being available for thermal equilibrium processes and FIR emission. Since small-grains and PAHs responsible for no-equilibrium processes have a higher absorption efficiency at shorter wavelength, the contribution of absorption from Optical-NIR wavebands is higher after the MIR correction. So the radiation originally emitted at Å contributes 70% of the FIR emission. The same result applies to all the models presented in this paper, therefore MIR corrections are not discussed separately in each case. A comparison between the estimated and observed MIR emission is given in Sect. 7.
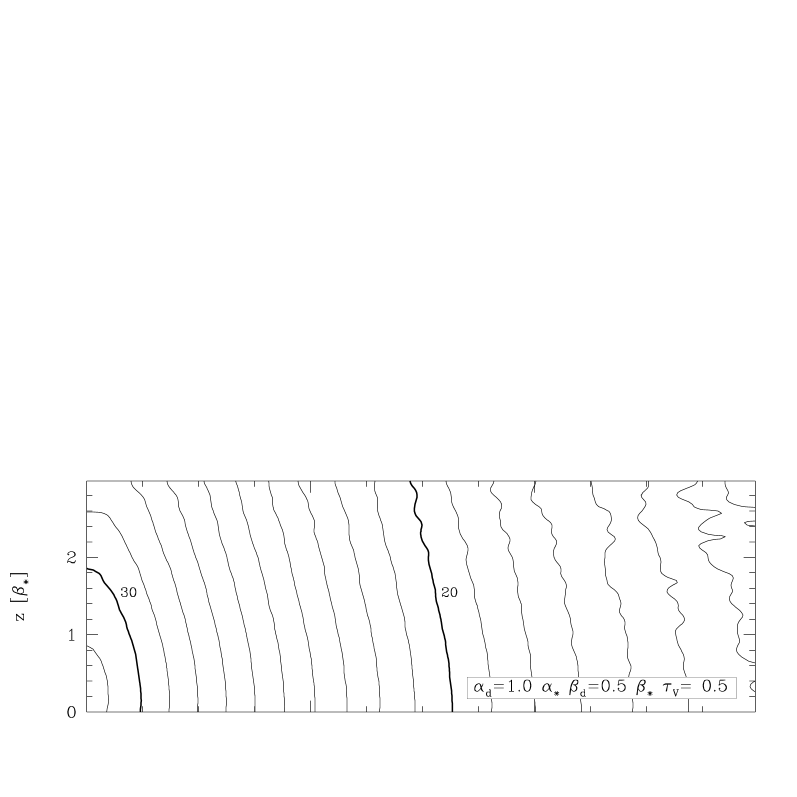
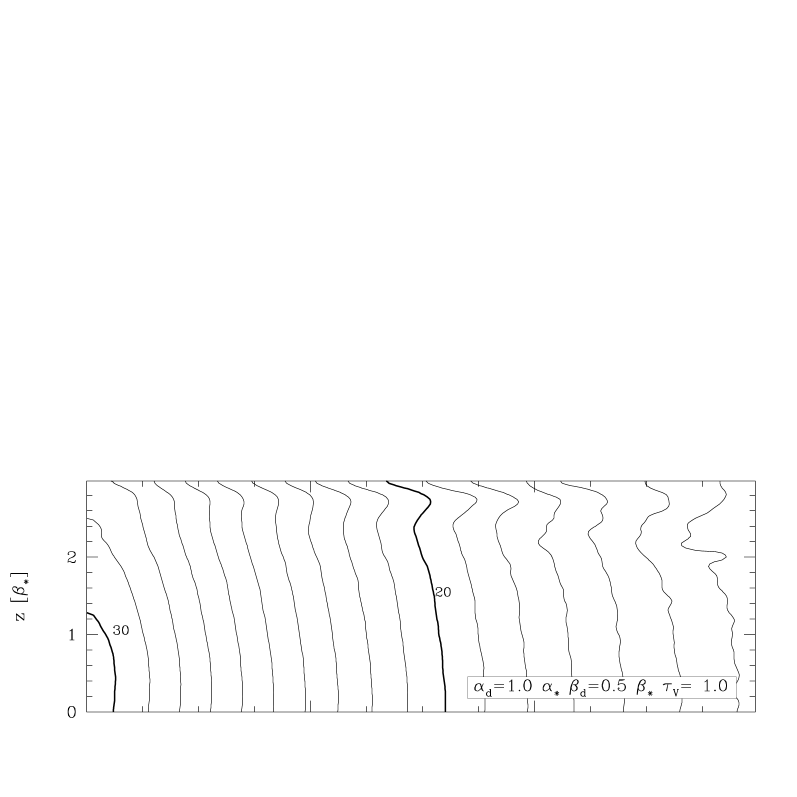
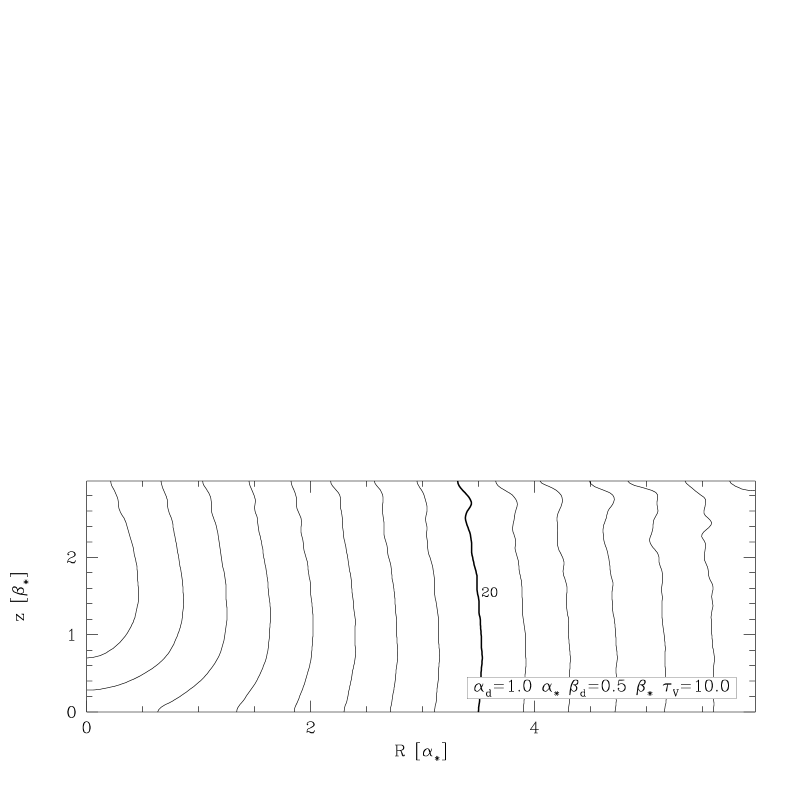
The temperature distributions for each model are shown in Fig. 3, as a function of the galactocentric radius and height above the plane. Apart from the central region, the distributions are very similar. For a dust distribution narrower than the stellar one, the stellar radiation field is expected to increase with height above the plane in an optically thick model (Draine & Lee 1984; Rowan-Robinson 1986), because the stars closer to the plane are shielded. This is evident in the central regions () of the models. When the optical depth increases, dust at higher temperature is found at higher positions above the plane. In the models with higher extinction, the effect can still be seen at larger galactocentric distances, the region of higher temperature approaching the galactic plane at large distances. Vertical gradients are very shallow, because of the greater extent of the galaxy in the radial direction with respect to the vertical and because the stellar distribution is smooth.
The FIR spectrum is shown in Fig. 2. Only models with central optical depth between =5 and 10 produce enough energy to match the observational data. This is a general property of all the models we are going to discuss: a substantial extinction is necessary to produce the observed SED in the FIR. The total amount of energy absorbed and re-emitted (in both MIR and FIR) is between 1.5 and L⊙, for the two high models, respectively. This corresponds to a fraction 0.3-0.4 of the intrinsic energy produced by the stars. Therefore, of the bolometric luminosity of NGC 6946 is absorbed by dust.
observed (Alton et al. 1998c) 1.52 0.86 1.66 Standard model =0.5 1.15 0.65 0.80 =1.0 1.19 0.66 0.81 =5.0 1.63 0.72 0.86 =10. 2.07 0.77 0.91 model =0.5 1.16 0.76 1.01 =1.0 1.21 0.76 1.02 =5.0 1.60 0.83 1.08 =10. 1.76 0.87 1.12 =0.5 HI +=5.0 H2 distr. 1.59 0.81 1.06
The optical (B) and FIR (100m and 200 m) scalelengths measured on standard models are shown in Table 4. The B-band scalelength increases with and it is close to that observed if . The FIR scalelengths increase with the wavelength. A slight increase with is also observed, because of the smaller temperature in the centre. However, FIR scalelengths are never as large as observed, especially at 200m. While the 100m scalelength for the model is underestimated by 15%, the 200m scalelength is about one half of that measured on ISO images. Therefore, the ratio between the B-band and 200m scalelengths is smaller than that measured by Alton et al. (1998c). It is interesting to note that, because of the more rapid increase of the B-band scalelength with , the lowest values of the ratio are obtained for optically thin cases. Nevertheless, optically thin cases are unable to explain the large 200m scalelength and the energy output. We note here that, by adopting a single measured in the K-band, we have assumed that the larger optical scalelength with respect to that measured in the NIR is entirely due to dust extinction. If indeed an intrinsic difference exist, a smaller optical depth may be able to reproduce the observed B band scalelength. We will discuss the effect of our assumption in Sect. 7.
Alton et al. (1998c) suggest that the large observed scalelengths at 200m is due to a dust distribution more extended than the stellar disk. To test this hypothesis, we run models with (Davies et al. 1997; Xilouris et al. 1999), keeping the other parameters as for the standard model. The case is shown in Fig. 4. As for standard models, only optically thick cases are able to match the observed SED. For the same optical depth the extended model has a higher extinction (e.g. 44% of the energy is absorbed in the V-band against the 34% of the standard model).

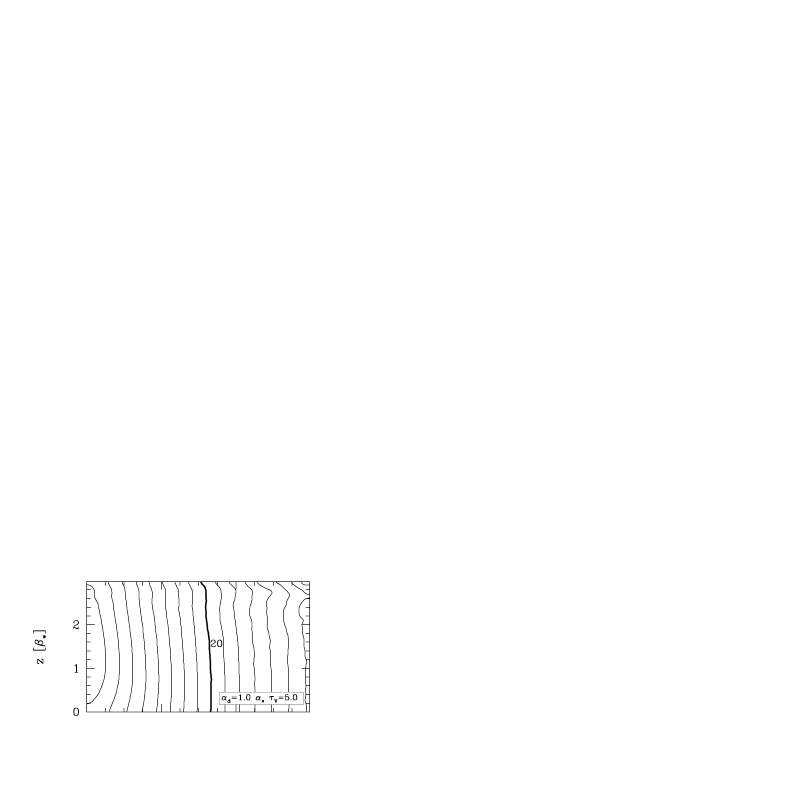
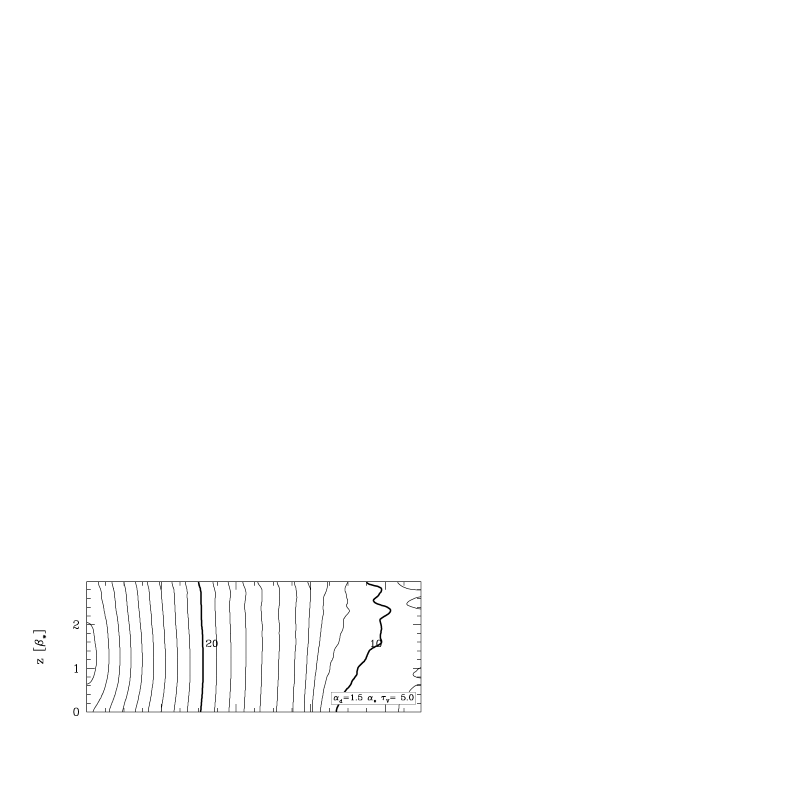
The temperature distribution for the extended model is shown in the central panel of Fig. 5. For ease of comparison, the temperature distribution of the standard model is shown again (in the right panel), with the same scale as for the new model. Within a radius of 6 (the extent of the stellar disk) the temperature pattern of the extended model is quite similar, apart from a small difference due to the normalisation. This is reflected in the peak of the FIR SED, that is essentially the same in both the models. Outside of 6, the truncation of the stellar distribution, dust is colder and it does not modify the shape of the SED. The steeper temperature gradient at 6 is an artifact due to the truncation of the stellar disk. A truncation is indeed suggested by counts of faint stellar sources in the Galaxy (Sect. 2.1). A few tests have been conducted with stellar distributions truncated at the same distance as the dust disks, to avoid having dust in regions without local stellar emission. The steeper gradient disappears and a larger distance is needed to reach the same temperature. However, changes are small, the general trend in the temperature distribution and in the FIR emission distribution are essentially the same. It is interesting to note that for , dust is colder on the plane than above, because starlight is seen through higher optical depths along the plane.
The extended dust distribution causes an increase of the FIR scalelengths with respect to the standard model (Table 4). Scalelengths at 100m are quite close to those observed (within a 3% for the case). However, the 200m scalelengths are still underestimated, by at least 30%. B band scalelengths are similar to those for the standard model (the effect of an extended dust distribution being appreciable only for high optical depths). As in the standard model, despite the increase of the FIR scalelength with , B/200m scalelength ratios are close to those of Alton et al. (1998c) only in the optically thin case.
The analysis of Galactic FIR emission of Davies et al. (1997) suggests that the vertical scalelength of dust as well is larger than the stellar one, by a factor of two. Models that included a thicker dust disk, however, do not produce better results than those presented here (Bianchi 1999).
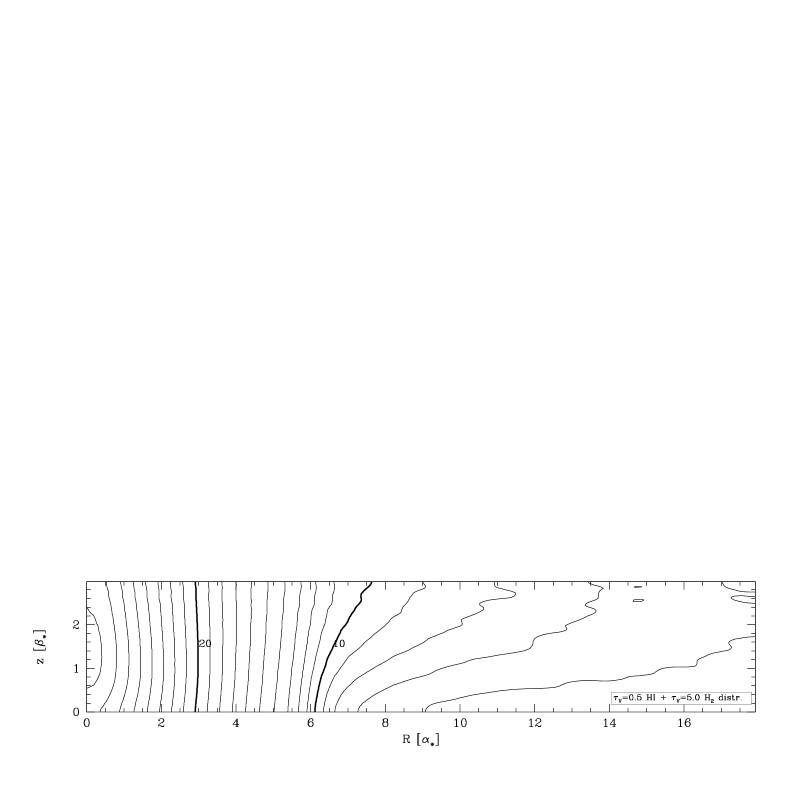
Larger FIR scalelengths can be produced by extending further the dust distribution. Davies et al. (1999b) note that the IRAS emission tends to follow the molecular gas, while the m profile is closer to the much broader atomic gas component. Could dust associated with the HI distribution be responsible of the emission at m? A model was produced with two dust disks. As said earlier, a disk with can describe dust associated with the molecular gas. As for the dust associated to the atomic gas, we chose a disk with a flat radial distribution up to 2.5, then falling off exponentially with a scalelength of 3 . This mimics the observed column density of HI (Tacconi & Young 1986).
Using the relation between extinction and gas column density of Bohlin et al. (1978) and the column density measured by Tacconi & Young (1986), we derived an optical depth for the broader dust disk. For the dust disk associated with the molecular phase we adopted , as in the previous standard disks. Using the observed H2 column density, a value larger at least by a factor of two would have been derived. However, too much energy would have been absorbed from dust (see, for instance, the SED of the standard model in Fig. 2). The discrepancy between the value derived from the gas column density and that needed to produce the right amount of absorption may be due to the smaller effective absorption in a clumpy structure of dust. Clumping is discussed in Sect. 7.
The SED of this new model is shown in Fig. 4. The temperature distribution is presented in the bottom panel of Fig. 5. Despite the colder temperature of the dust associated to HI, the behaviour of the FIR radiation in the region where scalelengths are measured is dominated by the dust disk associated with H2333By extending the dust disk further, the FIR scalelength can became as large as that observed. This happens, for example, for a single HI-like dust distribution. However, optically thick models ( for the HI-like distribution) are still needed. Such models would have a dust mass larger than what implied assuming the canonical gas-to-dust mass ratio (Sect. 7).. The derived scalelengths are similar to those of an extended model () with a single disk.
In conclusion, the optically thick regime is required to match the observed FIR SED, both in models with standard and extended dust distribution. FIR scalelengths are larger in extended models with respect to standard models. The 100m scalelength is very similar to that derived on IRAS images, but the 200m scalelength is always smaller than that measured by ISO. It is not possible to produce B/200m scalelength ratios as small as in Alton et al. (1998c), for any of the models presented here.
7 Discussion
As shown in the previous sections, models with a central face-on optical depth are necessary to explain the SED observed in the FIR for NGC 6946. A high optical depth through the central regions of the galaxy has also been found by Engargiola (1991) and Devereux & Young (1993). Evans (1992) and Trewhella (1998b) apply the energy balance method to the stellar and dust emission of NGC 6946, using a TRIPLEX model, i.e. an analytical approximation for the radiative transfer, neglecting scattering, in a standard mode (Disney et al. 1989). They both derived high optical depths for the disk, using the data inside the half light radius. Evans (1992) measured , while Trewhella (1998b) . A high optical depth is also suggested by high-resolution sub-mm SCUBA images: the diffuse inter-arm emission in the NE spiral arms at a distance of 2 () is compatible with (Bianchi et al. 2000a). Xu & Buat (1995) carried out an energy balance on a sample of 134 nearby spirals with available UV, B and IRAS fluxes. They derived a mean optical depth . A direct comparison between their result and the optical depth needed by our model to explain the FIR output may lead to the wrong conclusion that we have overestimated the amount of absorbed energy. However, the mean ratio of bolometric luminosity absorbed by dust for their sample ( 1/3) is similar to that predicted by our models for NGC 6946. The difference depend on their adopted geometry, a plane-parallel homogeneous model for dust and stars. If the dust is associated with the dominant gas component, like observations suggest, our choice of an exponential distribution seems more appropriate. For the same optical depth, their model results much more effective in extinguishing radiation. For example, in the UV, Xu & Buat adopt dust and stellar distributions of the same thickness (a slab model Disney et al. 1989) and isotropic scattering with albedo =0.18. By opportunely setting scalelengths and truncations, the BFG model can produce results for a slab. At their UV reference wavelength Å, 60% of the radiation is absorbed by dust, for their adopted UV extinction law. Because of their low albedo, scattering does not play a relevant role in the radiative transfer. In our corresponding UV4 band, the standard model absorbs only 50% of the radiation. In the optical, they adopt a sandwich model, with the thickness of the stellar distribution twice that for dust. At Å, their model absorbs 20% of the radiation, while the standard model 40%.
In our simulations most of the radiation is absorbed in the Optical-NIR spectral range (60% for light at Å). This was alredy noted for NGC 6946 by Trewhella (1998b). Xu & Buat (1995) reach opposite conclusions, with the non-ionising UV (912Å3650Å) contributing to 60% of the absorbed radiation. This is in part due to the model differences we have already discussed. Xu & Buat adopted a different thickness for the UV stellar distribution to simulate the thinner distribution of younger stars. We tried a similar approach by adopting the same scaleheight for dust and star at smaller (Bianchi 1999), but the fraction of radiation absorbed in the UV increased only by a 5%. Furthermore, the SED observed in NGC 6946, with a peak in the NIR, may be different from the mean characteristic of the Xu & Buat sample. The UV selected sample may be biased toward bright UV galaxies, although this hypothesis is dismissed in Buat & Xu (1996).
Another major difference between our model and that of Xu & Buat (1995) is in the ionising UV longward of 912Å. In their work the absorption of Lyman continuum photons contributes as much as 20% to the total FIR emission in a sample of 23 late type galaxies. Our omission of this spectral range from the radiative transfer, due to the lack of empyrical data, may result in an overestimate of the optical depth. To test our approximation, we derived the ionising UV from H observations of NGC 6946 (Kennicutt & Kent 1983), assuming standard ionisation conditions as in HII regions (Lequeux 1980). After correcting for the [NII] contamination (25% for spirals), Galactic extinction () and internal extinction (30% for the R-band, where the H line is located, for a standard model), we derived an intrinsic unextinguished H flux,
| (14) |
Following Xu & Buat (1995), the Lyman continuum flux can be derived as
| (15) |
of which 75% is assumed to be absorbed by gas and converted into emission lines at larger wavelengths (see also Mezger 1978; DeGioia-Eastwood 1992). Allowing the remaining 25% to be entirely absorbed by dust and adopting a lower limit MIR correction of % (Sect. 9), the total FIR luminosity originating from the absorption of ionising photons is
| (16) |
for the assumed distance of 5.5 Mpc. This correspond to only 2% of the total FIR luminosity emitted by the standard =5 model. As a comparison, the contribution to the FIR from the EUV band for the same model is 3.6%. The ionising UV contribution is similar for all the models that roughly provide the same amount of FIR energy as that observed. Therefore, it is justified to omit the ionising radiation in the model. The approach of Xu & Buat (1995) is different from the one presented here. Their UV contribution includes direct absorption of Lyc photons and indirect (via emission lines), while in the present model the absorption of emission line photons is taken care of in the spectral band where the emission occurs (e.g. in the R-band for the H line), the total contribution of re-combination is summed up to the stellar SED for each band. Nevertheless, their ratio between Lyc emission and total absorbed energy is similar to the one derived here.
A wrong MIR correction could also be responsible for an underestimation of the FIR emission in our model. The fraction of absorbed energy that goes into MIR emission depends essentially on the absorption of light from the short wavelength spectrum, since the absorption efficiency of small grains responsible for non-equilibrium processes is higher in the UV (Sect. 9). For the model presented here, with a dust scaleheight smaller than the stellar one, the amount of energy absorbed from UV bands does not increase very much with the optical depth (The saturation effect, Bianchi et al. 1996). The MIR corrections for these models are therefore quite constant, 32% of the total absorbed energy being re-emitted in the MIR. Even for models with higher efficiency in extinguishing radiation, like the optically thick model with a thicker dust distribution, the fraction of the total energy emitted in the MIR is not very different from this value (Bianchi 1999).
For the local ISRF the contribution of small grain emission to the 60 m IRAS band is 62%, while at 100 m it is only 14% and at 200 m 4% (Désert et al. 1990). Therefore, the fraction of energy emitted in non equilibrium heating can be roughly estimated by measuring the MIR emission shortward of 60 m. After integrating a continuous SED interpolated from the data points in Table 3, the MIR energy is derived to be 34% of the total infrared energy emitted by dust. The value derived from observation is very close to the model one. This justifies the use of the Désert et al. (1990) dust model as described in Sect. 9. It is interesting to note that the infrared galactic spectrum used in the Désert et al. (1990) model is different from the one of NGC 6946. As an example, the ratio between fluxes at 60 m and 100 m is 0.2, while it is 0.5 from the NGC 6946 data. This does not necessarily mean that the dust model of Désert et al. (1990) cannot be applied to NGC 6946. The different ratio could be due to different heating conditions in the local interstellar radiation field, with respect to the mean radiation field of NGC 6946. Larger ratios between 60 m and 100 m can be derived from the Désert et al. (1990) model when the ISRF is larger than the local. As already said, emission from small grains can contribute to part of the observed FIR flux. However, for a wide range of heating conditions, the contribution close to the peak of FIR emission is minimal Désert et al. (1990). Since modelled and observed fluxes are compared in this spectral range, the assumption that all FIR emission occurs at thermal equilibrium does not affect sensibly our results.
The position of the peak emission in the modelled FIR SED clearly shows that the dust temperature in the simulations is not severely different from the real one. Recently, Stickel et al. (2000) extracted high signal-to-noise sources from the ISOPHOT Serendipity Survey. Fluxes at 170 m were measured for 115 sources having a galaxy association, most of which are spirals, and integrated with 100m IRAS data. The distribution of the ratio of 170m and 100 fluxes is quite well confined, with half of the galaxies having a ratio between 1 and 1.5. For the emissivity adopted here, this translates in a colour temperature in the range 23-28 K. Similar colour temperatures (24-26K) can be derived from the ratios of the total fluxes at 100 and 200m, in any of our models. Using emissivities derived from Galactic emission and exinction, Bianchi et al. (1999) found that the value of the dust mass for a small sample of galaxies does not depend dramatically on the assumed spectral behaviour of the emissivity. This can be easily interpred if dust temperatures in external galaxies are similar to those in the Milky Way. Because of these similarities, and of the small dependence of the temperature on the assumed model, it is not too audacious to compare values measured on the present models with the high quality observations of the Galaxy.
Dust temperatures at high latitude are quite constant in the Galaxy (Reach et al. 1995; Lagache et al. 1998; Schlegel et al. 1998). For the emissivity adopted here, a temperature of 21K can be derived (Bianchi et al. 1999). Remarkably, nearly all the models present a similar temperature at a galactocentric distance of 3 (the Sun position, for =8.5kpc and a Galactic scalelength of 3kpc). Sodroski et al. (1997) decompose the Galactic FIR emission observed by DIRBE into three components, associated with the atomic, molecular and the ionised gas phases, and derive the temperature for four annulii at different galactocentric distance. Fig. 6 shows the temperature of the dust associated with the atomic gas (supposedly heated mainly by the diffuse ISRF) for each annulus. Data have been scaled to a Galactic scalelength kpc and corrected for the emissivity law used in this work. In Fig. 6 we also plot the temperature radial profile for four representative models: the and standard models; the model; and the model with a dust disk associated with each of the two gas phases. Clearly, all the simulations presented here have a temperature gradient compatible with the Galactic one.

Because of the lack of high resolution observations in the FIR, the derivation of temperature gradients in external galaxies is more difficult. Davies et al. (1999b) derived the temperatures from 100m IRAS and 200m ISO fluxes at two different position on NGC 6946, in the centre and on the disk at 3 arcmin from the centre. After smoothing for the ISO resolution, our models are compatible with those observations (Bianchi 1999).
For any model, the FIR scalelengths increase with the wavelength of emission, the ratio and, although slightly, with the optical depth. Therefore, larger FIR scalelengths can be found in optically thick extended models. For the extended model, that provides a good fit to the SED, the 100m scalelenght is very close to the value derived from IRAS images. The scalelength is larger than scalelength at 100m. However, it is 30% smaller than that observed by ISO. It has not been possible to find a model able to reproduce the large 200m scalelength measured by Alton et al. (1998c) in a sample of seven galaxies including NGC 6946. The B-band ratio is close to that observed for the extended and standard models. Alton et al. derived a ratio 0.9 between the B and 200m scalelengths. Because of the dependence of the B-band scalelength on , similar ratios can be obtained only for optically thin extended models. Such models fail to predict both the SED and the absolute values of the FIR scalelengths. A possible reason for the discrepancy between observations and models may reside in the transition effects of the ISOPHOT detectors. Memory effects during the scanning of a bright source affects the P32 mapping mode. Alton et al. checked for this problem by conducting the scalelength analysis on both in-scan and cross-scan directions and concluded that the effects were negligible. However, a proper analysis requires a knowledge of the underlying light distribution and a description of the transient effects, which are still poorly understood. The P32 mapping mode is still not scientifically validated (Klaas & Richards 2000).
We have carried out a few test to check for the influence of different stellar distributions, like including a small bulge appropriate for a late type galaxy or having a smaller vertical scalelength for younger stars (Bianchi 1999). The result were not significantly different from those presented here. A basic assumption of all our models is that the intrinsic (not extinguished) radial stellar scalelength is the same at any wavelength. According to this view, the larger scalelengths observed in the optical are due to extinction, rather than to intrinsic color gradients. As outlined in Sect. 2.1, the problem is still very debated. A simple test can be conducted here to assess the influence of scalelength variations with . Let’s assume that the measured B-band scalelength (1.3) is more representative of the intrinsic radial variation of the stellar distribution. By substituting with 1.3, the results of Table 4show that standard or extended models with or 1 have an observed (after smoothing) B-band scalelength quite similar to the one of Alton et al. (1998c), the difference between observed and intrinsic scalelength due to the smoothing process, rather than to extinction. Since the modelled B/200m scalelength ratio remains the same, these optically thin cases may have a 200m scalelength close to the observed. However, the fraction of energy absorbed in these models will remain the same as well. Therefore, the optically thin models will still be unable to produce the required energy output in the FIR. Furthermore, most of the energy is absorbed in the NIR, where the peak of stellar emission occurs. In this spectral range our K-band based is surely a better description for the galaxy radial scalelength.
We also produced a model with two dust distributions, a standard disk associated with the molecular gas dominant in the central part of NGC 6946, and a disk associated with the broader distribution of atomic gas. Even with the presence of such an extended distribution, the double disk model is dominated by the optically thick disk associated to the H2 necessary for the FIR emission. For what concerns FIR scalelengths, the same results as for the extended model are obtained. It is interesting to note that for the parameters adopted here for the two dust disks and assuming the atomic + molecular gas mass of Table 2, the gas-to-dust mass ratio is 180, close to the Galactic value of 160 (Sodroski et al. 1994). Similar values can be retrieved from all the optically thick models.
The high optical depth of the models contrasts with the recent determination of optical depth in edge-on spirals by Xilouris et al. (1999). Using a sample of seven edge-on galaxies, they find a mean central face-on optical depth . The higher opacity of NGC 6946 may be a result of the galaxy being very gas-rich (Tacconi & Young 1990); or it may be due to clumping of the ISM, affecting in a different way FIR and optical determinations of the optical depth. While FIR observations detect all of the dust (at least when the temperature of the clump and inter-clump medium are similar), optical observations may be affected preferentially by the extinction of the smoother, lower density (and optical depth) inter-clump medium.
To our knowledge, only two works in literature discuss the effects of clumping within the framework of a radiative transfer model for spiral galaxies. Kuchinski et al. (1998) distribute clumps in the dust disk assuming a constant filling factor and a value for the ratio between densities in clumps and in the nearby smooth medium. The other model is by Bianchi et al. (2000b), based on the BFG radiative transfer code, as the present work. Bianchi et al. (2000b) modelled the clump distribution in a similar way to the distribution of molecular gas in the Galaxy. The clump properties were derived from those observed in Giant Molecular Clouds. A comparison with the Kuchinski et al. (1998) results indicates a strong dependence of the observed brightness profiles on the detailed internal and spatial distribution properties of clumps. This makes the interpretation of the data very difficult. For the same dust mass, it is found that a clumpy dust medium has lower extinction. However, when a fraction of the stellar radiation is allowed to be emitted from inside the clumps, as for Giant Molecular Clouds hosting star-formation, extinction increases and can reach higher values than those for homogeneous models.
Predictions of the influence of clumping on the FIR models are not easy. If the dust component associated with the H2 is clumped, it could be responsible for most of the FIR emission, when embedded stellar emission is considered. A diffuse component associated with the HI would be responsible for a reduced derived from the analysis of edge-on galaxies. For the models of Bianchi et al. (2000b), it is unlikely that a clumpy distribution with a large dust mass (corresponding to an optically thick smooth distribution) has an optically thin apparent as measured by Xilouris et al. (1999). However, the models of Bianchi et al. (2000b) are based on the Galaxy, while clumping based on the different distributions of atomic and molecular gas in NGC 6946 may have a different behaviour. Clumping will also affect the spatial distribution of the FIR emission. Dust in clumps is shielded from the ISRF and heated to lower temperature. Depending on the distribution of cold dust clouds, a broader 200m emission could be produced.
Two recent models include clumping of dust and embedded stellar emission to describe the radiative transfer and FIR emission of NGC 6946. However, the complexity of the models prevents an isolation of the effect of the dust distribution on the FIR heating. Silva et al. (1998) fit the observed optical and FIR SED of NGC 6946 with their galactic photometric evolution model, adopting a simplified treatment for the radiative transfer in the diffuse medium and a separate model for dust in clumps. They find that nearly half of the dust emission comes from within molecular clouds. The adopted distributions for smooth dust and stars are different from those in Sect. 6: the radial scalelengths are the same for both dust and stars, as well as the vertical scalelengths; the radial scalelength is twice the one adopted here; the disk is thicker by a factor of two. Since we use the same SED and their model is optically thin to B-band radiation (only 10% of radiation absorbed), most of the FIR emission must come from absorption of UV photons in the molecular cloud distribution. A distribution of molecular clouds compatible with the galactic gravitational potential, together with a smooth phase modelled on the atomic gas, is used by Sauty et al. (1998) to study the FIR emission in NGC 6946. The radiative transfer is carried out using the Monte Carlo technique only for the UV radiation emitted in star-forming regions within the molecular clouds. The ISRF at Å is derived from a R-band map of the galaxy, scaled on the Galactic local ISRF. As in our case, the observed FIR emission can be explained only with substantial extinction. However, they find that emission at Å contributes 72% of the total FIR, while in the present work energy absorbed from optical radiation is dominant.
Therefore, according to the models of Silva et al. (1998) and Sauty et al. (1998), the dominant contribution to the dust heating comes from young stars. If this is true, the recent star-formation rate of a galaxy could be measured using FIR fluxes. These are more readily available than other tracers of star-formation (Devereux & Young 1991). In a series of papers, Devereux & Young (1993, and references therein) compared FIR and H fluxes and suggested that the FIR luminosity is dominated by warm dust absorbing radiation from OB stars. However, this result is debated. Walterbos & Greenawalt (1996) modelled the FIR emission in spiral galaxies, deriving the diffuse ISRF from optical profiles and estimating the dust column density from the atomic gas. For a sample of 20 galaxies, they found that dust heated by a diffuse ISRF can account for, on average, half of the observed IRAS fluxes. Using large nearby objects it is possible to decompose the FIR emission into the different sources of heating. Xu & Helou (1996a) measure the ratio between the IRAS 60m and H fluxes from bright FIR-resolved sources in M31. Using the total H luminosity and the Désert et al. (1990) dust model, they extrapolate the fraction of the total luminosity emitted by dust that is associated with HII regions and star-formation. A value of 3014% only is found. A decomposition of the Galactic flux observed by COBE at 140m and 240m shows that most of the dust emission (70%) arises from dust associated with the atomic gas (Sodroski et al. 1994), with temperature gradients compatible with a diffuse ISRF heating. Only 20% of the FIR is emitted by dust associated with the molecular component and 10% is due to hot dust associated with the HII phase.
The smooth models presented here attempt to explain the FIR emission without invoking dust heated in star-forming regions. Under the assumption of a diffuse stellar emission and dust, we find that radiation at Å contributes 30% to the total FIR, this including the ionising UV. This percentage will surely increase when a clumpy dust structure is adopted. The high optical depths necessary to produce the observed energy may be an overestimation because we neglect clumpy hot dust. However, without a proper model for the radiative transfer and dust emission in a clumpy medium, it is not easy to understand if the results shown here are severely biased by the assumption of smooth distributions.
Finally, we tried to model the FIR emission with an extra dust component, a spherical halo. The presence of dust in the halo of normal, non-active, spirals is predicted as a result of the imbalance between the radiation pressure and the galactic gravitational force (Davies et al. 1999a). A halo of cold gas clouds, able to explain part of the dark matter in spiral galaxies, may be stabilized by the presence of dust grains (Gerhard & Silk 1996). Unfortunately, it is difficult to obtain information about a putative dusty halo. Because such a distribution would act as a screen for the galactic disk, the radiative transfer fits of Xilouris et al. (1999) are unable to detect it. Analysing the difference in colours of background objects between fields at different distances from the centre of two nearby galaxies, Zaritsky (1994) find a B-I colour excess in the inner fields. He derived a dust halo scalelength of 318 kpc, although the measured colour difference is only 2 of the statistical noise.
Because of the high uncertainty of the halo parameters, we simply used a spherical homogeneous dust halo, together with a standard disk. The halo has the same radial dimension as the dust and stellar disks, i.e. 6. Among the models we tried, the case in which for both halo and disk provides a reasonable fit to the FIR emitted energy and scalelengths (Bianchi 1999). However, when the galaxy is seen edge-on, such a dust distribution would be easily observable, within the resolution and sensitivity of available FIR observations. Alton et al. (1998b) studied the FIR emission in 24 edge-on galaxies, including starburst and quiescent objects, using HiRes IRAS images. None of the object was found to be resolved along the minor axis.
8 Summary and conclusions
We have described in this paper a model for dust emission in spiral galaxies, based on the Monte Carlo radiative transfer code of Bianchi, Ferrara & Giovanardi (1996). For each relative star-dust geometry and dust optical depth, the radiative transfer code is carried out for 17 different photometric bands, covering the spectral range of stellar emission. In the application to NGC 6946 presented here, we have chosen a model stellar SED and dust distribution that produces the same fluxes as those observed in the UV-Optical-NIR images. The code also produces a map of the total energy absorbed by dust. For each position inside the galaxy, dust is heated by an ISRF consistent with the radiative transfer itself, without any other assumption. The dust temperature is computed from the absorbed energy, using the emissivity derived by Bianchi et al. (1999) for Galactic dust and correcting for the contribution of non-thermal equilibrium processes to the emission. Hence, FIR maps can be easily obtained for any wavelength, integrating along a specific line of sight.
The model optical and FIR scalelengths and the SED have been compared to NGC 6946 observations. Several models have been explored. It is found that optically thick dust disks (5) are needed to match the observed FIR output. Approximately one third of the total stellar radiation is absorbed by dust in this case. The temperature distributions are quite similar, for any of the dust disk models. Temperature values in the models are comparable with those observed in our Galaxy and other spirals.
We have compared the modelled FIR scalelengths with the observations of Alton et al. (1998c). Extended dust disk model with (Davies et al. 1997; Xilouris et al. 1999) have larger FIR scalelengths than standard models with . For optically thick cases, the 100m scalelength is close to the value derived on IRAS images. Alton et al. (1998c) found that the B-band scalelength of NGC 6946 is smaller than the 200m one by a factor 0.9 (0.8 for a sample of seven galaxies). We have not been able to reproduce the large FIR scalelengths measured on 200m ISO data. In the required optically thick regime, the scalelength ratio B/200m is always larger than observed. Smaller ratios can be obtained only in optically thin cases, but the absolute values for the scalelengths are smaller. The results are not improved if two dust disks modelled on the gas distribution are used. The behaviour of the model is dominated by the standard optically thick disk associated with the molecular component, rather than the very extended dust distribution associated with HI. A spherical dust halo could produce results closed to those observed, but would also be easily detected in currently available FIR observations, which is not.
The high optical depth found for NGC 6946 contrasts with recent determinations on edge-on spiral galaxies Xilouris et al. (1999). This may be a result of our assumption of a smooth distribution for stars and dust. The inclusion of clumping in a proper model of radiative transfer and FIR emission is therefore desirable. However, the heavy dependence of clumping on the assumed model makes the modelling more complicate. Future high resolution and sensitivity instrumentation will therefore be essential to define the dust distribution and limit the number of parameters in the model. Clumping may also be responsible for the discrepancy between the observed and modelled scalelengths at 200 m, if a diffuse component of cold dust clumps shielded from the ISRF is present. On the other hand, it is necessary to remind here that the results of Alton et al. (1998c) at 200m are based on data which is not yet scientifically validated. Again, future FIR instrumentation or a set of validated data will help to asses if the large scalelengths are an artefact of the ISOPHOT detector transients or if they are the genuine results of a temperature distribution different from the one we have derived here.
The main purpose of the paper was the presentation of the model itself. A test has been conducted on a well studied galaxy. However, NGC 6946 is very gas rich (Tacconi & Young 1990) and its characteristics may be different from those of a ’mean’ galaxy. Optical and FIR data are available for several galaxies. A future paper will be devoted to their analysis and more general conclusions about the dust distribution and extinction will be drawn.
Acknowledgements.
The work of this paper has benefitted from comments and discussion with many people. Among them we wish to remember M. Trewhella, Z. Morshidi, R. Smith, A. Kambas, J. Haynes, Rh. Evans, Rh. Morris, A. Whitworth, A. Ferrara, S. Kitsionas, P. Gladwin, N. Francis and an anonymous referee. S.B. acknowledges a PhD studentship from the Department of Physics and Astronomy at Cardiff University.References
- Alton et al. (1998a) Alton P.B., Bianchi S., Rand R.J., et al., 1998a, ApJ 507, L125
- Alton et al. (1998b) Alton P.B., Davies J.I., Trewhella M., 1998b, MNRAS 296, 773
- Alton et al. (1998c) Alton P.B., Trewhella M., Davies J.I., et al., 1998c, A&A 335, 807
- Bianchi (1999) Bianchi S., 1999. Ph.D. thesis, Cardiff University. astro-ph/9911397
- Bianchi et al. (1996) Bianchi S., Ferrara A., Giovanardi C., 1996, ApJ 465, 127
- Bianchi et al. (1998) Bianchi S., Alton P.B., Davies J.I., et al., 1998, MNRAS 298, L49
- Bianchi et al. (1999) Bianchi S., Davies J.I., Alton P.B., 1999, A&A 344, L1
- Bianchi et al. (2000a) Bianchi S., Davies J.I., Alton P.B., et al., 2000a, A&A 353, L13
- Bianchi et al. (2000b) Bianchi S., Ferrara A., Davies J.I., et al., 2000b, MNRAS 311, 601
- Bohlin et al. (1978) Bohlin R.C., Savage B.D., Drake J.F., 1978, ApJ 224, 132
- Buat & Xu (1996) Buat V., Xu C., 1996, A&A 306, 61
- Byun et al. (1994) Byun Y.I., Freeman K.C., Kylafis N.D., 1994, ApJ 432, 114
- Calzetti et al. (1994) Calzetti D., Kinney A.L., Storchi-Bergmann T., 1994, ApJ 429, 582
- Cashwell & Everett (1959) Cashwell E.D., Everett C.J., 1959, A Practical Manual on the Monte Carlo Method for Random Walk Problems. Pergamos, New York
- Davies et al. (1997) Davies J.I., Trewhella M., Jones H., et al., 1997, MNRAS 288, 679
- Davies et al. (1999a) Davies J.I., Alton P.B., Bianchi S., et al., 1999a, MNRAS 300, 1006
- Davies et al. (1999b) Davies J.I., Alton P.B., Trewhella M., et al., 1999b, MNRAS 304, 495
- de Grijs & van der Kruit (1996) de Grijs R., van der Kruit P., 1996, A&AS 117, 19
- de Grijs et al. (1997) de Grijs R., Peletier R.F., van der Kruit P.C., 1997, A&A 327, 966
- de Jong (1996) de Jong R., 1996, A&A 313, 377
- de Vaucouleurs (1959) de Vaucouleurs G., 1959, Handbuck der Physik, vol. 53. Springer, Berlin, p. 275
- de Vaucouleurs et al. (1991) de Vaucouleurs G., de Vaucouleurs A., Corwin Herold G. J., et al., 1991, Third Reference Catalogue of Bright Galaxies. Cambridge University Press, Berlin, RC3
- DeGioia-Eastwood (1992) DeGioia-Eastwood K., 1992, ApJ 397, 542
- Désert et al. (1990) Désert F.X., Boulanger F., Puget J.L., 1990, A&A 237, 215
- Devereux & Young (1990) Devereux N.A., Young J.S., 1990, ApJ 359, 42
- Devereux & Young (1991) Devereux N.A., Young J.S., 1991, ApJ 371, 515
- Devereux & Young (1993) Devereux N.A., Young J.S., 1993, AJ 106, 948
- Disney et al. (1989) Disney M., Davies J., Phillipps S., 1989, MNRAS 239, 939
- Draine & Lee (1984) Draine B.T., Lee H.M., 1984, ApJ 285, 89
- Engargiola (1991) Engargiola G., 1991, ApJS 76, 875
- Evans (1992) Evans R., 1992. Ph.D. thesis, Cardiff University
- Fendt et al. (1998) Fendt C., Beck R., Neininger N., 1998, A&A 335, 123
- Ferrara et al. (1999) Ferrara A., Bianchi S., Cimatti A., et al., 1999, ApJS 123, 437
- Fioc & Rocca-Volmerange (1997) Fioc M., Rocca-Volmerange B., 1997, A&A 326, 950
- Freeman (1970) Freeman K.C., 1970, ApJ 160, 811
- Fux & Martinet (1994) Fux R., Martinet L., 1994, A&A 287, L21
- Garcia-Gomez & Athanassoula (1991) Garcia-Gomez C., Athanassoula E., 1991, A&AS 89, 159
- Gerhard & Silk (1996) Gerhard O., Silk J., 1996, ApJ 472, 34
- Gordon et al. (1997) Gordon K.D., Calzetti D., Witt A.N., 1997, ApJ 487, 625
- Henyey & Greenstein (1941) Henyey L.G., Greenstein J.L., 1941, ApJ 93, 70
- Kennicutt & Kent (1983) Kennicutt R. C. J., Kent S.M., 1983, AJ 88, 1094
- Kent et al. (1991) Kent S.M., Dame T.M., Fazio G., 1991, ApJ 378, 131
- Kessler et al. (1996) Kessler M.F., Steinz J.A., Anderegg M.E., et al., 1996, A&A 315, L27
- Klaas & Richards (2000) Klaas U., Richards P., 2000, Release Notes for ISOPHOT OLP Version 8.4. , SAI/1999-068/Dc
- Kuchinski et al. (1998) Kuchinski L.E., Terndrup D.M., Gordon K.D., et al., 1998, AJ 115, 1438
- Kylafis & Bahcall (1987) Kylafis N.D., Bahcall J.N., 1987, ApJ 317, 637
- Lagache et al. (1998) Lagache G., Abergel A., Boulanger F., et al., 1998, A&A 333, 709
- Lemke et al. (1996) Lemke D., Klaas U., Abolins J., et al., 1996, A&A 315, L64
- Lequeux (1980) Lequeux J., 1980. In: Appenzeller I., Lequeux J., Silk J. (eds.), Star Formation, Proceedings of 10th Advanced Course of the Swiss Society of Astronomy and Astrophysics, SaasFee, Geneva
- Mezger (1978) Mezger P.O., 1978, A&A 70, 565
- Nelson et al. (1998) Nelson A.M., Zaritsky D., Cutri R.M., 1998, AJ 115, 2273
- Peletier et al. (1995) Peletier R., Valentijn E., Moorwood A., et al., 1995, A&A 300, L1
- Reach et al. (1995) Reach W.T., Dwek E., Fixsen D.J., et al., 1995, ApJ 451, 188
- Rice (1993) Rice W., 1993, AJ 105, 67
- Rice et al. (1988) Rice W., Lonsdale C.J., Soifer B.T., et al., 1988, ApJS 68, 91
- Rieke & Lebofsky (1985) Rieke G.H., Lebofsky M.J., 1985, ApJ 288, 618
- Rifatto et al. (1995a) Rifatto A., Longo G., Capaccioli M., 1995a, A&AS 109, 341
- Rifatto et al. (1995b) Rifatto A., Longo G., Capaccioli M., 1995b, A&AS 114, 527
- Robin et al. (1992) Robin A.C., Crézé M., Mohan V., 1992, A&A 265, 32
- Rowan-Robinson (1986) Rowan-Robinson M., 1986, MNRAS 219, 737
- Ruphy et al. (1996) Ruphy S., Robin A., Epchtein N., et al., 1996, A&A 313, L21
- Sauty et al. (1998) Sauty S., Gerin M., Casoli F., 1998, A&A 339, 19
- Schlegel et al. (1998) Schlegel D.J., Finkbeiner D.P., Davis M., 1998, ApJ 500, 525
- Silva et al. (1998) Silva L., Granato G.L., Bressau A., et al., 1998, ApJ 509, 103
- Sodroski et al. (1994) Sodroski T.J., Bennett C., Boggess N., et al., 1994, ApJ 428, 638
- Sodroski et al. (1997) Sodroski T.J., Odegard N., Arendt R.G., et al., 1997, ApJ 480, 173
- Spitzer (1978) Spitzer L., 1978, Physical Processes in the Interstellar Medium. Wiley, New York
- Stickel et al. (2000) Stickel M., Lemke D., Klaas U., et al., 2000, A&A submitted
- Tacconi & Young (1986) Tacconi L.J., Young J.S., 1986, ApJ 308, 600
- Tacconi & Young (1989) Tacconi L.J., Young J.S., 1989, ApJS 71, 455
- Tacconi & Young (1990) Tacconi L.J., Young J.S., 1990, ApJ 352, 595
- Trewhella (1998a) Trewhella M., 1998a, MNRAS 297, 807
- Trewhella (1998b) Trewhella M., 1998b. Ph.D. thesis, Cardiff University
- Tully (1988) Tully R.B., 1988, Nearby galaxies catalog. Cambridge University Press, Cambridge
- van der Kruit (1988) van der Kruit P.C., 1988, A&A 192, 117
- van der Kruit & Searle (1981) van der Kruit P.C., Searle L., 1981, A&A 95, 105
- van der Kruit & Searle (1982) van der Kruit P.C., Searle L., 1982, A&A 110, 61
- Wainscoat et al. (1989) Wainscoat R.J., Freeman K.C., Hyland A.R., 1989, ApJ 337, 163
- Wainscoat et al. (1992) Wainscoat R.J., Cohen M., Volk K., et al., 1992, ApJS 83, 111
- Walterbos & Greenawalt (1996) Walterbos R.A.M., Greenawalt B., 1996, ApJ 460, 696
- Whittet (1992) Whittet D.C.B., 1992, Dust in the Galactic Environment. Institute of Physics Publishing, Bristol
- Witt (1977) Witt A.N., 1977, ApJS 35, 1
- Witt et al. (1993) Witt A.N., Petersohn J.K., Holberg J.B., et al., 1993, ApJ 410, 714
- Wolf et al. (1998) Wolf S., Fischer O., Pfau W., 1998, A&A 340, 103
- Xilouris et al. (1999) Xilouris E.M., Byun Y.I., Kylafis N.D., et al., 1999, A&A 344, 868
- Xu & Buat (1995) Xu C., Buat V., 1995, A&A 293, L65
- Xu & Helou (1996a) Xu C., Helou G., 1996a, ApJ 456, 152
- Xu & Helou (1996b) Xu C., Helou G., 1996b, ApJ 456, 163
- Xu et al. (1997) Xu C., Buat V., Boselli A., et al., 1997, A&A 324, 32
- Young & Scoville (1991) Young J.S., Scoville N.Z., 1991, ARA&A 29, 581
- Zaritsky (1994) Zaritsky D., 1994, AJ 108, 1619