FUSE Observations of Molecular Hydrogen in Translucent Interstellar Clouds: The Line of Sight Toward HD 73882
Abstract
We report the results of initial FUSE observations of molecular hydrogen (H2) in translucent clouds. These clouds have greater optical depth than any of the diffuse clouds previously observed for far-UV H2 absorption, and provide new insights into the physics and chemistry of such regions. Our initial results involve observations of HD 73882, a well-studied southern hemisphere star lying behind substantial interstellar material ( = 0.72; = 2.44). We find a total H2 column density, N(H2) = 1.2 1021 cm-2, about three times larger than the values for diffuse clouds previously measured in the far-UV. The gas kinetic temperature indicated by the ratio N(=1)/N(=0) is 58 10 K. With the aid of ground-based data to calculate an appropriate multi-component curve of growth, we have determined column densities for all rotational levels up to = 7. The 2 states can be reasonably fitted with a rotational excitation temperature of 307 23 K. Both the kinetic and rotational temperatures are similar to those found in previous investigations of diffuse clouds. The ratios of carbonaceous molecules to hydrogen molecules are also similar to ratios in diffuse clouds, suggesting a similar chemistry for this line of sight.
Subject headings:
ISM: abundances — ISM: clouds — ISM: lines and bands — ISM: molecules — stars: individual (HD 73882) — ultraviolet: ISM1. Introduction
Molecular hydrogen is the most abundant molecular species in the Galactic interstellar medium. While H2 is an important constituent of diffuse interstellar clouds with visual extinctions less than about 1 magnitude, it becomes the dominant form of hydrogen in the so-called “translucent” clouds, which are characterized by in the range 1–5 mag. H2 dominates the dynamics, chemistry, and physics of denser clouds, and is the basic raw material for star formation.
Due to the homonuclear structure of H2 and its lack of a dipole moment, ro-vibrational transitions within the electronic ground state are quadrupolar with low spontaneous emission coefficients. They are therefore very difficult to observe except where special excitation conditions produce detectable ro-vibrational emission in the near-IR (e.g. Gautier et al. 1976) or from a space-borne observatory such as ISO, when a long enough line of sight ( 20) allows detection of the mid-IR pure rotational emission from warm diffuse gas (Falgarone et al. 2000). Cold H2, the dominant form, can be widely observed through electronic transitions in the far UV ( 1150 Å), or with difficulty in the IR, where the weak quadrupole transition can be observed in absorption only for very high column densities (Lacy et al. 1994).
Previous instruments capable of resolving the far-UV absorption bands of H2 include the Copernicus mission (Savage et al. 1977; Spitzer & Jenkins 1975), the IMAPS experiment (Jenkins & Peimbert 1997), and the ORFEUS spectrometer (Richter et al. 1998; de Boer et al. 1998). All of those, however, were limited to relatively bright stars with 1.
The FUSE observatory (Moos et al. 2000) is well suited for observations of cold H2 in the diffuse and translucent interstellar medium, owing to its high throughput in the wavelength region from 905 Å to 1187 Å, encompassing the strong Werner and Lyman bands of H2. A survey of H2 in these regions was therefore identified by the FUSE PI team as a project of high priority.
We have assembled a list of 35 lines of sight, which sample a wide variety of interstellar environments. These lines of sight, with 0.3 mag 1.1 mag, are also characterized by a range in extinction properties (determined both from and from the shape of the far-UV extinction curve). Most of the lines of sight have information on molecular abundances from previous optical and/or mm-wave data.
In conjunction with the FUSE observing program, we and several collaborators are obtaining additional data using various ground-based telescopes. We have obtained very high-resolution (R 150,000–250,000) spectra of interstellar K I, Na I, Ca II, and CH absorption along most of the lines of sight to understand the cloud velocity structure (Welty, Morton, & Snow 2000). We (led by DGY) are obtaining moderately high-resolution (R 50,000), very high S/N, nearly complete optical spectra to measure many of the diffuse interstellar bands, and the molecules CH, CH+, CN, C2, and C3. T. Oka and B. J. McCall are pursuing near-IR measurements of H3+, and we and F. Chaffee are conducting near-IR observations to compare grain mantle features such as water ice, the 3.4-m hydrocarbon band, and the silicate feature at 9.6 m, with the UV data on dust extinction and gas-phase depletions. The ultimate goals of this program are to fully understand the masses of dense interstellar clouds, to probe the chemistry and physics of translucent clouds, and to probe the transition region between diffuse and dense interstellar clouds.
In this Letter, we describe the first observations of H2 in a translucent cloud line of sight, toward the star HD 73882. The following sections describe the properties of the line of sight deduced from previous observations (§2), the FUSE observations and our analysis of the data (§3), and the insights gained from these new data (§4).
2. The Line of Sight toward HD 73882
The star HD 73882 is well known in the translucent cloud community because it is of early spectral type (O8.5V), it is bright enough ( = 7.27) to allow high-S/N observations at optical wavelengths, and it has sufficient foreground dust ( = 0.72, = 2.44) and gas to have large column densities of many atomic and molecular species. Fitzpatrick & Massa (1986, 1988, 1990) derived the UV extinction curve and the column density of atomic hydrogen from low-resolution IUE spectra. The extinction curve shows a steep far-UV rise with significant curvature, generally similar to other “dense cloud” curves, as characterized by Cardelli, Clayton, & Mathis (1988) – a conclusion reached previously for this star by Massa, Savage, & Fitzpatrick (1983). However, both the ratio of total to selective extinction ( = 3.9) and the wavelength of maximum polarization (Serkowski, Mathewson, & Ford 1975) suggest that small grains are not as important in this case as in most other molecular-cloud lines of sight. The molecular column densities listed in Table 1 support the view that this line of sight is dominated by one or more dense clouds, consistent with translucent cloud models (e.g. van Dishoeck & Black 1986).
A series of papers have provided ground-based data on CO, CH, CN, CH+, and C2 (van Dishoeck et al. 1991; Gredel et al. 1993; see Table 1). The CO emission line profiles reveal three distinct components toward HD 73882, at LSR velocities of +5.9, +8.9, and +11.2 km s-1. The absorption from the other molecular species, however, is seen only in a single component near +4.5 km s-1. Using the 3.6-m reflector and coudé echelle spectrometer at ESO and the 0.9-m coudé feed telescope and coudé spectrograph at KPNO, we have obtained very high-resolution ( 150,000–250,000) spectra of Na I, K I, and Ca II absorption toward HD 73882. A profile-fitting analysis of the K I and Na I lines reveals no fewer than 20 velocity components, spread over 55 km s-1. However, the absorption is dominated by three narrow ( 0.7 km s-1), blended components at +2.7, +4.3, and +5.9 km s-1, with significant contributions from two others at +7.7 and +11.0 km s-1. The blend centered at +4.3 km s-1 probably corresponds to the single (unresolved at 60,000—100,000) absorption component seen in CH, CN, CH+, and C2, and to the CO emission component at +5.9 km s-1. The two slightly weaker atomic components may correspond to the two other CO components at +8.9 and +11.2 km s-1. (Note that the CO column density quoted in Table 1 is only for the +5.9 km s-1 component.) The numerous weaker features seen in the optical data may arise in outlying less dense clouds.
3. FUSE Observations and Data Analysis
Our FUSE spectrum of HD 73882 is derived from time-tagged observations over the course of 8 orbits on 1999 Oct 30. Several “burst” events occurred during the observation (Sahnow et al. 2000). We excluded all photon events that occurred during the bursts, reducing effective on-target integration time from 16.8 ksec to 16.1 ksec. Strong interstellar extinction and lack of co-alignment of the SiC channels with the LiF channels prevented the collection of useful data shortward of 1010 Å.
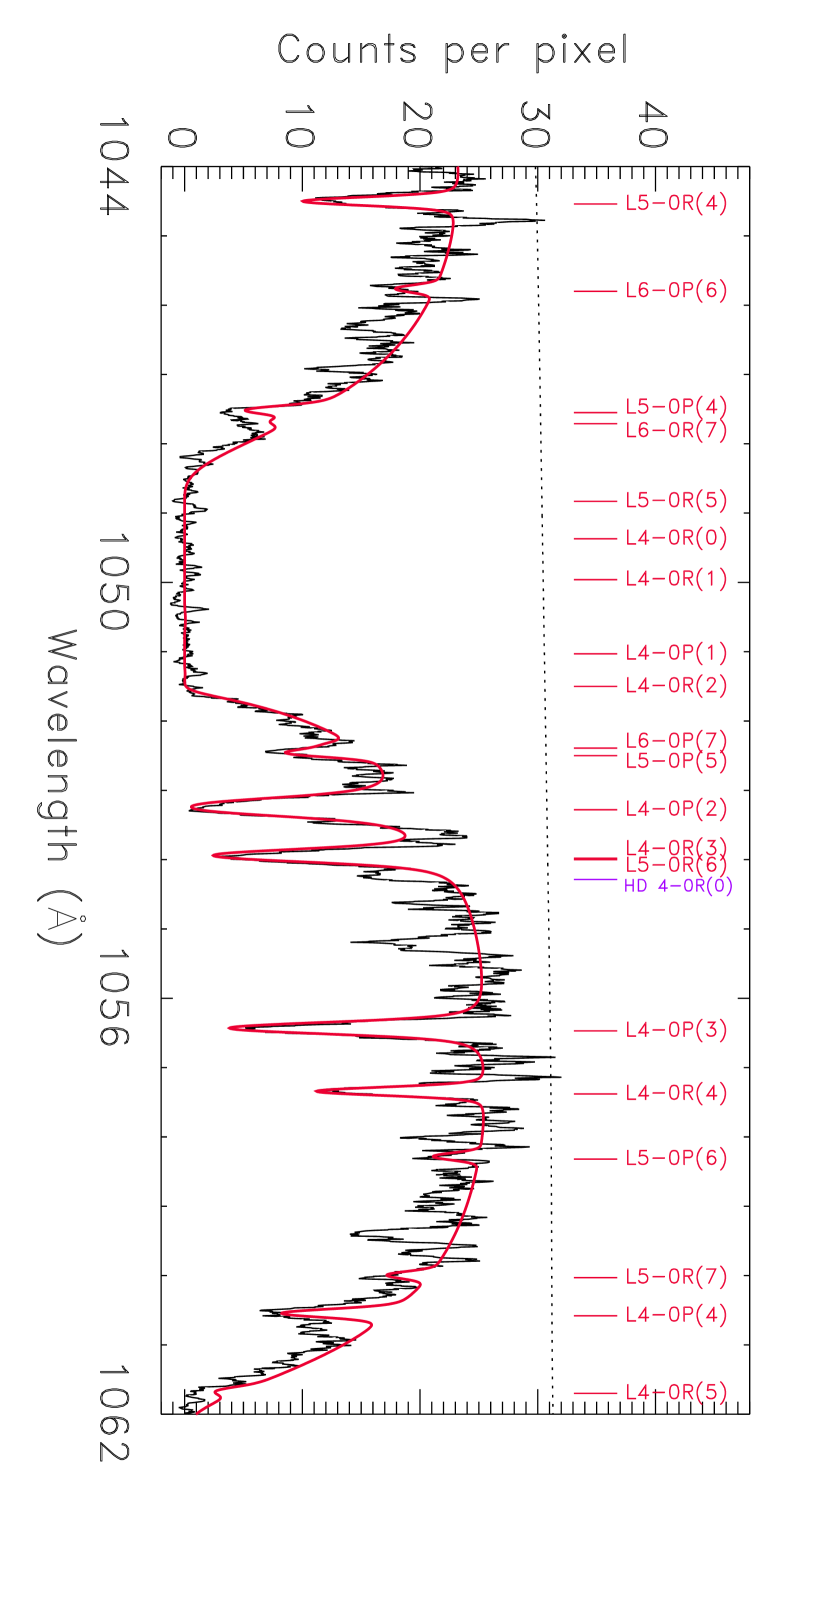
We performed a simple “collapse” of the 2-dimensional spectral image to a 1-dimensional spectrum, summing 100 pixels (LiF 1A segment) or 120 pixels (LiF 2A) in each column, and we determined the background level in a similar way. This extraction compares favorably to a subsequent pipeline processed spectrum. In the regions of interest, we obtained a maximum S/N of 20 per 15-pixel resolution element in the LiF 1A segment, and 30 in LiF 2A. The wavelength solution was derived from narrow lines in the diffuse cloud line of sight to LMC star Sk67 111 (Shull et al. 2000). Some residual scatter remained in the wavelength solution ( 6 km s-1), precluding a detailed analysis of line velocities in this study. Figure 1 depicts a portion of our spectrum, along with our model of the H2 lines described in the following paragraph.
The column densities for the = 0 and = 1 levels come from direct fits to the profiles of the corresponding heavily damped lines. The resolution of the FUSE spectra (R 12,000) is not sufficient to separate the narrow, closely spaced components contributing to the interstellar line profiles of the high- lines. In view of the generally good correlation between the column densities of Na I and H2 (Federman 1981; Welty & Hobbs 2000) for N(Na I) 1012 cm-2, we have used the five strongest Na I components described in §2 to model the H2 lines. The velocity structure for Na I was preserved for H2, and the observed -values for the Na I components were scaled to H2 by the relation
Given the relatively narrow range of column densities, we have assumed a one-to-one scaling between Na I and H2. The predicted H2 component structure is given in Table 2. From this structure we calculated a curve of growth and determined the column densities for 2 using 29 H2 lines. This curve of growth (similar to a single component with = 3 km s-1) is given in Figure 2, while the column densities are given in Table 3. The data in Tables 2 and 3 were used to calculate the model of the H2 spectrum given in Figure 1.
Lying on or near the saturation portion of the curve of growth, the column densities for 4 are highly sensitive to the assumed component structure. If more than five Na I components trace significant amounts of H2, the larger “effective” -value yields column densities for = 4 and = 5 decreased by an order of magnitude or more. Similarly, if the H2 structure is less complex than we have assumed or if components 4 and 5 trace less H2 (as suggested by the CH data of Gredel et al. 1993), the opposite situation occurs. The = 5 lines would be shifted 0.5 dex to the damping portion of the curve of growth, and the column densities for the = 6 and = 7 lines could be increased by 0.5 dex or more.
4. Discussion
The total H2 column density of 1.2 1021 cm-2 we have measured toward HD 73882 is statistically identical to the largest previously observed via far-UV absorption spectroscopy, 1.1 1021 cm-2 toward HD 24534 (Mason, et al. 1976). The molecular fraction = 2N(H2)/[2N(H2) + N(H I)] is = 0.65, nearly identical to that found toward Zeta Oph ( = 0.63; Bohlin, et al. 1978). The only known larger value, = 0.80, toward HD 24534 (Snow et al. 1998), will be redetermined via a planned FUSE observation.
The abundances of CO, CN, CH, and C2, relative to the total hydrogen abundance, are more similar to those found in diffuse clouds (i.e. toward Zeta Oph) than in dark clouds. Because these molecular abundances represent only a small fraction of the presumed total carbon abundance, we conclude that the clouds toward HD 73882 have not reached the predicted transition point where carbon becomes primarily molecular (e.g. van Dishoeck & Black 1986). The limited data presently available also suggest that the depletions toward HD 73882 are similar to those found in cold diffuse clouds, an issue we will explore in more detail in a future paper (Rachford et al. 2000).
In principle, the CO abundance can be derived from our FUSE spectrum. However, the best candidate lines, from the C–X (0,0) band at 1088 Å, lie on the flat portion of the curve of growth where the derived abundance is highly sensitive to the chosen -value.
Our derived H2 column density, combined with the line-of-sight extinction properties cited above, show that the ratio of hydrogen, both molecular and total, to dust extinction, is also similar to the value found for diffuse clouds (Bohlin et al. 1978).
The ratio of molecules in = 1 to = 0 (ortho- to para-hydrogen) is usually interpreted as a measure of the gas kinetic temperature, because in these clouds the collisional timescale for depopulating these levels is shorter than the radiative timescale. Our N(1)/N(0) ratio yields K, consistent with the average value K found for diffuse clouds with Copernicus data (Savage et al. 1977). Shull et al. (2000) find a somewhat larger value in a small sample of FUSE data.
The excitation diagram in Figure 3 shows that the levels in this line of sight are not in thermal equilibrium at , but instead follow a different distribution characterized by an excitation temperature, K. Non-thermal excitation of the high- levels has been explained in terms of UV pumping, in which the molecules cascade down through upper rotational and vibrational lines following the absorption of a UV photon (Black & Delgarno 1973). In this case, the excited H2 may arise in the outer, optically thin regions of the cloud, rather than in the self-shielded interior. If so, the high- lines may exhibit small velocity shifts or enhanced -values. However, the limited spectral resolution and uncertain wavelength scale of our FUSE data precludes a sensitive search for these effects.
It is noteworthy that even in a line of sight thought to be dominated by molecular cloud material within a single cloud complex, the velocity structure is very complicated. This structure, along with the similarities between the current results and previous results for diffuse clouds, suggests the possibility that we looking through several Zeta Oph-type clouds rather than a single very dense cloud.
Our analysis of the excited rotational levels of H2 depends heavily on high-resolution ground-based optical absorption and mm-wave emission line data to which we had access. It is thus imperative for future FUSE interstellar-line observations to obtain appropriate high-resolution spectra in order to have any hope of unambiguous interpretation of the lower resolution data.
References
- (1)
- (2) Bohlin, R. C., Savage, B. D., & Drake, J. F. 1978, ApJ, 224, 132
- (3) Black, J. H. & Dalgarno, A. 1973, ApJ, L101
- (4) Cardelli, J. A., Clayton, G. C., & Mathis, J. S. 1988, ApJ, 329, L33
- (5) de Boer, K. S., Richter, P., Bomans, D. J., Heithausen, A., Koornneef, J. 1998, A&A, 338, L5
- (6) Falgarone, E., Verstraete, L., Pineau des Forêts, G., Flower, D., & Puget, J.-L. 2000, in H2 in Space, Eds.: F. Combes, G. Pineau des Forêts (Cambridge University Press, Astrophysics Series), in press
- (7) Federman, S. R. 1981, A&A, 96, 198
- (8) Ferlet, R., et al. 2000, ApJ, this issue
- (9) Fitzpatrick, E. L. & Massa, D. 1986, ApJ, 307, 286
- (10) Fitzpatrick, E. L. & Massa, D. 1988, ApJ, 328, 734
- (11) Fitzpatrick, E. L. & Massa, D. 1990, ApJS, 72, 163
- (12) Gautier, T. N., III, Fink, U., Larson, H. P., & Treffers, R. R., 1976, ApJ,207, L129
- (13) Gredel, R., van Dishoeck, E. F., & Black, J. H. 1993, A&A, 269, 477
- (14) Jenkins, E. B. & Peimbert, A. 1997, ApJ, 477, 265
- (15) Lacy, J. H., Knacke, R., Geballe, T. R., & Tokunaga, A. T. 1994 ApJL, 428, L69
- (16) Massa, D., Savage, B. D., & Fitzpatrick, E. L. 1983, ApJ, 266, 662
- (17) Mason, K. O., White, N. E., Sanford, P. W., Hawkins, F. J., Drake, J. F., & York, D. G. 1976, MNRAS, 176, 193
- (18) Moos, H. W., et al. 2000, ApJ, this issue
- (19) Rachford, B. L., Snow, T. P., et al. 2000, in preparation
- (20) Richter, P., et al. 1998, A&A, 338, L9
- (21) Savage, B. D., Drake, J. F., Budich, W., & Bohlin, R. C. 1977, ApJ, 216, 291
- (22) Sahnow, D. et al. 2000, ApJ, this issue
- (23) Serkowski, K., Mathewson, D. L., & Ford, V. L. 1975, ApJ, 196, 261
- (24) Shull, J. M. et al. 2000, ApJ, this issue
- (25) Snow, T. P., Hanson, M. M., Black, J. H., van Dishoeck, E. F., Crutcher, R. C., & Lutz, B. L. 1998, ApJ, 496, L113
- (26) Spitzer, L. & Jenkins, E. B. 1975, ARA&A, 13, 133
- (27) van Dishoeck, E. F., Phillips, T. G., Gredel, R., & Black, J. H. 1991, ApJ, 366, 141
- (28) van Dishoeck, E. F. & Black, J. H. 1986, ApJS, 62, 109
- (29) Welty, D. E., & Hobbs, L. M. 2000, in preparation
- (30) Welty, D. E., Morton, D. C., & Snow, T. P. 2000, in preparation
- (31)
| Species | N | Reference |
|---|---|---|
| (cm-2) | ||
| H I | 1.3 1021 | Fitzpatrick & Massa 1990 |
| K I | 2.4 1011 | Welty et al. 2000 |
| Na I | 2.6 1013 | Welty et al. 2000 |
| Ca II | 4.2 1012 | Welty et al. 2000 |
| CH | 3.7 1013 | Gredel et al. 1993 |
| CH+ | 2.4 1013 | Gredel et al. 1993 |
| C2 | 6 1013 | Gredel et al. 1993 |
| CN | 3.8 1013 | Gredel et al. 1993 |
| CO | 3.2 1016 | van Dishoeck et al. 1991 |
| Comp. | Rel. strength | ||
|---|---|---|---|
| (km s-1) | (km s-1) | ||
| 1 | 0.195 | 0.98 | +2.62 |
| 2 | 0.358 | 0.98 | +4.20 |
| 3 | 0.187 | 0.98 | +5.83 |
| 4 | 0.097 | 1.21 | +7.56 |
| 5 | 0.163 | 1.16 | +10.85 |
| log NJ | Error | |
|---|---|---|
| (cm-2) | (cm-2) | |
| 0 | 20.91 | 0.1 |
| 1 | 20.59 | 0.1 |
| 2 | 19.1 | 0.2 |
| 3 | 18.5 | 0.3 |
| 4 | 17.5 | 0.3aaThe high- lines are subject to shifts larger than the quoted errors with changes in the component structure; see text. |
| 5 | 17.0 | 0.3aaThe high- lines are subject to shifts larger than the quoted errors with changes in the component structure; see text. |
| 6 | 14.5 | 0.8aaThe high- lines are subject to shifts larger than the quoted errors with changes in the component structure; see text. |
| 7 | 14.4 | 0.5aaThe high- lines are subject to shifts larger than the quoted errors with changes in the component structure; see text. |
| Total | 21.08 | 0.1 |