An X-ray burst with strong photospheric radius expansion
observed from the source 4U1724307 in Terzan 2
Abstract
We present results of the RXTE observations of an extremely intense X-ray burst detected from the source 4U1724307 in the globular cluster Terzan 2. The burst profile was complex consisting of two precursors and a long primary peak. During the first (strong) precursor the source luminosity, , was comparable with that measured in the main event. The structure of the profile, its dependence on energy and observed spectral evolution indicated strong photospheric expansion of a neutron star. The effective temperature and radius of the photosphere were estimated from the black body model at different stages of expansion, their correlations and specific features of the profile were analyzed and discussed.
Key Words.:
stars: neutron – globular clusters: individual: Terzan 2 – X-rays: bursts, stars1 Introduction
Many bright X-ray sources in globular clusters are X-ray bursters. The source in Terzan 2, the metal-rich cluster located in the Galactic center field, is likely the most peculiar one. In 1975 September a strong ( Crab in a peak flux) and long ( s) burst was detected from the region by OSO-8 (Swank et al. (1977)). Grindlay (1978) was the first who associated it with Terzan 2 and noted that the source 4U172230 could be its persistent counterpart. The source position in the Uhuru catalogue was found affected by contamination of nearby sources. After correction for this effect the coincidence in positions of the source, the burster and Terzan 2 became obvious. Since that time the source is known as 4U1724307.
The identification of the burster with the cluster was confirmed during the second X-ray burst detected by the Einstein HRI in 1979 March (Grindlay et al. (1980)). The source was localized to be within the cluster core of ″ in radius (Grindlay et al. (1984)). Recent ROSAT HRI images (Mereghetti et al. (1995)) also revealed a single source less than 2″ off the position determined by Einstein.

Since 1979 only two new X-ray bursts were reported from the source in addition to the two already mentioned. The one was detected by the ART-P telescope on board Granat in 1992 February (Grebenev et al. (2000)) and another – by the MECS spectrometer on board BeppoSAX in 1996 August (Guainazzi et al. (1998)). All the four reported bursts were extremely bright with short rise and long decay time scales that is a characteristic of the type I bursts. For all the bursts the complex spectral behaviour was observed during the initial phase along with the gradual spectral softening during the decay phase. In spite of such similarity some features in the burst profile detected with ART-P (see Fig. 1) made that event to be different from the other ones. In particular, a strong narrow precursor was detected a few seconds before the beginning of the primary peak that was a direct evidence for the nearly Eddington luminosity and quick photospheric radius expansion of a neutron star in 4U1724307. In this letter we present and discuss the first results of timing and spectroscopy for another exceptionally bright X-ray burst with strong photospheric radius expansion which was detected from 4U1724307 by the Rossi X-ray Timing Explorer.
2 Observations
In 1996-1998 4U1724307 was observed by RXTE many times with a total exposure exceeding 330 ks but with the only X-ray burst detected. This event occurred on November 8, 1996 during the first orbit of the observation started at 6:58 a.m. (UT). All the five units of the proportional counter array (PCA) were operated that time.
The burst profile in the 2-60 keV energy band (which is presented in Fig. 1 and discussed below) is based on the Standard-1 mode data taken from the PCA xenon layers. These are the data without energy resolution. For the spectral analysis the Burst Catcher mode data were used recorded in 64 energy channels with 2-ms time resolution. This mode, adapted to high count rate, was unfortunately switching off all the time when the rate fell below cts/s, e.g. during the period taken place between the precursor and primary event. The data in the Science Event mode could not be used because of strong memory restrictions and long (8 s) “readout” time. To measure the spectra just before and in s after the burst we used the Standard-2 mode data with the 16-s integration time.
Our research is focused on the X-ray burst only. Spectral and timing properties of the source persistent emission were investigated with RXTE earlier and reported by Olive et al. (1998) and Barret et al. (1999a).
3 Profile of the burst and precursors
Fig. 1 shows the temporal profile of the burst in the broad PCA energy band with 0.5-s time resolution. The moment “0” corresponds to 7:00:03 a.m. (UT). The burst began with an extremely strong ( Crab) precursor event which lasted s. Then a 2-s quiet interval was observed during which the flux fell by times from the level measured before the burst. The drop is well seen in the insertion to Fig. 1. A weak burst (the second precursor) followed this time interval and gave a start for the primary event. The second precursor was about 1.5-s long and a factor of 6 weaker than the first one. The primary event itself was Crab in a peak and had rather a complex shape and a duration in excess of 150 s. In general the observed profile was very similar to that detected by ART-P from 4U1724307 on February 17, 1992 (Fig. 1). The coincidence could be even better if the profiles obtained by PCA at high keV energies (where ART-P was most sensitive) were used (Fig. 2). ART-P being a coded-mask telescope localized its burst with a few arcmin accuracy and identified it with Terzan 2 (Grebenev et al. (2000)). The similarity in the two profiles allows us to conclude that the burst detected by PCA occurred in the same source.


In Fig. 2 we show the PCA count rate as a function of time in four different energy bands. The moment ”0” is the same as in Fig. 1. The gap in the data in 3.25-7.75 s after the precursor onset resulted from the Burst Catcher mode switching off mentioned in sec. 2. The figure exhibits several notable features in the burst and precursor profiles. It shows that although the first rise in the flux occurred simultaneously and at nearly the same rate in all bands, the time of reaching the maximum and the typical time scale of the flux decline were different in the soft and hard bands. During the precursor the peak flux was reached in and s after the onset in the 3.15-7.9 and 16-25 keV bands, respectively. Thus, the precursor was longer in the soft band. On the contrary, during the primary event the rise in the soft flux was much prompter and the peak was reached in and 27 s in the same bands. The peak observed at high energies was accompanied by a dip-like feature in the 3.15-7.9 keV light curve. Such behaviour reflected strong changes in the source hardness occurred during the burst. The bottom panel in Fig. 2 indicates that the maximum hardness was observed twice – during the precursor (in s after the onset) and during the primary event (in s). And it slowly decreased during the decay of both events. Remarkably that the second precursor was connected with the rise in the soft flux only. Fig. 3 shows the burst profile taken from the propane anodes of PCA which are sensitive to very soft ( keV) photons. In this band the second precursor was comparable in strength with the first one. The bottom panel shows the hard X-ray profile from the xenon anodes (the same as in Fig. 1 but with better time resolution). Note that both the profiles are given here without background subtraction.
A long exponential decay present in the profile beginning since s is a characteristic of the type I bursts. Using the data for the first 60 s of the decay we estimated its time scale to be s at low energies and decreasing to s at high energies. The strong observed precursor comparable in a peak flux with the primary event was on the contrary a completely unusual feature for X-ray bursts. Although bursts with precursors were observed earlier (Lewin et al. (1993)), 4U1724307 was likely the first source in which the precursors were so powerful.
4 Spectral evolution during the burst
For further analysis we got more than 100 consecutive photon spectra with an integration time of 0.25 s (to cover the precursor and the rise phase of the primary event) and 1 s (to cover the rest part of the burst). The spectra were approximated in the 3-20 keV band with the black body model. The interstellar absorption was taken into account with fixed at (as measured by ASCA, see Barret et al. 1999b ). The persistent spectrum was not subtracted. The drop in its flux by a factor of 8 which followed the precursor has shown that the persistent source was hidden by the expanding photosphere or suppressed by huge energy release in the burst. It is unclear when the flux was able to recover and what the level was. The HEXTE spectrometer which could clarify this point had insufficient sensitivity at short time scales. We will see that neglect by the persistent emission was not crucial for our analysis because of exceptional power of this burst.


Fig. 4 presents several typical spectra of the source at different phases of the burst. The best-fit approximation is shown by solid lines. The persistent spectrum accumulated during 16 s before the burst and adequately fitted by the absorbed power law model with the photon index is shown by triangles in the bottom panel and indicated by dashed lines in the other panels. Note that the spectrum measured at s exhibits the lack of X-rays at keV in comparison with the persistent one. Note also that the spectrum measured at s, in the far tail of the burst, points on the persistent emission recovery and its contribution to the flux at keV. The spectrum obtained in 300 s after the onset was already very coincident with that observed before the burst.
The figure explains the evolution of the source hardness described in sec. 3. Just after the onset (in 0.5 s) the source had a hard spectrum corresponding to the black body temperature keV. The temperature fell by 4 times during the next 2 s. After the gap in the PCA data, again was found to be small keV but it quickly rose and reached keV in s after the onset. The gradual decrease of followed this maximum and continued up to the end of the observation. The detailed information on the evolution of spectral parameters ( and – the black body radius of the neutron star photosphere) is presented in Fig. 5. In the same figure we show the source bolometric luminosity ( is the Stefan-Boltzmann constant) as a function of time. The distance to Terzan 2 was taken to be 6.6 kpc (Barbuy et al. (1998)).
5 Discussion
Fig. 5 shows that the initial ( s) stage of the burst was connected with strong photospheric expansion (during the precursor) and contraction (during the primary event). The observed radii were in excess of 70 km, velocities – of . The peak value of the luminosity, , was equal to the Eddington limit for a neutron star and helium-rich material. While expanding, the photosphere got cool, its spectrum softened and the fraction of photons with energies within the PCA band decreased. That was the reason why the first narrow precursor appeared in the burst profile.
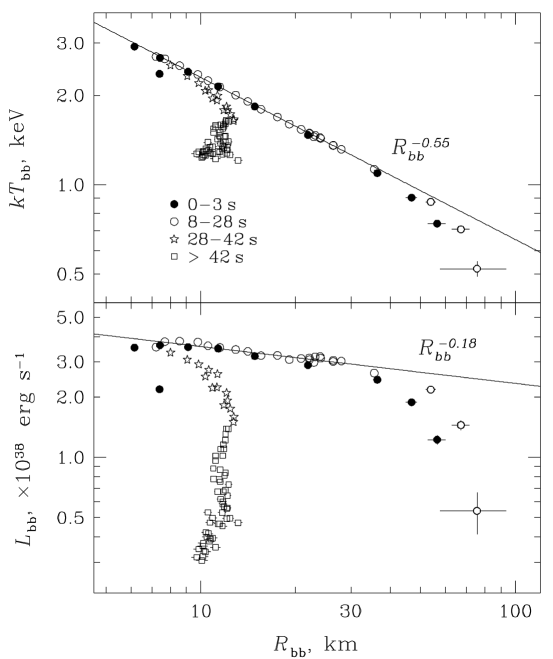
The dependence of on during photospheric expansion and contraction is shown in Fig. 6 by filled and open circles, respectively. It could be described by a single law with which implies that the luminosity slowly decreased while the radius increased in contrast with the usual suggestion that it remains constant and very close to the Eddington limit (Lewin et al. (1993)). This issue may however be hasty taking into account that our simple spectral modeling ignored distortions produced in the spectrum by Comptonization in the outer layers of the photosphere (Ebisuzaki & Nomoto (1986); Sunyaev & Titarchuk (1986)). Comptonization may be also responsible for the decrease in observed in and 27 s after the onset (in comparison with the value km found in the burst tail).
The total emitted energy thus the mass of exploded matter where is the efficiency of helium burning. The Thomson depth of such matter Really, only its small part could be involved in expansion. For a few seconds after the precursor, the photosphere, extended but still opaque, completely hid the region in which the gravitational energy of accreted matter was released. The flux from the source fell below the persistent level. It is unclear however whether the accretion efficiency was at the persistent level, , that time. The burst could destroy process of steady accretion onto the source. The photospheric sound crossing time increased during expansion and could reach seconds if exceeded a few km. Respectively, the second precursor in the burst profile could be explained by photospheric oscillations.
Assuming to be we can estimate the burst recurrence time . Here is the persistent luminosity. The obtained value is 1.4 times smaller than the RXTE exposure.
Acknowledgements.
This research based on the data obtained through the HEASARC Online Service. We thanks R.Sunyaev, N.Inogamov, M.Revnivtsev for useful discussion and acknowledge support by RBRF grants 98-02-17056 and 99-02-18178.References
- Barbuy et al. (1998) Barbuy, B., Bica, E., Ortolani, S. 1998, A&A, 333, 117
- (2) Barret, D., et al. 1999a, ApJ, in press (astro-ph/9911042)
- (3) Barret, D., Grindlay, J., Harrus, I., et al. 1999b, A&A, 341, 789
- Ebisuzaki & Nomoto (1986) Ebisuzaki, T., Nomoto, K. 1986, ApJ, 305, L67
- Grebenev et al. (2000) Grebenev, S., Lutovinov, A., et al. 2000, Astron. Lett., in press
- Grindlay (1978) Grindlay, J.E. 1978, ApJ, 224, L107
- Grindlay et al. (1980) Grindlay, J., Marshall, H., Hertz, P., et al. 1980, ApJ, 240, L121
- Grindlay et al. (1984) Grindlay, J., Hertz, P., Steiner, J., et al. 1984, ApJ, 282, L16
- Guainazzi et al. (1998) Guainazzi, M., Parmar, A., et al. 1998, A&A, 339, 802
- Lewin et al. (1993) Lewin, W., van Paradijs, J., Taam, R. 1993, SSRev, 62, 223
- Mereghetti et al. (1995) Mereghetti, S., Barret, D., et al. 1995, A&A, 302, 713
- Olive et al. (1998) Olive, J.F., Barret, D., Boirin, L., et al. 1998, A&A, 333, 942
- Sunyaev & Titarchuk (1986) Sunyaev, R., Titarchuk, L. 1986, Sov. Astron. Lett., 12, 359
- Swank et al. (1977) Swank, J., Becker, R., Boldt, E., et al. 1977, ApJ, 212, L73