Is the diffuse Gamma Background Radiation generated by
Galactic Cosmic Rays?
Arnon Dara,b and A. De Rújulaa
a Theory Division, CERN, CH-1211 Geneva 23, Switzerland
b Technion, Israel Institute of Technology, Haifa 32000, Israel
Abstract
We explore the possibility that the diffuse gamma-ray background radiation (GBR) at high galactic latitudes could be dominated by inverse Compton scattering of cosmic ray (CR) electrons on the cosmic microwave background radiation and on starlight from our own galaxy. Assuming that the mechanisms accelerating galactic CR hadrons and electrons are the same, we derive simple and successful relations between the spectral indices of the GBR above a few MeV, and of the CR electrons and CR nuclei above a few GeV. We reproduce the observed intensity and angular dependence of the GBR, in directions away from the galactic disk and centre, without recourse to hypothetical extragalactic sources.
PACS numbers: 98.70.Sa, 98.70.Rz, 98.70.Vc.
1 Introduction
The existence of an isotropic, diffuse gamma background radiation (GBR) was first suggested by data from the SAS 2 satellite (Thompson & Fichtel 1982). The EGRET instrument on the Compton Gamma Ray Observatory confirmed this finding: by removal of point sources and of the galactic-disk and galactic-centre emission, and after an extrapolation to zero local column density, a uniformly distributed GBR was found, of alleged extragalactic origin (Sreekumar et al. 1998). Above an energy of MeV, this radiation –to which we shall refer throughout simply as “the GBR”– has a featureless spectrum, shown in Fig. 1, which is very well described by a simple power-law form, , with (Sreekumar et al. 1998).
The origin of the GBR is still unknown. The published candidate sources range from the quite conventional to the decisively speculative. Perhaps the most conservative hypothesis for the origin of an isotropic GBR is that it is extragalactic, and originates from active galaxies (Bignami et al. 1979; Kazanas & Protheroe 1983; Stecker & Salamon 1996). The fact that blazars have a -ray spectrum with an average index , compatible with that of the GBR, supports this hypothesis (Chiang & Mukerjee 1998). The possibility has also been discussed that Geminga-type pulsars, expelled into the galactic halo by asymmetric supernova explosions, be abundant enough to explain the GBR (Dixon et al. 1998; Hartmann 1995). More exotic hypotheses include a baryon-symmetric universe (Stecker et al. 1971), now excluded (Cohen et al. 1998), primordial black hole evaporation (Page & Hawking 1976; Hawking 1977), supermassive black holes formed at very high redshift (Gnedin & Ostriker 1992), annihilation of weakly interactive big-bang remnants (Silk & Srednicki 1984; Rudaz & Stecker 1991), and a long etc.
However, the EGRET GBR data in directions above the galactic disk and centre show a significant deviation from isotropy, correlated with the structure of our galaxy and our position relative to its centre (Dar et al. 1999). This advocates a local (as opposed to cosmological) origin for the GBR. Indications of a large galactic contribution to the GBR at large latitudes were independently found by Dixon et al. (1998) by means of a wavelet-based “non-parametric” approach that makes no reference to a particular model. Strong & Moskalenko (1998) and Moskalenko & Strong (2000) also found that the contribution of inverse Compton scattering of galactic cosmic ray electrons to the diffuse -ray background is presumably much larger than previously thought. In this paper we go one step further and explore in detail the possibility (Dar et al. 1999) that the diffuse gamma-ray background radiation at high galactic latitudes could be dominated by inverse Compton scattering of cosmic ray (CR) electrons on the cosmic microwave background radiation and on starlight from our own galaxy. In Section 2 we briefly review the GBR data and the evidence for its correlation with our position in the Galaxy.
The CR-proton and CR-electron spectra are briefly reviewed in Section 3. The origin, spectrum and composition of non-solar cosmic ray protons and nuclei have been debated for almost a century. The measurements now extend over some 30 orders of magnitude in flux and some 15 orders of magnitude in energy, up to an astonishing GeV (Bird et al. 1995, Takeda et al. 1998, Berezinskii et al. 1990 and references therein). Above GeV, this spectrum has also a power-law form , with two small variations in the “index” at the so-called “CR knee” and “CR ankle”. The local spectrum of CR electrons, shown in Fig. 2, is much harder to measure; it is only known up to GeV and, above GeV, it is also well described by a simple power law.
In Sections 4 and 5 we discuss relations between the indices of the GBR and the CR electron and proton spectra. In so doing, we make few and very simple assumptions: that the mechanism accelerating CR hadrons and CR electrons is the same (a moving magnetic “mirror”), that the locally-measured electron spectrum is representative of its average form throughout the Galaxy, that above a certain energy, inevitably, the electron spectrum is modulated by inverse Compton scattering on starlight and on the microwave background radiation, and that the GBR is dominated by the resulting Compton up-scattered photons. This allows one to derive, successfully, the GBR index from the electron index and the electron index from the proton index. The GBR index, as observed by EGRET, is uncannily directionally uniform. We interpret this fact as strong support for our simple assumptions.
In Section 6 we tackle a more difficult and potentially controversial subject: the origin and magnitude of the GBR. In a sense, our proposed explanation –that the GBR originates from inverse Compton scattering in our own galaxy (Dar et al. 1999) – is more conservative than any of the previously suggested origins.
The non-conventional aspect of our hypothesis is that, in order to reproduce the observed intensity of the GBR, we must assume the scale height of our galaxy’s CR-electron distribution to be almost twice the traditionally-accepted upper limit. Because of this, in Section 6, we briefly review the basis of the conventional wisdom and our critical view of it, whose main points are the following. Moskalenko, Strong and their collaborators have developed a very detailed understanding of the CR, radio and observations of our galaxy. To fit the data, their models require a freely parametrized reacceleration of electrons, presumably by the motion of turbulent magnetic fields (e.g., Seo & Ptuskin, 1994). Strong & Moskalenko (1998) introduce a cutoff for the height above the galactic plane above which cosmic rays freely escape. They find an upper limit kpc, on the basis of a fit to the ratio observed by Ulysses (Connell 1998). This result is “soft”: twice the upper limit would still be compatible with the ensemble of data (Lukasiak et al. 1994). Moreover, the galactic CR proton distribution extracted from a fit to EGRET -ray data, actually favours (Strong & Moskalenko 1998) an ad hoc distribution of CR sources that is not as well localized in the disk as the conventional supernova-remnant sources are (Webber 1997), even if kpc or more. This point, and the necessity to invoke CR reacceleration, indicate that scale heights of the CR electron distribution in excess of the 12 kpc “upper limit” may not be out of the question. Our results are optimized by a scale height of roughly 20 kpc. Such a large scale height is not in contradiction with radio synchrotron-emission from our galaxy if the galactic disk and its magnetic field are embedded in a larger magnetic halo with a much weaker field.
In studying the possibility that the diffuse GBR is not extragalactic, one has two choices. The first is to extend to high galactic latitudes the elaborate models (with many parameters, reacceleration, and ad hoc modifications of the CR-proton and CR-electron energy and source distributions) that have been developed to describe the intricate nature of the observations at low galactic latitudes (Strong & Moskalenko 1998; Moskalenko & Strong 2000). The second is to adopt our very naive set of hypotheses and employ a simple cosmic-ray model with, by conventional standards, a large scale height for CR-electrons. Models of this type (Dar & Plaga 1999), wherein cosmic ray sources are directly injected at high galactic latitudes, have actually been proposed111The injector agents would be highly relativistic jets from the birth of compact objects in supernova explosions, leading to a CR population permeating a magnetized region of galactic-halo proportions and constituting a putative solution to the problem of the origin of the highest-energy cosmic rays, a qualitative description of the nuclear CR spectrum, and a possible explanation of jetted gamma-ray bursts..
In Section 7 we discuss the magnitude and angular-dependence of the two dominant contributions to the GBR within our model: inverse Compton scattering of galactic CR-electrons off the cosmic background radiation and starlight. In Section 8 we compute the small additive effect of sunlight, and in Section 9 we estimate the contribution from external galaxies, which is also sub-dominant. In Section 10 we compare our predictions with the data on the intensity and the angular dependence of the GBR. The results are very satisfactory and, within our model, lead to the conclusion that the GBR can be dominated by the emission from our own galaxy. We summarize our conclusions and predictions in Section 11.
2 The GBR data
We call “the GBR” the diffuse emission observed by EGRET by masking the galactic plane at latitudes , as well as the galactic centre at for longitudes , and by extrapolating to zero column density, to eliminate the and bremsstrahlung contributions to the observed radiation and to tame the model-dependence of the results. Outside the mask, the GBR flux integrated over all directions in the observed energy range of MeV to , shown in Fig. 1, is well described by a power law:
| (1) |
The overall magnitude in Eq. (1) is sensitive to the model used to subtract the foreground (Sreekumar et al. 1998; Strong et al. 1998), but the spectral index is not. The EGRET data are given in Sreekumar et al. (1998) for 36 domains, 9 values for each half-hemisphere. The spectral index is, within errors, extremely directionally uniform, as shown in Fig. 3, where we have plotted the EGRET results as functions of , the observation angle relative to the direction to the galactic centre (). The normalization is less homogeneous, but in directions well above the galactic disk and away from the galactic-centre region it has been found to be consistent with a normal distribution around the mean value: thus the claim of a possible extragalactic origin (Sreekumar et al. 1998).
In Fig. 4 we have plotted, as a function of , the EGRET GBR counting-rate above 100 MeV. This figure clearly shows, in three out of the four quarters of the celestial sphere, an increase of the counting rate towards the galactic centre. How significant is this effect? Let be the “reduced” per degree of freedom. The value for constant flux is 2.6: very unsatisfactory. A best fit of the form yields , a very large amelioration (for higher polynomials in the higher-order coefficients are compatible with zero: the fit does not significantly improve). Note also that at angles with larger than its mean value (), 10 out of the 12 data points are above the average flux, while at angles with , 18 out of the 24 data points are below the average. The probability for a uniform distribution to produce this large or larger a fluctuation is .
Even in directions pointing to the galactic disk and the galactic centre, EGRET data on -rays above 1 GeV show an excess over the expectation from galactic cosmic-ray production of ’s (Pohl & Esposito 1998). Electron bremsstrahlung in gas is not the source of the 1–30 MeV inner-Galaxy -rays observed by COMPTEL (Strong et al. 1997), since their galactic latitude distribution is broader than that of the gas. These findings also imply that inverse Compton scattering may be much more important than previously believed (Strong & Moskalenko 1998; Moskalenko and Strong, 2000; Dar et al. 1999).
3 The CR data
The cosmic ray nuclei have a power-law spectral flux with an index that changes at two break-point energies. In the interval eV, protons constitute of the CRs at fixed energy per nucleon, and their flux is (Berezinskii et al. 1990, and references therein):
| (2) |
In the interval eV, the spectrum steepens from to , flattening again to above .
The CR flux of electrons (Prince 1979; Nishimura et al. 1980; Tang 1984; Golden et al. 1984; Evenson & Meyers 1984; Golden et al. 1994; Ferrando et al. 1996; Barwick et al. 1998; Wiebel-Sooth & Biermann 1998), shown in Fig. 2, is well fitted, from to TeV by:
| (3) |
The terrestrial and solar magnetic fields and the solar wind modify the electron spectrum below GeV, so that the direct observations at those energies may deviate from the local interstellar spectral shape.
Cosmic ray electrons undergo inverse Compton scattering (ICS) off the ambient photon baths: starlight and the cosmic background radiation. The spectral indices of the GBR and electron spectra can be very simply and successfully related (Dar et al. 1999), if the GBR dominantly consists of photons whose energy has been uplifted by ICS, as we proceed to show.
4 The index of the GBR spectrum
The current temperature, number density and mean energy of the CMB are K, , and (Mather et al. 1993; Fixsen et al. 1996). The galactic starlight (SL) distribution is highly non-uniform, its average energy is eV. Consider the ICS of high energy electrons on these radiations. Assume the shape of the electron flux, Eq. (3), observed at GeV, to be representative of the average galactic spectrum. For the energy range of EGRET the Thomson limit is accurate even for ICS on SL, and the cross section is . The mean energy of the upscattered photons, –or , the mean energy loss per collision– is:
| (4) |
with or .
The ICS photon spectrum originating in our galaxy is the sum of CMB and SL contributions:
| (5) |
and is a function of the galactic latitude (b) and longitude (l) coordinates. The ICS final-photon spectrum –a cumbersome convolution (Felten & Morrison 1966) of a CR power spectrum with a photon thermal distribution– can be approximated very simply. Using again the index “i” to label the CMB and SL fluxes:
| (6) |
where is obtained from Eqs. (4) by inverting . We postpone to Section 6 the discussion of the model-dependent normalization factors and : effective column densities resulting from the convolution of the space distribution of CR electrons with those of starlight and of the CMB. Introducing the CR-electron flux of Eq. (3), of the form , into Eqs. (6), we obtain:
| (7) |
In the energy-range of EGRET, the CMB and SL contributions have the same spectral index, as do the small sunlight and external-galaxy contributions discussed in Sections 8 and 9.
The photon spectral index of Eqs. (7), which is related to that of the CR-electrons through , coincides with the measured one, Eq. (1). The electron spectrum of Eq. (3) describes the data in the range GeV, so that Eq. (7) should be valid above keV, the typical energy of photons up-scattered from the CMB. At GeV, at the upper end of the EGRET data, in the SL contribution should be replaced by the complete Klein–Nishina cross section, implying a steepening of the spectrum. The corresponding effect for the CMB contribution is at energy above the EGRET energy range.
In deriving Eqs. (7), we have assumed that the locally-measured slope of Eq. (3) is representative of the index of the spectrum of the electrons suffering ICS to produce the GBR, wherever they may be. The spectral index of the diffuse GBR observed by EGRET is independent of direction, as shown in Fig. 3. The statistical test for a flat distribution is surprisingly good: . This is encouraging support for our working hypothesis of an electron spectrum with a universal shape, and of a simple and dominant mechanism –ICS– to generate the GBR.
5 The index of the electron spectrum
To relate the spectra of CR electrons and protons, we need an estimate of the protons’ spectrum at their source. A source spectrum with index is obtained from collisionless shock simulations (Bednarz & Ostrowski 1998) or analytical estimates of acceleration by relativistic jets (Dar 1998). The CR spectrum of nuclei is modulated by their residence time in the Galaxy, . For a steady source of CRs the energy dependence of the observed flux is roughly that of . Observations of astrophysical and solar plasmas and of nuclear abundances as functions of energy (e.g. Swordy et al. 1990) indicate that , explaining , as in Eq. (2).
Practically all CR acceleration mechanisms invoke an ionized medium that is swept by a moving magnetic field, such as would be carried by the rarefied plasma in a supernova shell (Bhattacharjee & Sigl 2000) or by a ‘plasmoid’ of jetted ejecta (Dar & Plaga 1999). The magnetic field acts as a moving ‘mirror’ that imparts the same distribution in velocity, or Lorentz factor , to all charged particles. To the extent that particle-specific losses (such as synchrotron radiation) can be neglected at the acceleration stage, all source fluxes have the same energy-dependence. For electrons below the anticipated ‘electron’s knee’ at TeV, we expect , with . Confinement effects preserve this equality for ultrarelativistic electrons and protons: their behaviour in a magnetic maze is the same. But, unlike for hadrons, the ‘cooling’ time of electrons –that are significantly affected by the ambient radiation and magnetic fields– is shorter than their galactic confinement time, , above a relatively low energy. This implies that the CR electron spectrum is modulated mainly by the ICS, and not by the confinement time.
Electrons lose energy not only by ICS on starlight and the CMB, but also by synchrotron radiation on magnetic fields. All of these processes are essentially the same: scattering off photons, either real or virtual. The energy loss is governed by the rate at which a single electron interacts with the ambient electromagnetic fields, weighted by the corresponding average energy density: . Let (an inverse time) be the production rate of CR electrons, assumed to be constant (Berezinskii et al. 1990), and let be their source number-density spectrum. The actual density in an interval about is continuously replenished and depleted by electrons whose energy is being degraded by interactions. This leads to a steady-state situation in which production and losses are in balance. Using Eq. (4) we obtain:
| (8) |
For a relatively uniform galactic CR electron density, Eq. (8) also applies to the local electron flux . Substitute the spectrum into the flux version of Eq. (8) to obtain:
| (9) |
For electrons with we deduced that Thus, , in agreement with the data: Eq. (3) and Fig. 2. Above the ‘electron’s knee’ at TeV the spectrum should steepen up by , like that of CR hadrons (Dar 1998). The available spectral measurements extend only to TeV.
The energy density in the CMB is eV cm-3, coincidentally similar to that in starlight at our location: eV cm-3. If the local CR and magnetic energy densities are in equipartition, eV cm-3, again in the same ballpark. The cooling time of electrons in the ensemble of these fields is:
| (10) |
The galactic escape time of GeV electrons, which should be similar to that of CR protons (Swordy et al. 1990), has a weaker energy dependence than that of . At sufficiently low energy, then, , and processes other than Compton- or synchrotron cooling (such as Coulomb scattering, ionization losses and bremsstrahlung) become relevant. The slope of Eq. (9) should change as the energy is lowered. The spectrum of Fig. 2 shows such a change, but it occurs at , a range in which local modulations would mask the effect.
6 The scale height of CR electrons
The radio emission of galaxies seen edge-on –interpreted as synchrotron radiation by electrons on their local magnetic field– offers direct observational evidence for CR electrons well above galactic disks (e.g. Duric et al. 1998). For the particularly well observed case of NGC 5755, the exponential scale height of the synchrotron radiation is kpc. If the CRs and the magnetic field energy are in equilibrium, they should have similar distributions, and the exponential scale height of the electrons ought to be roughly twice that of the synchrotron intensity, which reflects the convolution of the electron- and magnetic-field distributions. The inferred value kpc for NGC 5755 may not be universal for spirals, since is very sensitive to the density and distribution of CR sources, gas and plasma in each particular galaxy. Moreover, the magnetic field may be in equipartition with cosmic rays only where the interstellar plasma is dense enough. It is quite possible for the CR electrons to be confined in a large magnetic halo with a field much smaller than that in the disk. For these reasons we must discuss the observations of our own particular galaxy.
Traditionally CR electrons and nuclei were assumed to have a distribution that snugly fit that of the visible part of the Galaxy –where their conventional sources lie– implying a scale height above the plane of the disk of kpc (Broadbend et al. 1989). As the data and their analysis became more elaborate, scale heights more than one order of magnitude larger were discussed (e.g. Strong et al. 1998). Since electrons lose energy to the ambient radiation close to their sources, which have traditionally been located in the disk, not very well understood CR-reacceleration phenomena have had to be invoked (e.g. Seo & Ptuskin 1994). Even with reacceleration, a conventional distribution of cosmic-ray sources fails to describe the observed GBR (Strong & Moskalenko 1998).
Over the years, Moskalenko, Strong and their collaborators have developed what is presumably the most elaborate and detailed understanding of the CR, radio and observations of our galaxy (Moskalenko et al. 1998; Moskalenko and Strong, 2000; Strong and Moskalenko, 1998; Strong et al. 1997; Strong et al. 1998). A crucial parameter in their models is the scale of the CR distribution orthogonal to the galactic plane, defined as the height above which CRs freely escape, as in a leaky-box model. Strong & Moskalenko (1998) conclude that lies between 4 and 12 kpc. The limits are based on the comparison of the ratio observed by Ulysses (Connell 1998) with model predictions as a function of , being all other parameters fixed at their adopted values. The dependence of the ratio on , shown in Fig. 9 of Strong & Moskalenko (1998) and reproduced here as Fig. 5, is very weak for kpc. At kpc, the prediction would be only some 1.3 standard deviations below the Ulysses central value, and even would be viable: the average of all previous and somewhat less precise observations, compiled in Lukasiak et al. (1994) and shown in Fig. 5a, would be in agreement with 20 or 40 kpc. For all these reasons and the ones stated in the introduction, we shall not refrain from considering scale heights above the 12 kpc upper limit quoted by Strong & Moskalenko (1998).
7 The CBB and SL contributions to the GBR
The spectral index of the GBR, derived in Section 4, is independent of the details of the spatial distribution of starlight. We have argued that the EGRET GBR data support the simple hypothesis of an electron spectral index that is independent of location. The predicted GBR index is then also independent of the magnitude of the electron spectrum as a function of position. In this section we use a simplified model of the electron and starlight distributions to compute the magnitude and angular dependence of the CMB and SL contributions to the GBR.
We adopt kpc (a value obtained from a rough fit of our results to the angularly-averaged fluence of the GBR) for the Gaussian scale height of the CR electron distribution of our galaxy in the direction perpendicular to the galactic plane. For the distribution in –the radial coordinate orthogonal to the galactic axis– we adopt a Gaussian scale height kpc; the results are quite insensitive to this parameter. The EGRET GBR data are not precise enough to be “invertible”, that is, for the actual high-latitude CR-electron distribution (Gaussian, exponential or otherwise) to be disentangled; a fact to be rediscussed anon, in view of our results. The distance of the solar system to the galactic centre is kpc. The factor in Eq. (6), which describes the angular dependence of the GBR photons due to ICS on the (uniformly distributed) CMB, is:
| (11) |
where r is the distance in the direction along the line of sight.
It is difficult to model in detail the contributionn from ICS on starlight (Hunter et al. 1997, Sreekumar et al. 1998). But we are only concerned with this light at high galactic latitudes, since the diffuse GBR of interest to us is that measured by EGRET by masking the galactic plane and centre. We make a coarse estimate by approximating the Galaxy’s starlight as that produced by a source at its centre with the galactic luminosity eV s-1 (Pritchet & van den Bergh 1999). The starlight contribution in Eq. (5) is then of the same form as Eq. (11), with traded for by the substitution:
| (12) |
For the CMB and starlight contributions to the GBR, averaged over the EGRET unmasked domain, we obtain, by integration of Eqs. (5), (6), (11), (12):
| (13) |
For scale heights and similar to the ones adopted (20 and 35 kpc, respectively), the CMB and SL contributions are comparable in magnitude, the first scales approximately linearly with while the second is rather insensitive to this parameter. The contribution to the CMB from sunlight and external galaxies, discussed in Section 8 and 9, adds corrections of 6% and (respectively) to Eq. (13), the total result is shown in Fig. 2. The fitted value of is imprecise: the starlight to CMB ratio is proportional to raised to a very poorly determined power, .
We can use our assumed Gaussian distribution of electrons in a halo, with vertical and radial scale heights and , to compute the diffuse -ray luminosity of our galaxy, which in our model is dominated by ICS on CMB and SL photons. Using Eqs. (5), (6), (11), (12) we obtain, for the luminosity in -rays of energy above E:
| (14) |
where . A future -ray telescope, such as GLAST, could possibly see the corresponding glow of Andromeda’s halo.
8 Sunlight contribution to the local GBR
We are only at a distance from the sun. This entails a small but non-negligible contribution to the locally-observed GBR, resulting from ICS off photons in the heliosphere. The corresponding photon flux is described by Eq. (7), with the substitution of by the mean energy of solar photons, and of by , the solar-photon column density along the line of sight. Let be the angle between the line of sight and the direction to the sun. Then:
| (15) |
For a uniform distribution during the EGRET data taking, the average column density is , resulting in a sunlight-induced GBR flux:
| (16) |
This contribution is roughly 6% of our galaxy’s result, Eq. (13). At GeV, the spectrum of Eq. (16) should steepen, since ICS should then be described by the Klein–Nishina cross section, and not by its low energy Thomson limit.
9 Extragalactic contribution to the GBR
To estimate this contribution, some concepts and numbers need to be recalled. Hubble’s constan’ is , with ; and are matter and vacuum cosmic densities in critical units: ; is the redshift factor. In a Friedman model, the time to redshift relation is , with . The luminosity density of the local universe (Ellis 1997) is . The combination provides an estimate of the average number density of ‘Milky-Way-equivalent’ galaxies. If the main sources of CRs are young supernova remnants or gamma-ray bursts, the CR production rate ought to be proportional (e.g. Wijers et al. 1997) to the star formation rate , recently measured up to redshift (Steidel et al. 1998).
The energy of CMB photons up-scattered by electrons at ‘epoch y’ is proportional to and it is subsequently redshifted by the same factor; hence the spectra from distant galaxies should have the same energy dependence as from our galaxy. The situation for SL photons is more complicated. Young galaxies are bluer than older ones, but this effect is overcompensated by the expansion redshift from a relatively low y, onwards. Yet, at the energies observed by EGRET, and for the redshift values of (1) that dominate the extragalactic contribution, all these blue- and red-shifts simply relocate the photon energy, while roughly maintaining the slope of the spectrum. For the sum of all galaxies, we estimate:
| (17) |
where is to be obtained from the luminosity of a Milky-Way-like galaxy, Eq. (14). For we interpolate the summary values of Steidel et al. (1998). In writing Eq. (17) we have ignored the fact that, above GeV, absorption by production on the IR-to-UV background becomes relevant (Salamon & Stecker 1998), so that the extragalactic contribution should be quenched.
10 Detailed comparison with the EGRET data
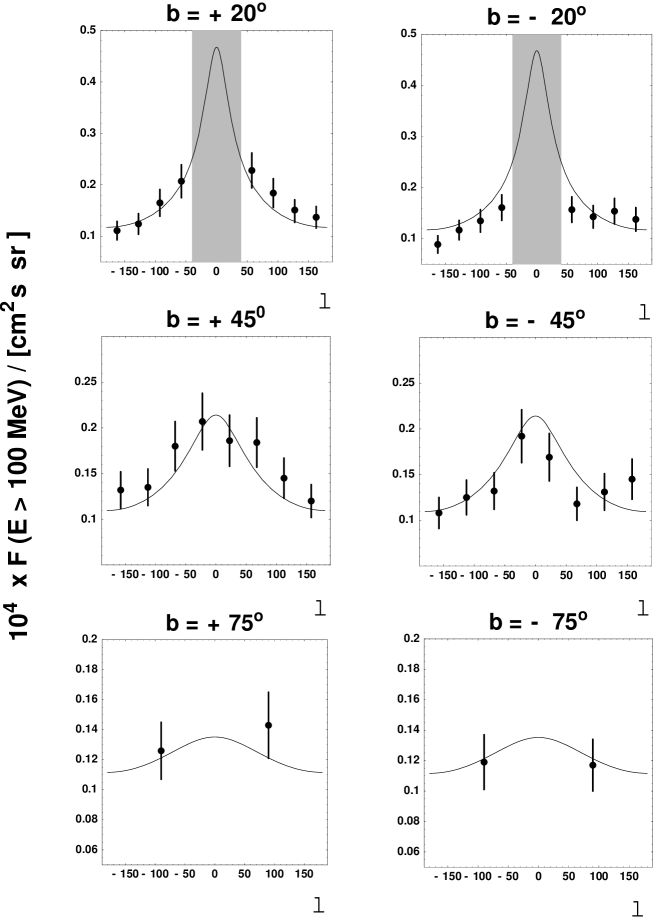
Our predictions for the magnitude of the GBR and its directional dependence on b and l are shown in Figs. 5 and 6. In Fig. 5 we display separately the contributions from ICS off CMB and SL photons in our galaxy, as well as the uniformly distributed sunlight and extragalactic components. In Fig. 7 we compare the total GBR flux:
| (19) |
obtained by summing Eqs. (7), Eq. (16) and Eq. (13), with the EGRET data. Our result is a satisfactory fit to the observed magnitude and angular trend of the GBR (), a vast improvement over the result for a constant (extragalactic) ansatz, for which . Although this agreement would be more meaningful, had we used a more realistic model of starlight, a more careful treatment may be premature, for the EGRET error bars are large enough to accommodate considerable variations in the input modelling. In a previous analysis (Dar et al. 1999), for instance, we obtained a similarly good fit with an assumed constant-density, spherical CR-electron halo of radius 25 kpc, for which the results have the advantage of being simple analytical functions.
We have neglected various putative extragalactic contributions to the GBR. Blazars, because of their beamed emission, may not be very relevant. But CR electrons injected directly into intergalactic space by active galactic nuclei, radio galaxies or gamma ray bursters, may give rise to a contribution of comparable magnitude and shape to that of the CR electrons in external galaxies. These or other potential sources of GBR photons may imply that our parameters and have been overestimated. But this effect cannot be very large, given our success at describing the non-trivial angular dependence of the EGRET data.
11 Conclusions and predictions
We have presented a simple understanding of the relation between the spectral indices of cosmic-ray protons, electrons and the GBR. Accepting the possibility that the CR-electron distribution in our galaxy may have a scale height larger than conventionally believed, we have also argued that the bulk of the GBR could originate in our own galaxy. Our modelling is extremely simplistic, but quite successful.
The predictions specific to our scenario are:
-
•
The GBR should reflect the asymmetry of our off-centre position in the Galaxy.
-
•
The halo of Andromeda should shine in gamma rays above a few MeV, with a luminosity comparable to that in Eq. (14). Likewise, very nearby star-burst Galaxies, such as M82, and radio galaxies with large CR production rates, such as Cygnus A, may be visible in gamma rays.
-
•
If the CR-proton and electron acceleration mechanisms are the same, the existence of a knee in the observed proton spectrum translates into a related result for the power index of the electron spectrum, which should steepen above TeV by .
-
•
The GBR spectrum should not have the sharp cutoff, above GeV, expected (Salamon & Stecker 1998) for cosmological sources. But it should nonetheless steepen around 10–100 GeV, because of the anticipated “knee” in the electron spectrum and of the energy-dependence of the Klein-Nishina cross section.
These features of our scenario should be testable when the next generation of cosmic-ray and -ray satellites (AMS-02 and GLAST) are operational, hopefully by 2005. In spite of their maturity, cosmic-ray physics and -ray astrophysics are still young, and thriving.
ACKNOWLEDGEMENTS
We are indebted to G. Bignami, S. Dado and G. Raffelt
for discussions and to I. Moskalenko and A. Strong
for permission to reproduce their results in
our Fig. 5.
REFERENCES
Barwick S. W. et al., 1998, ApJ, 498, 779
Bednarz J., Ostrowski M., 1998, PRL, 80, 3911
Berezinskii V. S. et al., 1990, Astrophysics of cosmic rays (North
Holland, Amsterdam, 1990)
Bhattacharjee P., Sigl G., 2000, Phys. Rep., 327, 109
Bignami G. et al., 1979, ApJ, 232, 649
Bird D. J. et al., 1995, ApJ, 441, 144.
Broadbend A., Haslam C. G. T., Osborne, J. L., 1989, MNRAS, 237, 381
Chiang J., Mukerjee R., 1998, ApJ, 496, 772
Cohen A., De Rújula A., Glashow S. L., 1998, ApJ, 495, 539
Connell J. J., 1998, ApJ, 501, L59
Dar A., 1998, astro-ph/9809163, in Proceedings of the Rencontres de la
Vallée d’Aoste, 1998 (ed. M. Greco), Frascati Physics Series, INFN
Pubs, page 23
Dar A., De Rújula A., Antoniou N., 1999, astro-ph/9901004
Dar A., Plaga R., 1999, A&A, 349, 259
Dixon D. D. et al., 1998, New Astron. 3, 539
Duric N., Irwin J., Bloemen H., 1998, A& A, 331, 428
Ellis R. S., 1997, ARA&A, 35, 389
Evenson P., Meyers P., 1984, J. Geophys. Res., 89 A5, 2647
Felten J. E., Morrison P., 1966, ApJ, 146, 686
Ferrando P. et al., 1996, A&A 316, 528
Fixsen D.J. et al., 1996, ApJ, 473, 576
Gnedin N. Y., Ostriker J. P., 1992, ApJ, 400, 1
Golden R. L. et al., 1984, ApJ, 287, 622
Golden R. L., et al., 1994, ApJ, 436, 739
Hartmann D. H., 1995, ApJ, 447, 646
Hawking S. W., 1977, Scientific American, 236, 34
Hunter S. D. et al., 1997, ApJ, 481, 205
Kazanas D., Protheroe J. P., 1983, Nature, 302, 228
Lukasiak A. et al., 1994, ApJ, 423, 426
Mather J. C. et al., 1993, ApJ, 432, L15
Moskalenko I. V., Strong A. W., Reimer O., 1998, astro-ph/9811221
Moskalenko I. V., Strong A. W., 2000, ApJ, 528, 357
Nishimura J. et al., 1980, ApJ, 238, 394
Page D. N., Hawking S. W., 1976, ApJ, 206, 1
Pohl M., Esposito J. A., 1998, ApJ, 507, 327
Prince T. A., 1979, ApJ, 227, 676
Pritchet C. J., van den Bergh S., 1999, AJ, 118, 833
Rudaz S., Stecker F. W., 1991, ApJ, 368, 40
Salamon M. H., Stecker F. W., 1998, ApJ, 493, 547
Seo E. S., Ptuskin V. S., 1994, ApJ, 431, 705
Silk J., Srednicki M., 1984, PRL, 53, 264
Sreekumar P. et al., 1998, ApJ, 494, 523
Stecker F. W., Salamon M. H., 1996, ApJ, 464, 600
Stecker F. W., Morgan D. L., Bredekamp J., 1971, PRL, 27, 1469
Steidel C.C. et al., 1999, ApJ, 519, 1
Strong A., Moskalenko I. V., 1998, ApJ, 509, 212
Strong A. W. et al., 1997, in Proceedings of the 4th Compton
Symposium, AIP, 410, 1198
Strong A. W., Moskalenko I. V., Reimer O., 1998, astro-ph/9811296
Swordy S. P. et al., 1990, ApJ, 330, 625
Takeda M. et al., 1998, PRL, 81, 1163
Tang K. K., 1984, ApJ, 278, 881
Thompson D. J., Fichtel C. E., 1982, A&A, 109, 352
Webber W. R., 1997, Sp. Sci. Rev., 81, 107
Wiebel-Sooth B., Biermann, P. L., 1998, Landolt-Börnstein,
(Springer Verlag, Heidelberg 1998, in press)
Wijers R. A. M. J. et al., 1997, MNRAS, 294, L13


 |
 |
| (a) | (b) |
 |
 |
| (c) | (d) |
 |

|
| (a) | (b) |
 |

|
| (c) | (d) |
 |
 |