Search for clusters at high redshift
Abstract
Radio, optical and X-ray observations of the powerful radio galaxy PKS 1138–262 at have suggested that this galaxy is a massive galaxy in the center of a forming cluster. We have imaged 1138–262 and the surrounding 38 square arcminute field with the Very Large TelescopeaaaBased on observations carried out at the European Southern Observatory, Paranal, Chile, programme P63.O-0477(A). in a broad band and a narrow band encompassing the redshifted Ly emission. We detect 50 objects with rest equivalent width larger than 20 Å and a luminous, highly extended Ly halo around 1138–262. If the radio galaxy is at the center of a forming cluster, as observations at other wavelengths suggest, these objects are candidate Ly emitting cluster galaxies.
Key Words.:
Galaxies: active – Galaxies: clusters: general – Galaxies: evolution – Galaxies: luminosity function – Cosmology: observations – Cosmology: early Universe1 Introduction
Observations of clusters at high redshift () can directly constrain cosmological models (e.g. Bahcall & Fan bah98 (1998)), but searches based on colours or narrow band emission have not established the presence of massive clusters (Le Fèvre et al. fev96 (1996); Pascarelle et al. pas96 (1996); Keel et al. kee99 (1999)). There are several indications (e.g. Pentericci et al. pen99 (1999)) that powerful radio galaxies at high redshift (HzRGs) tend to be in the center of forming clusters. The powerful radio galaxy PKS 1138–262 at redshift 2.156 is a prime example of a forming brightest cluster galaxy and has extensively been studied (e.g. Pentericci et al. pen97 (1997)). The arguments for 1138–262 being at the center of a cluster include (a) the very clumpy morphology as observed by the HST (Pentericci et al. pen98 (1998)), reminiscent of a massive merging system; (b) the extremely distorted radio morphology and the detection of the largest radio rotation measures (6200 rad m-2) in a sample of more than 70 HzRGs, indicating that 1138–262 is surrounded by a hot, clumpy and dense magnetized medium (Carilli et al. car97 (1997); Pentericci et al. pen00 (2000)); (c) the detection of X-ray emission around 1138–262 (Carilli et al. 1998), indicating the presence of hot cluster gas, although a contribution to the X-ray luminosity by the AGN cannot be precluded. For this reason, we chose 1138–262 to carry out a pilot study with the VLT, to search for direct evidence of clusters at high redshift. There are various techniques for detecting high redshift companion galaxies. The colour selection technique used to find Lyman Break Galaxies (LBGs) (Steidel & Hamilton ste92 (1992)) is not feasible at the redshift of 1138–262, since the Lyman limit falls at 2878 Å, which is well below the atmospheric cutoff. Therefore we have adopted the strategy of narrow band imaging at the wavelength of the redshifted Ly line. This technique is capable of detecting galaxies at redshifts similar to the radio galaxy redshift having strong Ly emission.
2 Observation, data reduction and calibration
Narrow and broad band imaging was carried out on April 12 and 13, 1999 with the 8.2m VLT Antu (UT1) using FORS in imaging mode. A narrow band filter was used which has a central wavelength of 3814 Å and a FWHM of 65 Å. For 1138–262 the emission of Ly at 1216 Å is redshifted to 3838 Å, which falls within the range of the narrow band filter. The broad band filter was a Bessel B with central wavelength of 4290 Å and a FWHM of 880 Å, which receives both continuum and redshifted Ly line emission. The detector was a Tektronix CCD with 20482 pixels and a scale of 0.2′′ per pixel. Eight separate 30 minutes exposures were taken in narrow band and six 5 minutes exposures in B, shifted by 20′′ with respect to each other to minimize flat fielding problems and to facilitate cosmic ray removal. The average seeing was 0.8′′ and the 1 limiting AB magnitude per square arcsecond was 27.8 for the narrow and 28.1 for the broad band image.
Image reduction was carried out using the IRAF reduction package. The individual images were bias subtracted and flat fielded by twilight flat fields for the narrow band and an average of the unregistered science exposures for the broad band. The images were then registered by shifting them in position by an amount determined from the location of several stars on the CCD. The registered images were co-added and cosmic rays removed. To improve the signal to noise and the sensitivity to faint extended objects, the resulting images were smoothed with a Gaussian function having a FWHM of 1′′. The spectrophotometric standard star GD108 (Oke oke90 (1990)) was used to calibrate the fluxes in broad and narrow band. Calibration in broad band is accurate to 0.1 magnitude, but absorption lines and a small break in the part of the spectrum of GD108 which falls in the narrow band inhibits equally accurate calibration for this filter. Instead, it was assumed that the spectrum is flat in this wavelength range and the narrow band is calibrated relative to the broad band with an accuracy of 0.2 magnitude, as estimated from the spectrum of GD108. We assume that the median equivalent width (EW) of a random sample of objects is equal to zero. Since the median EW of our sample calibrated by the standard star is equal to 0.5 erg s-1 cm-2 Å-1, we subtract this number from the narrow band flux densities of the extracted objects to compute the EW. In this way, we do not rely on the absolute flux calibration.

3 Photometry and selection of Ly emitters
Detection and photometry of objects in the field around 1138–262 was carried out using SExtractor (Bertin & Arnouts, 1996). We have taken advantage of all observing time by normalizing and adding the narrow and broad band images to obtain maximum signal to noise for the majority of objects, which resulted in the extraction of 1727 sources. All detections have at least 9 connected pixels with a value equal or larger than 2.5 times the rms sky noise. During this first application of SExtractor, aperture sizes and shapes were determined for each object separately. We gave the choice of aperture careful consideration by comparing the signal-to-noise for fixed circular apertures with a range of sizes and for elliptical apertures with a range of scale factors. The half lengths of the principal axes of the elliptical apertures are and , where is the ellipticity determined by the isophots of the object, the first moment of the radial (non-elliptical) light distribution and a scale factor. The highest average signal-to-noise for faint objects was obtained with elliptical apertures using . The apertures determined in this way were used to carry out photometry on the narrow and broad band images.
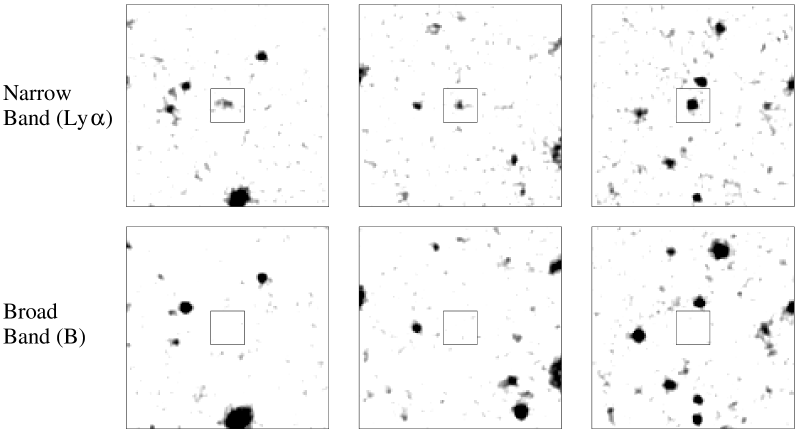
Objects displaying twice as much flux density in the narrow band as in broad band have EW 65 Å. This equals to a rest frame EW of 20.5 Å, very close to the 20 Å used as selection criterium by Steidel et al. (ste99 (1999), S99). There are 60 objects with EW larger than 65 Å and narrow band flux density of at least 2 erg s-1 cm-2 Å-1. The signal-to-noise of these objects is at least 10 in narrow band, making the EW computation meaningful. We consider these to be candidate Ly emitting galaxies. We subdivide the candidates in very promising ones with EW three times this value (13) and promising ones with EW two times this value (11), as shown in Fig. 1. Ten candidates coincide with peaks in the extended ( 160 kpcbbbThroughout this article, we adopt a Hubble constant of =50 km s-1Mpc-1 and a deceleration parameter of =0.5.) halo of ionized hydrogen around the radio galaxy. So in total, there are 50 previously unknown emitters with a range of narrow band fluxes from 0.1 to 5 ergs s-1 cm-2. The positions of the emitters are shown in Fig. 2. Images of three candidates are shown in Fig. 3.
We believe that there will be few or no low redshift interlopers, since [O ii]3727 at redshift 0.02 is the only strong line which falls in the narrow band filter, apart from Ly at redshift 2.14. Galaxies at redshift 0.02 would easily be identified by their large angular size. Since the narrow band is positioned on the blue side of the broad band, our sample will not be contaminated by objects with abnormal colors as Extremely Red Objects or red M dwarfs or by objects with a break in their spectrum around 3900 Å as LBGs at . Contamination by bright quasars will be small, since their surface density (0.04 arcmin-2; Thompson et al. tom99 (1999)) is low enough that not more than 2 quasars will appear in our field. Although there still is a possibility that we have selected some rare, very blue objects with U - B -1.3, we shall assume for the remainder of this paper that all objects with EW Å are Ly emitting galaxies.

4 Clustering analysis
Is there an enhanced density of galaxies around 1138–262? Do the candidates make up a forming cluster?
The number of 50 Ly emitters in the 35.4 arcmin2 field ( arcmin2 is rendered unusable by bright stars) is equivalent to a surface density of 1.4 per arcmin2. The comoving volume for this field size (8.3 Mpc2) and redshift range () is 4758 Mpc3, resulting in a volume density of emitters per Mpc3. A contour plot of surface density does not show a strong concentration of emitters centered on the radio galaxy or anywhere else in the field.
The angular two point correlation function was determined by the Landy-Szalay estimator (Landy & Szalay lan93 (1993)). Due to the occurence of close pairs in our sample, the correlation function shows a signal at short distances, but there is no evidence that the distribution of emitters is significantly different from a random distribution on scales larger than 20″.
S99 present an overview of luminosity functions of three Ly emission searches in their Fig. 5. We have converted our Ly luminosities to star formation rate (SFR) using the relation Lν(1500Å) = 8.0 (SFR / M⊙ yr-1) ergs s-1 Hz-1 (Madau et al. mad98 (1998)) and computed the number of emitters (omitting the radio galaxy halo objects) per SFR bin per Mpc3 assuming for all emitters. The central wavelength of the B filter is 1366 Å in the restframe, which is close enough to 1500 Å to omit a K-correction carried out with an uncertain spectral index. Fig. 4 shows that the density of the cluster companions of 1138–262 (plus signs with vertical error bars) is comparable to the near-QSO search of Campos et al. (cam99 (1999)) at , which represents a small overdensity relative to the blank field search of Cowie & Hu (cow98 (1998)) at . The density is, however, lower than the Lyman break galaxy spike of S99 at . We have assumed that properties of forming clusters and galaxies do not change too fast to allow meaningful comparison between clusters at different epochs. The figure also shows that we detect SFR as low as 1 h-2 M⊙ yr-1, while Cowie & Hu (cow98 (1998)) and S99 reach their sensitivity limit at about 8 h-2 M⊙ yr-1. This is due, in part, to our sampling of a lower redshift range.

5 Discussion
Although we have detected a number of Ly emitters in the field of 1138–262, from the present data it is impossible to unambiguously determine whether a significant fraction of these objects form part of the presumed cluster around 1138–262. Note that the observations described here can only detect galaxies with bright Ly emission lines not attenuated by dust and these might comprise merely a small fraction of the galaxy content of the presumed cluster. First, of the whole population of LBGs as studied by S99 only 20% have a Lya rest EW 20 Å. About 50% of the LBGs have the Lya region even in absorption. Second, only a fraction of the cluster galaxies are likely to be actively forming stars. We assume that the ratio of early to late type galaxies in the cluster around 1138–262 is the same as the 1.1:1 ratio in intermediate redshift () clusters as found by Andreon (and98 (1998)). Taking these two factors into account, the detected Ly galaxies might comprise only 10% of the cluster galaxies present around 1138–262. In addition to this, we miss galaxies emitting Ly outside the limited range of wavelength covered by our narrow band filter. Assuming that the radio galaxy is at rest with respect to the cluster, the wavelength of Ly from galaxies with a positive velocity greater than 860 km s-1 falls outside the FWHM of the filter. Since present day clusters have velocity dispersions as large as km s-1 (Mazure et al. maz96 (1996)), we miss 15% of the velocity range of the presumed cluster around 1138–262 if we assume the same velocity dispersion for clusters at high redshift.
6 Conclusions
We have detected 50 candidate Ly emitters close to radio galaxy 1138–262 at redshift 2.2. These Ly emitters are candidate starburst galaxies in the cluster, which is presumed to exist or to be forming around 1138–262. We do not find a significant overdensity of candidates compared to luminosity functions of blank fields nor do we detect a strong concentration gradient in our 8 Mpc2 field. The next step in our search for clusters at high redshift is to confirm the existence of the Ly emitters by multi object spectroscopy at the VLT and determine the spatial correlation function and velocity dispersion, which together with the size of the cluster will give a direct estimate of the total mass. Additionally, we will carry out X-ray observations of 1138–262 with the Chandra telescope.
Acknowledgements.
JK acknowledges productive discussions with Philip Best and Tom Thomas. The work by WvB at IGPP/LLNL was performed under the auspices of the US Department of Energy under contract W-7405-ENG-48. IRAF is distributed by the National Optical Astronomy Observatories, which are operated by the Association of Universities for Research in Astronomy, Inc., under cooperative agreement with the National Science Foundation.References
- (1) Andreon S., 1998, ApJ 501, 533
- (2) Bahcall N.A., Fan X., 1998, ApJ 504, 1
- (3) Bertin E., Arnouts S., 1996, A&AS 117, 393
- (4) Campos A., Yahil A, Windhorst R.A. et al., 1999, ApJ 511, L1
- (5) Carilli C.L., Röttgering H.J.A., van Ojik R., Miley G.K., van Breugel W.J.M., 1997, ApJS 109, 1
- (6) Carilli C.L., Harris D.E., Pentericci L. et al., 1998, ApJ 496, L57
- (7) Cowie L.L., Hu E.M., 1998, AJ 115, 1319
- (8) Le Fèvre O., Deltorn J.M., Crampton D., Dickinson M., 1996, ApJ 471, L11
- (9) Keel W.C., Cohen S.H., Windhorst R.A., Waddington I., 1999, AJ 118, 2547
- (10) Landy S.D., Szalay A.S., 1993, ApJ 412, 64
- (11) Madau P., Pozzetti L., Dickinson M., 1998, ApJ 498, 106
- (12) Mazure A., Katgert P., den Hartog R. et al., 1996, A&A 310, 31
- (13) Oke J.B., 1990, AJ 99, 1621
- (14) Pascarelle S.M., Windhorst R.A., Keel W.C., Odewahn S.C., 1996, Nature 383, 45
- (15) Pentericci L., Röttgering H.J.A., Miley G.K., Carilli C.L., McCarthy P., 1997, A&A 326, 580
- (16) Pentericci L., Röttgering H.J.A., Miley G.K. et al., 1998, ApJ 504, 139
- (17) Pentericci L., Röttgering H.J.A., Miley G.K. et al., 1999, A&A 341, 329
- (18) Pentericci L., van Reeven W., Carilli C.L., Röttgering H.J.A., 2000, A&A in preparation
- (19) Steidel C.C., Hamilton D., 1992, AJ 104, 941
- (20) Steidel C.C., Adelberger K.L., Shapley A.E. et al., 1999, ApJ submitted, astro-ph/9910144 (S99)
- (21) Thompson D., Beckwith S.V.W., Fockenbrock R. et al., 1999, ApJ 523, 100