VLA Imaging of the Disk Surrounding the Nearby Young Star TW Hya
Abstract
The TW Hya system is perhaps the closest analog to the early solar nebula. We have used the Very Large Array to image TW Hya at wavelengths of 7 mm and 3.6 cm with resolutions ( AU) and ( AU), respectively. The 7 mm emission is extended and appears dominated by a dusty disk of radius AU surrounding the star. The 3.6 cm emission is unresolved and likely arises from an ionized wind or gyrosynchrotron activity. The dust spectrum and spatially resolved 7 mm images of the TW Hya disk are fitted by a simple model with temperature and surface density described by radial power laws, and . These properties are consistent with an irradiated gaseous accretion disk of mass with an accretion rate and viscosity parameter . The estimates of mass and mass accretion rates are uncertain as the gas-to-dust ratio in the TW Hya disk may have evolved from the standard interstellar value.
1 Introduction
The TW Hya association, which consists of at least 13 pre-main-sequence systems at a distance of about 50 pc, is thought to be the nearest region of recent star formation (Kastner et al. 1997, Webb et al. 1999a,b). The age of the association members has been estimated by various techniques at 5 to 20 million years, an important time period for the formation of planetary systems (Kastner et al. 1997, Jura et al. 1998, Soderblom et al. 1998, Webb et al. 1999b, Weintraub et al. 2000). Because of its close proximity and interesting age, the association has proved to be fertile ground for observations of phenomena related to the structure and evolution of circumstellar disks. Four of the association members were detected by IRAS indicating the presence of circumstellar dust, either precursors to the assemblage of larger bodies or perhaps the resulting debris. Recent observations with better angular resolution toward members of this association have revealed a disk around TW Hya visible in scattered near-infrared light (Weinberger et al. 1999) and detectable in various molecular tracers (Zuckerman et al. 1995, Kastner et al. 1997), a dust disk around HR 4796A with a cleared interior gap (Koerner et al. 1998, Jayawardhana et al. 1998, Schneider et al. 1999), a dust disk within the hierarchical quadruple system HD 98800 (Low et al. 1999), and direct images of a substellar companion to CoD -33∘ 7795 (Lowrance et al. 1999, Webb et al. 1999b).
Among the TW Hya association members, TW Hya, a K7 star of , has the strongest circumstellar dust emission and a disk mass perhaps comparable to the solar nebula prior to the formation of the planets. The TW Hya system is almost three times closer than the young stars in nearby dark clouds like Taurus, Ophiucus and Chameleon, with a distance of pc determined by Hipparcos. The technique of millimeter interferometry can now probe emission from the dusty disk material at subarcsecond scales, comparable to the best resolution achieved at optical and infrared wavelengths (Mundy et al. 1996, Wilner et al. 1996, Dutrey et al. 1996, Wilner & Lay 2000). Dust emission at long millimeter wavelengths is nearly entirely optically thin and arises from the full disk column, including the innermost regions of planet formation. In this Letter, we describe observations of thermal emission from TW Hya obtained with the Very Large Array (VLA) of the National Radio Astronomy Observatory 111The National Radio Astronomy Observatory is a facility of the National Science Foundation operated under cooperative agreement by Associated Universities, Inc.. These observations directly resolve the dusty disk surrounding the star and provide constraints on its structure.
2 Observations
We observed TW Hya with the VLA on two occasions in excellent weather conditions, first in a short observation in February 1998 in the D configuration as part of larger survey of dust in T Tauri systems, and then for a full track in October 1999 in the BnA configuration to obtain higher angular resolution. The VLA was divided into two subarrays in each observing session, one consisting of those antennas equipped with 7 mm receivers, and the other consisting of the remaining antennas, which were set to observe at 3.6 cm. Table 1 summarizes the observational parameters. All observations were made with the maximum bandwidth, two 50 MHz channels in each of two circular polarizations, for the best continuum sensitivity. For the observations in the BnA configuration, phase calibration at 7 mm was accomplished by rapid phase referencing within a 120 second cycle to the nearby calibrator 1037-295. The absolute flux scale was determined through observations of the standard source 3C286 and should be accurate to 10%. All data calibration and imaging were performed using the standard routines in the AIPS software package.
3 Results
3.1 7 mm
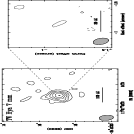
Figure 1 shows images made from the 7 mm data at two different resolutions obtained with different visibility weighting schemes. The lower resolution image in the left panel of Figure 1 was made with natural weighting and a 300 k Gaussian taper to produce a beam that emphasizes the spatially extended low brightness emission. The region of detectable 7 mm emission at this resolution is AU in diameter. The total flux integrated within a box of size is mJy. It is possible that a fainter halo extends to even larger distances from the peak. The emission presents a roughly circular boundary, consistent with other suggestions that the emission arises in a disk oriented close to pole-on (Kastner et al. 1997), though the ellipticity is uncertain and does not provide a strong constraint on the inclination. The image in the right panel of Figure 1 was made with robust weighting to obtain a beam (5.6 AU), close to the highest resolution available from the longest baselines in these data. Little detectable emission is visible from TW Hya at this scale, though a weak signal remains at the center of the larger structure, with perhaps a comparable peak offset to the northwest. Note that while the flux sensitivity of the higher resolution image is a little better than that of the lower resolution image, the brightness temperature sensitivity is considerably worse because of the smaller synthesized beam.
3.2 3.6 cm
TW Hya was detected at 3.6 cm as an unresolved source with flux density mJy. (The results from the two epochs are consistent within the noise.) The emission peak is located at , (J2000) with an estimated uncertainty of . Rucinski (1992) previously used the VLA to search for radio emission from TW Hya at 3.6, 6 and 20 cm, without success. He reports an rms noise level of 0.028 mJy at 3.6 cm, very similar to the value obtained here with fewer antennas and more integration time, and so TW Hya should have been detectable in the earlier observation (with a synthesized beam 15 times larger in area). If the observation of Rucinski (1992) is correct, then the radio emission from TW Hya must be time variable.
4 Discussion
4.1 Disk Spectrum
Figure 2 shows the broadband spectrum of TW Hya from mid-infrared to radio wavelengths. Like many T Tauri stars, the long wavelength emission, far in excess of the stellar photosphere, is well fitted by a family of thin disk models parameterized by radial power laws in temperature and surface density (Adams, Lada & Shu 1988, Beckwith et al. 1990). In these models, the slope of the spectrum in the infrared, where the disk is optically thick, constrains the temperature distribution. At millimeter wavelengths, where the disk is largely optically thin, the emission is proportional to the disk mass weighted by the temperature distribution. Irradiation from the star and low optical depths for the outer disk, together with flaring, tend to drive (Kenyon & Hartmann 1987, D’Alessio et al. 1998). For illustration, Figure 2 shows spectra from a series of face-on disk models with outer radius 100 AU and the usual (constant) dust opacity law cm2 g-1, , and g cm-2, , and (with the mass of gas+dust adjusted from 0.044 to 0.034 to provide the best least squares fit) for K, . Note that the spectrum is not very sensitive to , the power law index of the surface density distribution.
Uncertainties in mass opacity coefficient dominate the uncertainties in the estimate of disk mass as the standard value derived from interstellar clouds may not apply (see the review by Beckwith et al. 2000). In addition to issues of grain composition, size and shape, the standard coefficient assumes a gas-to-dust ratio of 100 by mass. For TW Hya, Kastner et al. (1997) observe 13CO emission and calculate a gas mass of , three orders of magnitude lower than implied by the millimeter continuum emission. One explanation for this commonly found discrepancy between tracers of total (gas+dust) disk mass is the spectre of severe molecular depletion (Dutrey et al. 1996). Another possibility is a dramatic decrease in the gas-to-dust ratio, which Zuckerman et al. (1995) argue may be especially appropriate for older systems like TW Hya where substantial processing of disk material may have occurred. The disk gas is lost on a timescale of yr, perhaps incorporated into giant planets, while dust apparently persists for yr or more. For TW Hya, the strong accretion signatures at ultraviolet and optical wavelengths indicate the presence of some gas close to the star. But all estimates of the total disk mass, which is likely dominated by molecular hydrogen, remain somewhat problematic.
At 3.6 cm, emission from the disk models falls far short of the observed flux. By analogy with other young stellar objects, the 3.6 cm emission may arise from hot plasma that originates in a stellar wind. The spectrum of this ionized component may be flat (if optically thin) or rising (if partially optically thick) with a spectral index perhaps as large as unity (Anglada et al. 1998). Alternatively, the 3.6 cm emission may be attributed to pre-main-sequence magnetic activity, an especially attractive source if the emission is time variable (Feigelson & Montmerle 1999). The same activity could also account for the variable X-ray emission from the star (Kastner et al. 1999). A dotted line in Fig 2 shows an extrapolation of the spectrum for a wind with spectral index unity, which maximally contributes to the emission at shorter wavelengths; even in this case, the hot plasma contribution at 7 mm is 1 mJy, less than 15% of the dust emission from the disk models.
4.2 Disk Structure
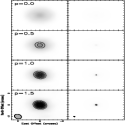
The resolved 7 mm images are sensitive to the degree of central concentration of the disk emission. The brightness in each beam is given by the product of temperature and opacity, where the latter quantity is proportional to the surface density when the optical depth is low. With the available sensitivity, the disk emission can be detected only where temperatures and optical depths are sufficiently high. The images offer hints of inhomogeneities in the disk emission, in particular along a southeast-northwest axis, but these features have marginal significance (less than twice the rms noise). We consider only axisymmetric models for the disk in deriving structural parameters. Figure 3 shows images of a series of four disk models that follow the standard power law description and match the TW Hya spectrum but have different surface density distributions. To mimic observations, the models have been imaged from the tracks obtained for TW Hya for two resolutions and deconvolved with the standard algorithms. The models in Figure 3 show that disks with steep surface density distributions produce detectable emission at small radii at high resolution while flatter distributions do not. The disks in these models are oriented face on and have outer radii of 100 AU, but disks with modest inclinations and outer radii from a few 10’s to a few 100’s of AU exhibit qualitatively similar behavior.
Comparison of the model images in Figure 3 with the images in Figure 1 suggest that values of as large as or as low as are not compatible with the 7 mm data. A model with as low as can more closely match the observations if the disk is made sufficiently small, with outer radius AU, which raises the surface density and the resulting brightness. But the radial extent of scattered light in the Hubble Space Telescope NICMOS and WFPC2 images of TW Hya show that disk material extends well beyond this radius (Weinberger et al. 1999, Krist et al. 2000). The steeper power laws are especially in conflict with the observations if any of the emission visible at the highest resolution can be attributed to an ionized component. The preferred value of is near unity, where the power law model matches the 7 mm observations imaged at low and high resolution. This result requires that the dust properties within the disk are not a strong function of radial distance from the star.
The TW Hya spectrum and resolved 7 mm images are generally consistent with an irradiated gaseous accretion disk (D’Alessio et al. 1997, 1998, Chiang & Goldreich 1997) that follows the Shakura–Sunyaev prescription. For steady accretion, the surface density is given by away from the boundaries, where is the kinematic viscosity parameterized by a local velocity (the sound speed, ) and scale length (the scale height, ) and a dimensionless parameter (). At radii where the disk is optically thin to its own radiation, a condition that likely holds beyond a few AU for the TW Hya system, the disk becomes nearly vertically isothermal. For a midplane temperature distribution characterized by due to irradiation, the surface density distribution can be approximated by , in good agreement with the data. While inhomogeneities are likely present in the disk, and changes in disk composition and optical depth will modify the energy balance and structure close to the star, the overall structure of the TW Hya disk appears amenable to this simple power law description. Substituting the numerical factors in the expression for surface density gives g cm-2, where the scalings for and are typical values for pre-main-sequence accretion disks (Hartmann et al. 1998). For the TW Hya disk, the surface density at 1 AU radius in the model shown in Figure 3 is 450 g cm-2, about a factor of two larger than the canonical value. If the accretion model is valid, then the agreement between the determinations of the surface density– within a factor of a few– provides support for the accuracy of the adopted mass opacity law at millimeter wavelengths. More stringent tests will be provided by independent measures of the accretion rate and resolved observations of the dust emission at additional wavelengths.
One consequence of the modest brightness observed within 5 AU of TW Hya is that the surface density is unlikely be very much higher in this region of the disk than expected from an extrapolation inward. A region of low viscosity and concomitant high surface density in the inner disk may be required by some mechanisms for accretion, planet formation, and also planet migration. For example, the layered accretion of Gammie (1996) piles up accreting mass in a “dead zone” where the magnetohydrodynamic instability does not operate very effectively. For TW Hya, there is no evidence for any such substantial mass reservoir at small radii, at least not at the present epoch.
5 Conclusions
The TW Hya system provides perhaps the closest analog to the early solar nebula, and VLA observations with subarcsecond resolution characterize conditions in the circumstellar environment at the size scales of giant planet formation. The images of TW Hya at mm show extended emission that we attribute to dust in a disk viewed close to pole-on. The dust emission is best fit with a power law disk model having surface density falling off as , as shallower or steeper power laws produce too little or too much signal at high resolution, especially at radii AU. The observed structure conforms to that derived in self-consistent calculations of gaseous accretion disks with heating dominated by irradiation from the central star. The observations provide hints of substructure within the disk, but data with much better sensitivity will be required to confirm the reality of these features. This nearby disk system will be a prime target for the next generation of millimeter and submillimeter arrays.
References
- (1)
- (2) Adams, F.C., Lada, C.J. & Shu, F.H. 1987, ApJ, 312, 788
- (3)
- (4) Anglada, G., Villuendas, E., Estalella, R., Beltran, M.T., Rodriguez, L.F., Torrelles, J.M. & Curiel, S. 1998, AJ, 116, 2953
- (5)
- (6) Beckwith, S.V.W., Sargent, A.I., Chini, R. & Gusten, R. 1990, AJ, 99, 924
- (7)
- (8) Beckwith, S.V.W., Henning, T. & Nakagawa, Y. 2000, in Protostars and Planets IV, eds. V. Mannings, A. Boss and S. Russell, in press
- (9)
- (10) Chiang, E.I. & Goldreich, P. 1997, ApJ, 490, 368
- (11)
- (12) D’Alessio, P., Calvet, N. & Hartmann, L. 1997, ApJ, 474, 397
- (13)
- (14) D’Alessio, P., Canto, J., Calvet, N. & Lizano, S. 1998, ApJ, 500, 411
- (15)
- (16) Dutrey, A., Guilloteau, S., Duvert, G. Prato, L., Simon, M., Schuster, K. & Menard, F. 1996, A&A, 309, 493
- (17)
- (18) Feigelson, E. D. & Montmerle, T. 1999, ARA&A, 37, 363
- (19)
- (20) Gammie, C. 1996, ApJ, 457, 355
- (21)
- (22) Hartmann, L., Calvet, N., Gullbring, E. & D’Alessio, P. 1998, ApJ, 495, 385
- (23)
- (24) Jayawardhana, R., Fisher, S., Hartmann, L., Telesco, C., Pina, R. & Fazio, G. 1998, ApJ, 503, L79
- (25)
- (26) Jura, M., Malkan, M., White, R., Telesco, C., Pina, R. & Fisher, R. S. 1998, ApJ, 505, 897
- (27)
- (28) Kastner, J.H., Zuckerman, B., Weintraub, D.A. & Forveille, T. 1997, Science, 277, 67
- (29)
- (30) Kastner, J.H., Huenemoerder, D.P., Schulz, N.S. & Weintraub, D.A. 1999, ApJ, 525, 837
- (31)
- (32) Kenyon, S. & Hartmann, L., 1987, ApJ, 323, 714
- (33)
- (34) Koerner, D.W., Ressler, M.E., Werner, M.W., Backman, D.E. 1998, ApJ, 503, L83
- (35)
- (36) Krist, J.E., Stapelfeldt, K.R., Menard, F., Padget, D.L. & Burrows, C.J., 2000, ApJ, in press
- (37)
- (38) Lowrance, P.J., McCarthy, C., Becklin, E.E., Zuckerman, B., Schneider, G., Webb, R.A., Hines, D.C., Kirkpatrick, J.D., Koerner, D.W., Low, F., Meier, R., Rieke, M., Smith, B.A., Terrile, R.J., Thompson, R.I. 1999, ApJ, 512, L69
- (39)
- (40) Low, F.J., Hines, D.C. & Schneider, G. 1999, ApJ, 520, L45
- (41)
- (42) Mundy, L.G., Looney, L.W., Erickson, W. Grossman, A., Welch, W.J., Forster, J.R., Wright, M.C.H., Plambeck, R.L., Lugten, J. & Thornton, D.D. 1996, ApJ, 464, L169
- (43)
- (44) Rucinski, S.M. 1992, PASP, 104, 311
- (45)
- (46) Schneider, G., Smith, B.A., Becklin, E.E., Koerner, D.W., Meier, R., Hines, D.C., Lowrance, P.J., Terrile, R.J., Thompson, R.I., Rieke, M. 1999, ApJ, 513, L127
- (47)
- (48) Soderblom et al. 1998, ApJ, 498, 385
- (49)
- (50) Webb, R.A., Zuckerman, B., Platais, I., Patience, J., White, R.J., Schwartz, M. J. & McCarthy, C. 1999b, ApJ, 512, L63
- (51)
- (52) Webb, R.A. & Zuckerman, B. 1999a, AAS Meeting #195, 32.02
- (53)
- (54) Weinberger, A.J., Schneider, G., Becklin, E.E., Smith, B.A., & Hines, D.C., 1999, AAS Meeting #194, 69.04
- (55)
- (56) Weintraub, D.A., Sandell, G. & Duncan, W. 1989, ApJ, 340, L69
- (57)
- (58) Weintraub, D.A., Saumon, D., Kastner, J.H. & Forveille, T., 2000, ApJ, in press
- (59)
- (60) Wilner, D.J., Ho, P.T.P & Rodriguez, L.F. 1996, ApJ, 470, L117
- (61)
- (62) Wilner, D.J. & Lay, O.P. 2000, in Protostars and Planets IV, eds. V. Mannings, A. Boss and S. Russell, in press
- (63)
- (64) Zuckerman, B., Forveille, T. & Kastner, J.H. 1995, Nature, 373, 494
- (65)
| 7 mm | 3.6 cm | |
|---|---|---|
| Pointing center (J2000): | , | |
| Date (configuration): | 1999 Oct 24 (BnA) | |
| No. antennas: | 16 | 11 |
| 1998 Feb 03 (D) | ||
| No. antennas: | 12 | 15 |
| Primary flux calibrator: | 3C286 | 3C286 |
| Adopted flux: | 1.5 Jy | 5.2 Jy |
| Phase calibrator: | 1037-295 | 1037-295 |
| Derived fluxaaThe derived fluxes for 1037-295 were indistinguishable for the two epochs (within an estimated uncertainty of 10%).: | 1.3 Jy | 1.4 Jy |
| Synthesized beam: | , p.a. 39 | , p.a. 37 |
| Map rms noise: | 0.4 mJy | 0.028 mJy |