Globular Clusters in the dE,N galaxy NGC 3115 DW1: New Insights from Spectroscopy and HST Photometry
Abstract
The properties of globular clusters in dwarf galaxies are key to understanding the formation of globular cluster systems, and in particular in verifying scenarios in which globular cluster systems of larger galaxies formed (at least partly) from the accretion of dwarf galaxies. Here, we revisit the globular cluster system of the dE,N galaxy NGC 3115 DW1 – a companion of the nearby S0 galaxy NGC 3115 – adding Keck/LRIS spectroscopy and HST/WFPC2 imaging to previous ground-based photometry. Spectra for seven globular clusters reveal normal abundance ratios with respect to the Milky Way and M31 clusters, as well as a relatively high mean metallicity ([Fe/H] dex). Crude kinematics indicate a high velocity dispersion within 10 kpc which could either be caused by dark matter dominated outer regions, or by the stripping of outer globular clusters by the nearby giant galaxy NGC 3115. The total galaxy mass out to 3 and 10 kpc lies between and M⊙ and and M⊙, respectively, depending on the mass estimator used and the assumptions on cluster orbits and systemic velocity. The HST imaging allows measurement of sizes for two clusters, returning core radii around 2.0 pc, similar to the sizes observed in other galaxies. Spectroscopy allows an estimate of the degree of contamination by foreground stars or background galaxies for the previous ground-based photometry, but does not require a revision of previous results: NGC 3115 DW1 hosts around clusters which corresponds to a specific frequency of , on the high end for massive dEs. Given its absolute magnitude ( mag) and the properties of its cluster system, NGC 3115 DW1 appears to be a transition between a luminous dE and low-luminosity E galaxy.
1 Introduction
The study of globular cluster systems of dwarf galaxies complements the numerous studies of such systems in larger elliptical and spiral galaxies. Few globular cluster systems (GCSs) around dwarf galaxies beyond the Local group have been studied to date with respect to their cluster system (see Ashman & Zepf 1998). This is mostly due to the low numbers of globular clusters present in such galaxies. However, their properties are relevant for a number of globular cluster system formation scenarios. Dwarf galaxies are expected to provide insight into how the smallest galaxies build up a system of globular clusters. Further, their properties must be known in order to verify scenarios in which larger globular cluster systems are predicted to build up by the accretion of proto-galactic fragments or dwarf galaxies (Kissler-Patig et al. 1998a, Côté et al. 1998, Hilker et al. 1999). These scenarios relate to the older idea that galaxy halos might have formed through the assembly of such small stellar systems (e.g. Searle & Zinn, 1978).
Photometric studies of several globular cluster systems in dwarf galaxies were carried out by Durrell et al. (1996a) and Miller et al. (1998). Durrell et al. (1996a) studied the systems of 11 dwarf galaxies in the Virgo cluster. All were found to host globular cluster candidates and have specific frequencies ranging from 3 to 8, similar to Local Group dwarfs and giant elliptical galaxies. Miller et al. (1998) studied 24 dwarf ellipticals in the Virgo and Fornax clusters as well as in the Leo group. They found that dE,N galaxies had higher specific frequencies than dE galaxies, with values around , increasing with increasing (decreasing luminosity). Not much is known yet about the metallicities of globular clusters in dwarf galaxies. Minniti et al. (1996) constructed a metallicity distribution for all Local Group dwarf galaxies and noticed that the distribution was peaked around [Fe/H] dex with no clusters more metal-rich than [Fe/H] dex. Durrell et al. (1996a) derived metallicities from Washington colors for two of their Virgo dwarf ellipticals and obtained a mean metallicity of [Fe/H] dex.
Durrell et al. (1996b) studied the GCS of the dE NGC 3115 DW1 in more detail and found it to be relatively rich (see below for a more detailed description of their results). This motivated us to carry out spectroscopy for some of the globular cluster candidates in this galaxy to get a more detailed picture of their chemical and kinematical properties. Further, HST/WFPC2 data were available from the archive, allowing us to study the sizes of some of the clusters.
NGC 3115 DW1 is a dE1,N galaxy in the vicinity of the giant S0 galaxy NGC 3115. It is located RA: 10h 05m 41.6s; Dec: 58′ 53.5″ (; ). We will assume a distance of Mpc throughout this paper following Durrell et al. (1996b). Additional properties will be given in the text where they are relevant. In Section 2 we describe the new data. In Section 3 we analyze the spectroscopic data giving first a brief kinematical study of the globular cluster system before discussing the abundances and the overall metallicity of the system. In Section 4 we revisit the previous photometry (number of clusters, colors, specific frequency), compare the photometric metallicities with the spectroscopic ones and add the HST/WFPC2 imaging to derive sizes for two clusters. In Section 5 we discuss whether NGC 3115 DW1 could have suffered stripping by its giant companion. We summarize our results in Section 6.
2 Data
2.1 Spectroscopic Observation
46 spectra of candidate globular clusters in NGC 3115 DW1 were obtained with the LRIS-A spectrograph (Oke et al., 1995) on the Keck-II telescope during the nights of 1996 December 18th and 19th. The observations were performed in multi-slit mode using two slit masks containing 24 (mask A) and 22 slits (mask B), respectively. Mask A was exposed for 4800 seconds while mask B was exposed 6600 seconds. The multi-object-spectra images were taken with a Tektronix 20482048 pix2 chip. The seeing was around 0.8″ during both nights. For all observations the first order of the 600/5000 grism (i.e. 600 lines mm-1) was used with slitlets of 1″ which provided a dispersion of 1.3 Å pix-1 (at 5000 Å) and a spectral resolution of 4.1 Å FWHM-1.
All frames were binned (1) perpendicular to the dispersion axis during the read-out. For each night the images were reduced individually and eventually combined. A master bias was created from 5 zero-second images, taken at the end of each night. A master flat was obtained from 5 twilight-flat images obtained each night. Each object image was bias subtracted and flat-fielded in a standard way. With the IRAF111IRAF is distributed by the National Optical Astronomy Observatories, which are operated by the Association of Universities for Research in Astronomy, Inc., under cooperative agreement with the National Science Foundation. package apall we traced, extracted and sky subtracted all object spectra. The sky was “optimally” subtracted, i.e. modeled with variance weighting perpendicular to the object spectra before being subtracted (Horne, 1986). HgKrNe-calibration-lamp spectra were obtained for wavelength calibration. The calibration spectra were traced, extracted, and sky subtracted exactly in the same way as the object spectra. The wavelength calibration was verified on sky spectra included in each slit spectrum. The overall standard deviation of the wavelength calibration was determined to be Å for both nights.
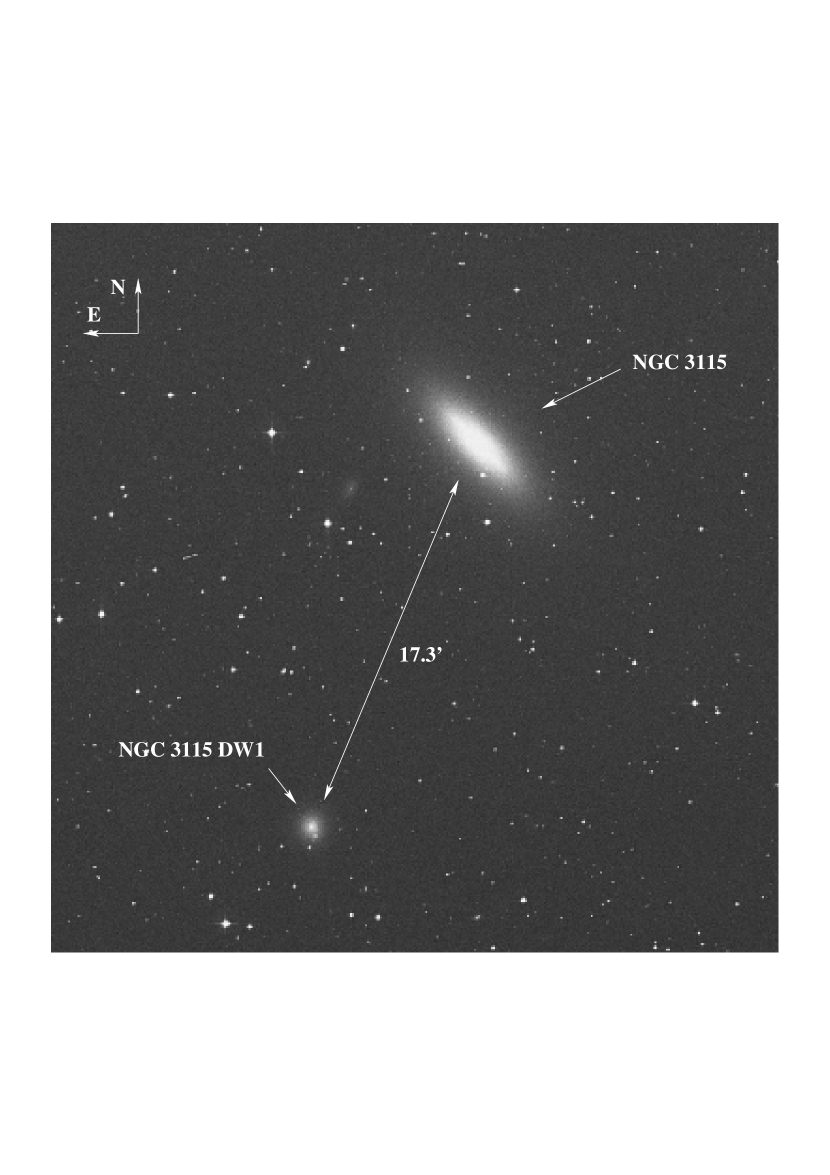
The field-of-view of LRIS-A is 6′ 8′. We placed the multi-slit masks on the central/north and south-eastern part of NGC 3115 DW1 as can be seen in Fig. 1. The slit masks were aligned such that the slits were pointing towards the center of the giant S0 galaxy NGC 3115. Due to the restrictions in making the masks (long enough slits, wavelength coverage, etc.) about 50% of the targets could be selected from the previous photometry of Durrell et al. (1996b) (see Fig. 1). The other 50% was ‘blindly’ selected from an LRIS acquisition image. Only 6 of the former group lay within 48″ of the galaxy center, i.e. within the region where Durrell et al. (1996b) detected a clear overabundance of objects. We therefore expected 6+ objects in our total sample to be true globular clusters.
2.2 Additional Photometry
In order to measure sizes of globular cluster candidates that were confirmed by our spectroscopy, additional data for the globular cluster system were obtained from the HST archive222 Based on observations made with the NASA/ESA Hubble Space Telescope, obtained from the data archive at the Space Telescope Science Institute. STScI is operated by the Association of Universities for Research in Astronomy, Inc. under NASA contract NAS 5-26555.. Short exposures of 160 seconds in F555W and 320 seconds in F814W filter were taken from program GO:5999 (PI: A.Phillips). A simple reduction procedure was applied to all HST images: The images were biased, flat-fielded and calibrated as described in Holtzman et al. (1995), including corrections accounting for CTE and field distortions. The brightest clusters were matched on both the F555W and F814W images and their sizes were studied. In addition, we re-analyzed the ground-based B,V data333The data were kindly provided in electronic form by Patrick Durrell. from Durrell et al. (1996b). The field-of-views of both photometric datasets are over-plotted in Fig. 1.
3 Analysis of Spectroscopic Data
In this section we extract heliocentric radial velocities of globular clusters and perform a mass estimate of the host galaxy, NGC 3115 DW1. Subsequently, we measure abundances using the Lick/IDS passband definitions and infer a mean metallicity of the GCS.
3.1 Kinematics
We derived radial velocities by two different methods. Velocities were derived by cross-correlation with high S/N template spectra of two bright GCs in M31: 225-280 and 158-213 (for nomenclature see Huchra et al., 1982). The cross-correlation was carried out with the IRAF task fxcor. All measurements are summarized in Table 1. The “internal” errors which are given by the cross-correlation code lie about km s-1 for well defined high-S/N spectra and increase rapidly as the object spectrum becomes less defined.
For 7 high-S/N spectra we also estimated the radial velocity by measuring redshifts of individual absorption lines (see footnote in Table 1). The mean radial velocity from cross-correlation served as a first guess to the mean wavelength-shift determination. We used the IRAF package rvidlines which employs a center1d code to match the center of each individual absorption feature (see manual of rvidlines). We obtained an “internal” mean error from the averaging process which is 100 km s-1. The results and their errors are included in Table 1.
3.1.1 Selection of Globular Clusters
After obtaining the radial velocities from cross-correlation and in some cases from wavelength shifts of individual absorption lines, we combined all available measurements for further selection of globular clusters by radial velocity. Velocities derived from cross-correlation were given twice the weight of velocities from absorption lines. The average radial velocity for each object can be found in the last but one column of Table 1.
Figure 2 shows a radial-velocity histogram of objects with km s-1. The figure shows a hint of bimodality due to the extended tail of velocities 500 km s-1. Based on the measured radial velocity of NGC 3115 DW1 of km s-1 ( km s-1 de Vaucouleurs et al. 1991, km s-1 Peterson & Caldwell 1993, and km s-1 Capaccioli et al. 1993) and an adopted velocity dispersion of the GCS in NGC 3115 DW1 of km s-1 (see below), globular clusters should have radial velocities in the range km s-1. Seven candidates lie within this range. This cut enables a reliable differentiation between foreground objects of low radial velocity and globular clusters in NGC 3115 DW1.
We used the KMM code (Ashman et al., 1994) to obtain the statistical significance of bimodality. The KMM code fits two Gaussians to the data using Maximum-Likelihood techniques. The data can be fit with two Gaussians of identical dispersion or two Gaussians of independent dispersion. We applied both techniques. The mean radial velocities of the two Gaussians are km s-1 and km s-1 for identical-dispersion and km s-1 and km s-1 for independent-dispersion fitting. The error is the error of the mean calculated from the variance of each distribution. KMM estimates also the fraction of data points which are part of each sub-distribution. Of 28 objects in the histogram (one additional object, D26, is not included due to km s-1) in Figure 2, KMM assigns 21 objects to the sub-population with the lower mean radial velocity and 7 to the sub-population with the higher mean radial velocity which is in good agreement with the expectations (see 2.1). The confidence level for bimodality is %.
The (weighted) mean radial velocity of all 7 detected globular clusters is km s-1. This value deviates from the measured radial velocity of NGC 3115 DW by which is a hint that we are biased towards lower velocities by both the small sample and the choice of slit-mask position on the sky. Since we detected globular clusters predominantly in the central and northern field of NGC 3115 DW1 our measurements could be influenced by a systematic rotation of the GCS (see also Sect. 3.1.4).
All 22 objects with low radial velocities have a weighted mean velocity of km s-1. Assuming a simple stellar rotation model for the Milky Way we expect the foreground stars in the direction of NGC 3115 DW1 ( and ) to have km s-1 (van de Kamp, 1967) which is in rough agreement with our measurement.
In summary, within our data of 46 spectroscopically-analyzed objects we found 7 globular clusters 22 foreground stars, and 15 background galaxies (9 of them are significantly clumped about km s-1 or ; the velocity dispersion of this potential galaxy cluster is km s-1). 2 objects (D21,L6) could not be identified reliably and were therefore dropped. The radial-velocity data for all objects are summarized in Table 1.
3.1.2 Mass Estimate of NGC 3115 DW1
Our data sample of 7 globular clusters is only sufficient for a first rough mass estimate of NGC 3115 DW1 and its M/L ratio. Furthermore, we rely in this section on the assumption that the system is not influenced by the nearby giant S0 galaxy, an assumption that we will question in Sec. 5.
We used two mass estimators which are extensively described and tested by Bahcall & Tremaine (1981) and Heisler et al. (1985). We applied the Virial Mass Estimator (VME) and the Projected Mass Estimator (PME) accounting for different orbit characteristics of the globular clusters. Since the alignment of our multi-slit masks is biased towards clusters of the central and northern quadrant of the galaxy, our data is subject to unknown systematic east-west rotation of the entire globular cluster system. If the angular momentum vector points along the north-south axis we will have under- or overestimated the mass depending on the direction of rotation. Although, it is possible to provide a lower-mass limit from our spatially constrained cluster sample by varying the mean systemic velocity (see below), it is not possible to correct completely for the unknown total rotation of the globular cluster system (see also 3.1.4).
We let the radial velocity of NGC 3115 DW1 (which is assumed to be the mean velocity of the GCS as well) vary over a wide range while the measured radial velocities of the globular clusters remained fixed. During each step of 10 km s-1 we calculated the mass of the galaxy with each mass estimator. The resulting plot (mass vs. of the GCS) is shown in Figure 3. Table 2 shows the lower mass limits calculated with all mass estimators.
At the highest measured radial velocity of NGC 3115 DW1 ( km s-1, Peterson & Caldwell, 1993) we obtain total masses in the range M⊙ to M⊙. The estimated masses for the measured mean radial velocity of the globular cluster system ( km s-1) are in the range M⊙ to M⊙. The errors in Table 2 are the intrinsic, statistic, and systematic uncertainties of the mass-estimate. The first is the uncertainty of the code itself (Bahcall & Tremaine, 1981) while the remaining are due to the limited sample size and the uncertain distance. All masses are the total mass estimates within a galactocentric radius of ″ or kpc, respectively. This is the projected radial distance of the outermost globular cluster (L63).
Assuming an isotropic orbit distribution for globular clusters in NGC 3115 DW1 the lower-mass limit for the galaxy of M⊙ seems rather large for a dwarf elliptical. The absolute magnitude of mag (Durrell et al., 1996b) is high as well (more than a magnitude brighter than M32 for example, and similar to NGC 4486B, although NGC 3115 DW1 has a dissimilar structure to that of these low-L Es). The mean absolute V-magnitude for nearby dwarf ellipticals is mag (Ferguson & Binggeli, 1994). Considering its mass and luminosity we address the fact that NGC 3115 DW1 appears to be a transition-type galaxy between luminous dEs and low-luminosity ellipticals in the discussion section.
3.1.3 Radial Dependencies and Mass-to-Light Ratios
Limiting the data set of radial velocities to smaller radii we can probe the radial mass dependencies in NGC 3115 DW1. Clearly, statistical errors become important when we reduce the already small data set by removing the outermost globular clusters. Nonetheless, we calculate mass estimates for different radii (using the PME and assuming isotropic orbits) since the kinematics of the two outer clusters might be influenced by the nearby giant S0. The results are summarized in Table 3.
Combining the former findings with the photometry of Durrell et al. (1996b), who found total magnitudes mag and mag, we estimate rough mass-to-light ratios for different radii. Applying a King profile (King, 1962) with the parameters 14.4″ and 1.4 (Durrell et al., 1996b) we obtain at the outermost globular-cluster projected radius ″ ( kpc) M/L with a uncertainty due to statistical sample-size uncertainties and photometric errors. The systematic error due to distance uncertainties of NGC 3115 DW1 is . Going inwards, the M/LV ratio drops. At a projected radius of ″ ( kpc) the mass-to-light ratio is M/L.
Our analysis can be expanded by combining our results with the M/LV measurements for the innermost part of NGC 3115 DW1. Peterson & Caldwell (1993) measure within ″ (or pc) of NGC 3115 DW1 a central velocity dispersion of km s-1. They derive a M/LV of within ″. A gradient of M/LV can therefore be traced outward from the center of the galaxy, although the uncertainties are quite large. However, all values fit well into the range given by Ferguson & Binggeli (1994) for dwarf elliptical galaxies (M/L for Fornax up to M/L for Ursa Minor).
3.1.4 Rotation and Velocity Dispersion
Using the Maximum-Likelihood method of Pryor & Meylan (1993) we measure a marginal net rotation of km s-1 for the globular cluster system of NGC 3115 DW1. Note that to date no dE was reported to show significant rotation of its stellar body (Ferguson & Binggeli, 1994). The position angle of the rotation axis is (poorly defined given the weak rotation). This result may be of course biased by the incomplete spatial coverage of our small sample. Correcting for the net rotation we obtain a line-of-sight velocity dispersion of km s-1 for the full sample of 7 clusters, and km s-1 for the inner 5 clusters.
The major axis of the dE1,N galaxy of (Durrell et al., 1996b) appears at face value nearly parallel to the rotation axis of the GCS although the latter is not well defined as mentioned above. Spectroscopy for more clusters with better spatial coverage is certainly needed to establish the axis alignment.
3.2 Metallicity
3.2.1 Mean Metallicity of the Globular Cluster System
The S/N of our spectra are insufficient to reliably establish individual cluster metallicities. To measure a mean abundance for the GCS we combined all the individual spectra into a high-S/N ‘mean’ spectrum. All individual globular cluster spectra as well as the combined spectrum are shown in Figure 4.
For abundance measurements we used the passband definitions of Brodie & Huchra (1990) and the new Lick/IDS passband definitions of Trager et al. (1998). All abundances (both of single spectra and the mean spectrum) are given in Table 4. Brodie & Huchra (1990) calibrate single element abundances with [Fe/H] using a large sample of Milky Way and M31 globular clusters. We used their calibration to estimate the mean [Fe/H] for the entire GCS, based on the composite spectrum. The mean metallicity of our globular cluster sample is [Fe/H] dex. Exactly the same value is obtained from the weighted mean of the individual measurements (see Table 5).
Overall, the mean metallicity does not follow the empirical GCS-metallicity — galaxy-luminosity relation (see Fig. 5.7 in Ashman & Zepf, 1998). NGC 3115 DW1 ( mag) falls in the transition region between dwarfs and elliptical galaxies, whereas the mean metallicity of the GCS falls in the range of metallicities found in giant elliptical galaxies. According to this empirical relation NGC 3115 DW1 appears to be slightly too metal-rich for its luminosity.
3.2.2 Abundance Ratios
We compare the mean abundance ratios of the GCS with abundance ratios of globular clusters in other galaxies. Trager et al. (1998) provide a compilation of abundances of Milky Way and M31 globular clusters. Abundances of NGC 1399 globular clusters were measured by Kissler-Patig et al. (1998b). Both data sets use the definitions of the Lick/IDS system. In order to minimize the statistical noise of abundance measurements we calculate a mean iron abundance and a mean metal abundance (see González, 1993, for a detailed discussion).
Figure 5 shows abundance ratios for several dominant elements. The upper four panels show abundance ratios relative to the [MgFe] index. In the upper left panel the age-sensitive H abundance is seen to be in good agreement with Milky Way and M31 data, although possibly at the lower (older) edge. The upper right panel shows the G-band index compared with the [MgFe] index. The G-band is a primary metallicity indicator (Brodie & Huchra, 1990). The data show no abundance anomalies.
The two middle panels of Figure 5 could in principal be used to examine the -element content of these globular clusters. For the stellar light of (mostly brighter) ellipticals Worthey et al. (1992) found an -element enhancement. The [/Fe] enhancement is a very sensitive indicator of the star formation rate in a galaxy. As -elements are preferentially created in SNe type II, their enhancement indicates a violent star formation and/or a top-heavy IMF. A depression, or normal values, of [/Fe] would result from quiet star formation in which SNe Ia dominate the enrichment processes. Given the relatively high mean metallicity ([Fe/H] dex), a normal -element ratio would suggest that these clusters formed from enriched material either during epochs of quiet star formation, or at the very beginning of a burst. Better data could lead to interesting insights on this topic.
4 Photometry
4.1 Spectroscopic check on photometry
The main result from the photometry of Durrell et al. (1996b) was that the GCS in NGC 3115 DW1 is rich with a specific frequency of and a total globular cluster population . Our spectroscopy and the photometric data set of Durrell et al. have 22 objects in common (see Figure 1 and Table 6). 6 of these 22 objects have projected radial distances of ″ ( kpc). Durrell et al. consider the GCS to lie within this radius (mainly because the surface over-density of objects disappears beyond it). We can confirm 4 of the 6 objects as bona-fide globular clusters (D7, D14, D15, and D46). One object was found to be a background galaxy and another cannot be identified either by radial velocity or by its spectrum.
Assuming that this sample of 6 objects is a statistically representative sample of objects in the projected vicinity of NGC 3115 DW1 the upper limit of the probability of finding a globular cluster within a radius of ″ ( kpc) around the center of NGC 3115 DW1 is (the lower limit is ; if we exclude the non-identified object). This is in good agreement with the findings of Durrell et al. (1996b), although the statistical significance is very low. Durrell et al. measure the contaminating surface density of background objects to be arcmin-2. Within their radial limit of ″ there are a total of background objects. For a total population of , the probability of picking a globular cluster within ″ (and at the magnitude limit of the photometry of Durrell et al.) is . Our spectroscopic results suggest that there is no need to make any correction to the values for specific frequency and total globular cluster population size derived from photometry.
Miller et al. (1998) measure specific frequencies for dwarf elliptical galaxies in the Virgo and Fornax cluster and find a relations for the nucleated dwarfs. NGC 3115 DW1 has a higher specific frequency () than the derived from Miller’s et al. relation for group and cluster dE,N galaxies.
Figure 6 shows the CMD of objects with ″ ( kpc) which have been marked by open squares. Objects with photometry by Durrell et al., spectroscopically identified foreground stars, background galaxies, and globular clusters are indicated. We determined the mean color of 5 globular clusters (2 spectroscopically confirmed globular clusters are not included in the photometric sample) in this CMD with Maximum-Likelihood techniques. We obtained mag with a dispersion of mag. Durrell et al. found mag, mag for the total sample i.e. corresponding to a lower mean metallicity. Our subset seems to be slightly biased towards metal-rich objects.
4.2 Comparison of photometrically- and spectroscopically-derived metallicities
In order to constrain the significance of photometrically-derived metallicities we transform the color into a [Fe/H]-metallicity and compare it with the findings of our abundance measurements. For this purpose we use the relation of Couture et al. (1990)
| (1) |
with [Fe/H] being the independent parameter during the calibration of the equation. The application of equation 1 to all de-reddened (E mag, Schlegel et al., 1998) globular-cluster colors in our NGC 3115 DW1 sample leads to photometrically derived metallicities which can be compared with the [Fe/H] values from spectroscopy. All data are summarized in Table 5. The resulting weighted mean metallicity is [Fe/H] dex (for the 5 globular clusters) with a dispersion of [Fe/H] dex in good agreement with the values derived from spectroscopy. The uncertainty results from the photometric error of the color only. No transformation uncertainty was included.
4.3 Globular Cluster Sizes
We matched two spectroscopically-confirmed globular clusters, D15 and D25 (see Figure 1 and Table 6), in the HST images taken from the archive (both on WF chips). At the distance of NGC 3115 DW1 the WF chips resolve globular clusters with core radii of 5 pc. Only 14% of Milky-Way globular clusters show core radii larger that 5 pc (Harris, 1999). However, we can use the HST data to derive upper limits for the globular cluster sizes. Only images taken through the F814W filter were used because of their higher S/N.
The radial source profile (i.e. the PSF of the final image) is a convolution of the object profile with the telescope PSF and an additive noise term ( being the radial distance from the center of the profile);
| (2) |
To calculate the telescope-PSF profile we used the TinyTim v4.4 code by Krist & Hook (1997) which gives a semi-analytic estimation of the HST-PSF for each chip, each chip position, and each filter. We adopted a King profile (King, 1962) for which appears to be a good fit to globular-cluster radial profiles in Milky Way (e.g. Trager et al., 1995) and extragalactic systems (Grillmair et al. 1996 in M31, Elson & Freeman 1985 in LMC, Kundu & Whitmore 1998 in NGC 3115, Kundu et al. 1999 in M87, and Puzia et al. 1999 in NGC 4472). From an analysis of Milky Way globular clusters (Harris, 1999) we chose as a concentration parameter.
In equation 2 we neglect the additive noise term since our size-estimation errors are dominated by the convolution of the poorly-defined charge-diffusion matrix with the optical HST-PSF (see Krist & Hook, 1997, for a detailed discussion). Note that the charge-diffusion smears 25% of the infalling light of the central pixel among its neighbors. For consistency with other work we continue to use this convolution throughout our analysis despite the fact that the diffusion correction has been derived only for the F555W filter and is thought to be wavelength dependent.
Five King profiles were generated with core radii in the range pix ( pc). In addition, we generated HST-PSFs for both our identified globular clusters using individual specifications (e.g. filter, chip, chip position). Both HST-PSFs were convolved with all the King profiles. Aperture photometry was applied to all generated profiles and both globular clusters on the HST images. For this purpose we used SExtractor (Bertin & Arnouts, 1996) and measured magnitudes in 30 apertures with diameters in the range 1–30 pix. All magnitudes were normalized to the average aperture magnitudes in the range 10–30 pix, i.e. . Figure 7 shows the profiles of both globular clusters, a raw HST-PSF profile, and two of the convolution profiles with core radii of and 0.4 pix.
Both globular cluster profiles deviate significantly from the raw HST-PSF profile which indicates that both D15 and D25 are resolved. The S/N of the F814W image drops to 1 at an aperture diameter of 6 pix. For larger apertures there is insufficient signal to detect any deviations from a raw HST-PSF. For smaller apertures both globular cluster profiles lie between King profiles of core radii 0.2 pix and 0.4 pix. We deduce an upper limit for both globular cluster sizes of pc at an adopted distance of NGC 3115 DW1 of Mpc (Durrell et al., 1996b). 27% of Milky-Way globular clusters have core radii larger than 2.1 pc (Harris, 1999) and 10% have sizes in the range defined by the errors of the NGC 3115 DW1 clusters.
This upper limit compares well with the results of Kundu & Whitmore (1998) and Kundu et al. (1999). Using HST photometry, these authors find typical half-light radii444The half-light radius is comparable with the core radius of a King profile. of pc and pc for globular clusters in NGC 3115 and M87, respectively.
5 Discussion
In section 3.1.4, we derived a high globular cluster velocity dispersion, and thus a high galaxy mass, when we included the two outermost globular clusters. The high mass is not unexpected given the bright absolute magnitude of NGC 3115 DW1. Based on its mag (Durrell et al., 1996b), NGC 3115 DW1 falls in the transition region between dwarfs and ellipticals in the mass-luminosity relation of Dekel & Silk (1986) (see Fig. 3 therein). Its high mass (M⊙) and the high velocity dispersion ( km s-1, see below) are more consistent with an elliptical galaxy. We therefore discuss whether the two outermost clusters could be in the process of being stripped by the nearby giant S0 galaxy NGC 3115.
5.1 Possible Stripping?
Figure 1 and Table 6 show that 2 (L1 and L63) of the 7 globular clusters have significantly larger projected radii, i.e. 161.4″ ( kpc, L1) and 189.4″ ( kpc, L63), than the “inner” (″ kpc) globular clusters. These large projected distances from NGC 3115 DW1 could be due to stripping by the nearby S0 galaxy NGC 3115. Figure 8 shows the relative positions of NGC 3115 DW1 and NGC 3115. The projected distance between the two galaxies is 17.3′ which corresponds to 55 kpc at the distance of 11 Mpc. The mean radial velocities of L1 and L63 are km s-1 and km s-1, respectively. Only L1 shows a significant deviation from the systemic velocity of NGC 3115 DW1 ( km s-1, Capaccioli et al., 1993) and NGC 3115 ( km s-1, Capaccioli et al., 1993).
We expect no contamination from globular clusters of the nearby galaxy NGC 3115. Kavelaars (1997) found the surface density over-abundance of globular clusters around NGC 3115 (power-law index of radial distribution ) disappearing at 6′ radius from the center of NGC 3115 (at a photometric limit of mag). The globular clusters L1 and L63 have a radial distance to NGC 3115 of ′. The projected GC surface density of the GCS of NGC 3115 at the position of these two clusters is arcmin-2. The extrapolated GC surface density of NGC 3115 DW1 at this position lies between 0.2 and 6.9 GCs arcmin-2, given the large uncertainties on the density profile. As the numbers are too small (we only found 2 clusters to the north and 0 to the south) it cannot statistically be concluded whether the two globular clusters found in the northern field are chance detections or a statistically significant overabundance.
Assuming that both galaxies are roughly at the same distance, we can estimate the dwarf galaxy’s gravitational potential and the ratio of potentials of NGC 3115 DW1 and NGC 3115. Both globular clusters are at about 1/5 of the distance separating NGC 3115 DW1 and NGC 3115. As a rough estimate, we assume that NGC 3115 DW1 and NGC 3115 have similar M/LV. In this case, the ratio of their ’s would imply that NGC 3115 has a mass 10 times larger than NGC 3115 DW1. Hence, the gravitational potentials are comparable at the projected position of the distant globular clusters (L1 and L63). Since the mass of NGC 3115 is likely to be higher than the adopted value (assuming an extended dark matter halo) the motion of both globular clusters is no longer dominated by the gravitational potential of NGC 3115 DW1 alone. Both clusters could then be considered as intergalactic globular clusters.
Note that stripping of globular clusters appears to be common among interacting galaxies. Da Costa & Armandroff (1995) show that four globular clusters of the Sagittarius dSph are in the process of being stripped by the Milky Way and are being added to its globular cluster system. Other studies have indicated that stripping may be important in galaxy clusters (e.g. in the Fornax cluster Kissler-Patig et al. 1999, Hilker et al. 1999). However, there are no other (optical) hints of interaction from NGC 3115 DW1’s stellar light. Durrell et al. (1996b) found the isophotes to be consistent with little or no tidal disruption out to a projected radius of 60″ (corresponding to 3.2 kpc) where their photometric errors start to dominate.
A simple test for the stripping hypothesis would be a wide-field study of the system in order to rule out (spectroscopically) the presence of any similar clusters around NGC 3115 DW1.
5.2 The Expected Velocity Dispersion
A look at the fundamental plane of dwarf elliptical galaxies (e.g. Peterson & Caldwell, 1993) shows that NGC 3115 DW1 fits reasonably well into the relation for dwarf and giant elliptical galaxies, under their assumption of mag. Adopting the absolute magnitude of mag (Durrell et al., 1996a) the galaxy falls slightly off the relation and would imply a higher velocity dispersion than measured in the central 3″. With the measured velocity dispersion of km s-1 for the 5 globular clusters inside ″ ( kpc) we obtain from the fundamental-plane relation of Peterson & Caldwell (1993) an absolute magnitude of mag. The measured velocity dispersion for the total sample of 7 clusters inside ″ ( kpc) of km s-1, would correspond to far brighter absolute magnitude ( mag) than the measured mag. This discrepancy can be explained by a close encounter and subsequent stripping of the dwarf galaxy’s halo by the nearby S0 galaxy NGC 3115. Stripping of outer halo regions might well have introduced violent perturbations and led to an enhanced velocity dispersion of the halo region (which is traced by the globular clusters). The relaxation time of such a system far exceeds the Hubble time (Binney & Tremaine, 1994) and therefore it is not possible to reject this scenario just from considerations of dynamical timescales.
Alternatively, a high velocity dispersion in the outskirts of a galaxy could be due to a dark-matter dominated massive halo. The outer parts of a number of lower-luminosity Local Group galaxies are known to be dominated by dark matter (e.g. Mateo, 1998). This picture could explain the fact that we measure an uncommonly high mass for a dwarf elliptical (see sec. 3.1.2) at a projected radius of 189.4″ ( kpc).
We cannot discriminate between the above possibilities at this point.
6 Summary
Using LRIS multi-slit spectra we confirm, on the basis of their radial velocities, 7 of the 46 objects in our spectroscopic sample as bona-fide globular clusters associated with the bright ( mag) dE1,N galaxy, NGC 3115 DW1.
We verify the findings of Durrell et al. (1996b) (within a projected radius of ″ corresponding to kpc) who derived the specific frequency and a total globular cluster population size . The spectroscopic verification of foreground and background contamination indicates that no revision of these results is necessary. NGC 3115 DW1 remains a dE,N galaxy with a somewhat high value.
A mass estimate using the Projected Mass Estimator (PME) for isotropic globular cluster orbits yields a total galaxy mass of (with the error being the internal uncertainty of the mass estimation code) inside a radius ″ ( kpc) and inside ″ ( kpc). This estimate is a lower mass limit (see 3.1.2) and assumes that the outer globular clusters are not influenced by the nearby giant S0 NGC 3115. Using two mass estimators (i.e. PME and VME, see Sect. 3.1.2) and various assumptions for the systemic velocity and the cluster orbits, we derive masses between M⊙ and M⊙. The mass increases with radius (see Table 3). Inside R pc the mass-to-light ratio was found to be M/L (Peterson & Caldwell, 1993) and increases with radius, leading to M/L at 10 kpc (using the PME and assuming isotropic orbits), compatible with dark matter dominated outer regions. However, we cannot at present exclude the possibility that the high velocity dispersion is due to stripping of the two outer clusters by the nearby giant companion.
A kinematic analysis shows that the globular cluster system has a marginal net rotation of km s-1 with a position angle of the rotation axis . Subtracting the net rotation we find a line-of-sight velocity dispersion of the globular cluster system of km s-1 for the total sample of 7 globular clusters and km s-1 for the inner 5 clusters (see Sect. 3.1.4).
We measure mean abundances (using Lick/IDS passband definitions) from a combined mean spectrum of all 7 globular clusters and derive a mean GCS metallicity of [Fe/H] dex. All abundance ratios appear similar to the ones measured in Milky Way, M31 and NGC 1399 globular clusters.
The mean color of the spectroscopically confirmed globular clusters is mag with a dispersion mag.
Applying the color-metallicity calibration of Couture et al. (1990) we obtain a photometric mean metallicity [Fe/H] dex with a dispersion of dex (the error being the photometric uncertainty).
For two globular clusters (L1 and L63) with HST photometry we derive upper limits for their core radii. These were found to be pc.
References
- Allen (1973) Allen, C. W. 1973, Astrophysical Quantities, The Athlone Press
- Ashman et al. (1994) Ashman, K. M., Bird, C. M., and Zepf, S. E. 1994, AJ, 108, 2348–2361
- Ashman & Zepf (1998) Ashman, K. M., and Zepf, S. E. 1998, Globular cluster systems, Cambridge University Press
- Bahcall & Tremaine (1981) Bahcall, J. N., and Tremaine, S. 1981, ApJ, 244, 805–819
- Bertin & Arnouts (1996) Bertin, E., and Arnouts, S. 1996, A&AS, 117, 393–404
- Binney & Tremaine (1994) Binney, J., and Tremaine, S. 1994, Galactic Dynamics, Princeton Series in Astrophysics, Princeton University Press
- Brodie & Huchra (1990) Brodie, J. P., and Huchra, J. P. 1990, ApJ, 362, 503–521
- Capaccioli et al. (1993) Capaccioli, M., Cappellaro, E., Held, E. V., and Vietri, M. 1993, A&A, 274, 69–78
- Côté et al. (1998) Côté, P., Marzke, R. O., and West, M. J. 1998, ApJ, 501, 554
- Couture et al. (1990) Couture, J., Harris, W. E., and Allwright, J. W. B. 1990, AJ, 73, 671–683
- Da Costa & Armandroff (1995) Da Costa, G. S., and Armandroff, T. E. 1995, AJ, 109, 2533+
- Dean et al. (1978) Dean, J. F., Warren, P. R., and Cousins, A. W. J. 1978, MNRAS, 183, 569–583
- Dekel & Silk (1986) Dekel, A., and Silk, J. 1986, ApJ, 303, 39–55
- Durrell et al. (1996a) Durrell, P. R., Harris, W. E., Geisler, D., and Pudritz, R. E. 1996a, AJ, 112, 972
- Durrell et al. (1996b) Durrell, P. R., McLaughlin, D. E., Harris, W. E., and Hanes, D. A. 1996b, ApJ, 463, 543–554
- Elson & Freeman (1985) Elson, R. A. W., and Freeman, K. C. 1985, ApJ, 288, 521–530
- Ferguson & Binggeli (1994) Ferguson, H. C., and Binggeli, B. 1994, ARA&A, 6, 67–122
- González (1993) González, J. J. 1993, PhD thesis, UCO/Lick Observatory
- Grillmair et al. (1996) Grillmair, C. J., Ajhar, E. A., Faber, S. M., Baum, W. A., Holtzman, J. A., Lauer, T. R., Lynds, C. R., and O’Neil, E. J. Jr. 1996, AJ, 111, 2293+
- Harris (1999) Harris, W. E. 1999, Catalog of parameters for Milky Way globular clusters, http://physun.physics.mcmaster.ca/Globular.html
- Heisler et al. (1985) Heisler, J., Tremaine, S., and Bahcall, J. N. 1985, ApJ, 298, 8–17
- Hilker et al. (1999) Hilker, M., Infante, L., and Richtler, T. 1999, A&AS, 138, 55–70
- Holtzman et al. (1995) Holtzman, J., Burrows, C. J., Casertano, S., Hester, J. J., Trauger, J. T., Watson, A. M., and Worthey, G. 1995, PASP, 107, 1065–1093
- Horne (1986) Horne, K. 1986, PASP, 98, 609–617
- Huchra et al. (1982) Huchra, J., Stauffer, J., Van Speybroeck, L. 1982, ApJ, 259, L57–L61
- van de Kamp (1967) van de Kamp, P. 1967, Principles of Astrometry, A series of Books in Mathematics, eds. R. A. Rosenbaum, and G. P. Johnson, W. H. Freeman and Company
- Kavelaars (1997) Kavelaars, J. J. 1997, PhD thesis, Queen’s University, Ontario
- King (1962) King, I. 1962, AJ, 67, 471–485
- Kissler-Patig et al. (1998a) Kissler-Patig, M., Forbes, D.A., and Minniti, D. 1998a, MNRAS298, 1123
- Kissler-Patig et al. (1998b) Kissler-Patig, M., Brodie, J. P., Schroder, L. L., Forbes, D. A., Grillmair, C. J., and Huchra, J. P. 1998b, AJ, 115, 105–120
- Kissler-Patig et al. (1999) Kissler-Patig, M., Grillmair, C. J., Meylan, G., Brodie, J. P., Minniti, D., and Goudfrooij, P. 1999, AJ, 117, 1206–1218
- Krist & Hook (1997) Krist, J., and Hook, R. 1997, The TinyTim v4.4 Handbook, http://scivax.stsci.edu/~krist/tinytim.html
- Kundu & Whitmore (1998) Kundu, A., and Whitmore, B. C. 1998, AJ, 116, 2841–2853
- Kundu et al. (1999) Kundu, A., Whitmore, B. C., Sparks, W. B., Macchetto, F. D., Zepf, S. E., and Ashman, K. M. 1999, ApJ, 513, 733–751
- Mateo (1998) Mateo, M. L. 1998, ARA&A, 36, 435–506
- Miller et al. (1998) Miller, B. W., Lotz, J. M., Ferguson, H. C., Stiavelli, M., and Whitmore, B. C. 1998, ApJ, 508, L133–L137
- Minniti et al. (1996) Minniti, D., Meylan, G., and Kissler-Patig, M. 1996, A&A, 312, 49
- Oke et al. (1995) Oke, J. B., Cohen, J. G., Carr, M., Cromer, J., Dingizian, A., Harris, F. H., Labrecque, S., Lucinio, R., Schaal, W., Epps, H., and Miller, J. 1995, PASP, 107, 375–385
- Peterson & Caldwell (1993) Peterson, R. C., and Caldwell, N. 1993, AJ, 105, 1411–1419
- Pryor & Meylan (1993) Pryor, C. & Meylan, G. 1993, In Structure and Dynamics of Globular Clusters, ASP Conf. Series Vol. 50, eds. S.G. Djorgovski and G. Meylan
- Puzia et al. (1999) Puzia, T. H., Kissler–Patig, M. K., Brodie, J. P., and Huchra, J. P. 1999, AJ, 118, 2734–2750
- Schlegel et al. (1998) Schlegel, D. J., Finkbeiner, D. P., and Davis, M. 1998, ApJ, 500, 525–553
- Searle & Zinn (1978) Searle, L., and Zinn, R. 1978, ApJ, 225, 357
- Silverman (1986) Silverman, B. W. 1986, Density Estimation for Statistics and Data Analysis, Chap and Hall/CRC Press, Inc.
- Trager et al. (1995) Trager, S. C., King, I. R., and Djorgovski, S. 1995, AJ, 109, 218–241
- Trager et al. (1998) Trager, S. C., Worthey, G., Faber, S. M., Burstein, D., and González, J. J. 1998, ApJS, 116, 1+
- de Vaucouleurs et al. (1991) de Vaucouleurs, G., de Vaucouleurs, A., Corwin, H. G. Jr., Buta, R., Paturel, G., and Fouque, P. 1991, Third Reference Catalogue of bright galaxies, Berlin: Springer
- Worthey et al. (1992) Worthey, G., Faber, S. M., González, J. J. 1992, ApJ, 398, 69–73
| slit No.aaOrdinal number of slits in each mask. Along the alignment of both masks slit 1 is in the most north-western part of the field-of-view as shown in Figure 1. | codebbObject identification marker. The code corresponds to markers of spectroscopically identified globular clusters in Figure 1. | cat.ccClassification category of the spectrum. It is: – star, – galaxy, and – globular cluster. “?” indicates that the spectrum shows only slight features of a typical spectrum in the classification category while “??” indicates that due to too low S/N no classification is possible by visual inspection. | ||||||||
|---|---|---|---|---|---|---|---|---|---|---|
| all radial velocities in km s-1 | ||||||||||
| mask A | ||||||||||
| 1 | L15 | 70492 | 336 | 70386 | 168 | 70407 | 106 | |||
| 2 | L3 | 63 | 100 | 81 | 136 | 69 | 57 | |||
| 3 | L27 | 25223 | 242 | 25242 | 189 | 25235 | 105 | |||
| 4 | L11 | 66 | 113 | 105 | 120 | 84 | 58 | |||
| 5 | L18 | 194 | 74 | 208 | 97 | 199 | 42 | |||
| 6 | L7 | 50 | 195 | 65 | 141 | 60 | 81 | |||
| 7 | L16 | 211 | 178 | 183 | 162 | 196 | 85 | /? | ||
| 8 | D8 | 67 | 127 | 101 | 111 | 86 | 59 | |||
| 9 | D21 | ?? | ||||||||
| 10 | D10 | 100 | 85 | 118 | 73 | 110 | 39 | |||
| 11 | D58 | 1864 | 153 | 23692 | 225 | 8766 | 89 | /?? | ||
| 12 | D73 | 4987 | 307 | 5030 | 225 | 5015 | 128 | /?? | ||
| 13 | D20 | 22542 | 226 | 22576 | 192 | 22562 | 103 | |||
| 14 | D24 | 160 | 224 | 154 | 223 | 157 | 112 | |||
| 15 | D14 | 455 | 156 | 477 | 149 | 478 | 190 | 468 | 71 | /? |
| 16 | D6 | 17 | 61 | 32 | 66 | 24 | 32 | |||
| 17 | D1 | 143 | 73 | 152 | 83 | 147 | 39 | |||
| 18 | D5 | 124 | 70 | 139 | 73 | 131 | 36 | |||
| 19 | L37 | 24531 | 180 | 24614 | 243 | 24560 | 102 | /?? | ||
| 20 | L44 | 22979 | 210 | 23020 | 223 | 22998 | 108 | /?? | ||
| 21 | L14 | 34 | 111 | 67 | 103 | 52 | 53 | |||
| 22 | L51 | 26 | 187 | 71 | 196 | 47 | 96 | |||
| 23 | L1 | 386 | 76 | 402 | 79 | 453 | 44 | 420 | 29 | |
| 24 | L63 | 545 | 227 | 506 | 222 | 668 | 99 | 605 | 74 | /? |
| mask B | ||||||||||
| 1 | L8 | 99434 | 137 | 99453 | 125 | 99444 | 65 | |||
| 2 | L4 | 55 | 136 | 45 | 109 | 49 | 60 | |||
| 3 | L6 | ?? | ||||||||
| 4 | L23 | 337 | 227 | 259 | 201 | 293 | 106 | /? | ||
| 5 | D9 | 9 | 128 | 36 | 117 | 24 | 61 | |||
| 6 | D36 | 23 | 152 | 13 | 140 | 4 | 73 | |||
| 7 | D26 | 241 | 2545 | 201 | 2567 | 109 | /?? | |||
| 8 | D2 | 37 | 111 | 24 | 129 | 11 | 59 | |||
| 9 | D25 | 540 | 146 | 512 | 158 | 540 | 100 | 532 | 60 | |
| 10 | D46 | 628 | 215 | 619 | 208 | 623 | 106 | /?? | ||
| 11 | D3 | 22 | 113 | 12 | 112 | 5 | 56 | |||
| 12 | D15 | 677 | 67 | 692 | 72 | 672 | 62 | 681 | 30 | |
| 13 | D7 | 685 | 70 | 706 | 74 | 710 | 34 | 703 | 25 | |
| 14 | D42 | 42007 | 264 | 70422 | 231 | 58100 | 123 | /? | ||
| 15 | L36 | 59943 | 215 | 3899 | 176 | 26386 | 96 | /?? | ||
| 16 | D41 | 262 | 206 | 376 | 224 | 307 | 50 | 308 | 45 | /? |
| 17 | L37 | 43855 | 162 | 17383 | 168 | 31100 | 82 | /?? | ||
| 18 | L26 | 22836 | 339 | 22952 | 333 | 22895 | 168 | |||
| 19 | L39 | 27415 | 366 | 22664 | 251 | 24184 | 146 | /?? | ||
| 20 | L52 | 87 | 287 | 168 | 217 | 139 | 122 | /?? | ||
| 21 | L17 | 131653 | 187 | 131659 | 79 | 131658 | 51 | |||
| 22 | L38 | 24447 | 135 | 26512 | 335 | 24735 | 89 | /? | ||
Note. — Summary of all radial velocities including “internal” cross-correlation errors and statistical errors from line shift measurements. All radial velocities are given in km s-1. is a mean radial velocity calculated from redshifts of the element lines: Ca II K (3933Å), Ca II H (3967Å), H (4101Å), Ca I (4226Å), H (4340Å), Fe I (4383Å), Fe I (4528Å), H (4861Å), Mg I (5183Å), Fe I (5270Å) (Allen, 1973, rest wavelengths in parentheses).
| masses in M⊙ | ||||
|---|---|---|---|---|
| estimator | aaIndividual intrinsic uncertainty of the mass-estimation code. Note that for VME there is no analytical variance formula available. | bbStandard uncertainty of the mass estimate due to the limited sample size as numerically determined in Bootstrap tests. | ccSystematic uncertainty due to potential distance error. | |
| VME | 2.11 | 0.04 | ||
| PMEi | 4.77 | 2.28 | 0.16 | |
| PMEr | 9.54 | 5.05 | 0.32 | |
| PMEm | 7.15 | 2.77 | 0.24 | |
| PMEt | 3.18 | 1.41 | 0.11 | |
Note. — Lower mass estimate for NGC 3115 DW1 out to a radius of ″ or kpc. All masses are given in units of . Different orbit characteristics of the globular clusters were adopted for the mass estimate using the Projected Mass Estimator (PME): PMEi adopts isotropic orbits, PMEr adopts radial orbits, PMEm assumes mixed while PMEt adopts tangential globular-cluster orbits (for details see Bahcall & Tremaine, 1981).
| masses in M⊙ | |||||
|---|---|---|---|---|---|
| aaMass estimate for the -th projected radial distance evaluated with PME for isotropic globular-cluster orbits. The masses are given in units of . | bbInternal uncertainty of the mass-estimation code. | ccStandard uncertainty from Bootstrap tests. | # of GCsddNumber of globular clusters included in the data sample which was used to estimate the mass at the -th radius. | ||
| ″ | kpc | 4.77 | 2.28 | 0.16 | 7 |
| ″ | kpc | 4.55 | 2.35 | 0.25 | 6 |
| ″ | kpc | 1.82 | 1.03 | 0.08 | 5 |
| ″ | kpc | 1.61 | 1.02 | 0.06 | 4 |
| D46 | D14 | |||||
|---|---|---|---|---|---|---|
| line/band | [mag] | [Fe/H]i | [mag] | [Fe/H]i | ||
| CNB | 0.195 | 0.197 | ||||
| H+K | 0.155 | 0.242 | ||||
| CNR | 0.328 | 0.474 | ||||
| CH=Gband | 0.126 | 0.246 | ||||
| H | ||||||
| MgH | 0.257 | 0.372 | ||||
| MgG | ||||||
| Mg2 | 0.496 | 0.698 | ||||
| Mgb | ||||||
| Fe52 | 0.146 | 0.221 | ||||
| [Fe/H] | dex | dex | ||||
| D15 | D7 | |||||
| CNB | 0.619 | 0.745 | ||||
| H+K | 0.620 | 0.777 | ||||
| CNR | 0.898 | 1.242 | ||||
| CH=Gband | 0.494 | 0.756 | ||||
| H | ||||||
| MgH | 0.726 | 1.050 | ||||
| MgG | ||||||
| Mg2 | 1.295 | 1.796 | ||||
| Mgb | ||||||
| Fe52 | 0.467 | 0.701 | ||||
| [Fe/H] | dex | dex | ||||
| D25 | L1 | |||||
| line/band | [mag] | [Fe/H]i | [mag] | [Fe/H]i | ||
| CNB | 0.419 | 0.854 | ||||
| H+K | 0.399 | 0.791 | ||||
| CNR | 0.660 | 1.323 | ||||
| CH=Gband | 0.363 | 0.818 | ||||
| H | ||||||
| MgH | 0.506 | 1.249 | ||||
| MgG | ||||||
| Mg2 | 0.944 | 2.074 | ||||
| Mgb | ||||||
| Fe52 | 0.308 | 0.847 | ||||
| [Fe/H] | dex | dex | ||||
| L63 | ||||||
| line/band | [mag] | [Fe/H]i | [mag] | [Fe/H]i | ||
| CNB | 0.040 | 1.215 | ||||
| H+K | 0.159 | 1.147 | ||||
| CNR | 0.273 | 1.608 | ||||
| CH=Gband | 0.139 | 1.104 | ||||
| H | ||||||
| MgH | 0.223 | 1.401 | ||||
| MgG | ||||||
| Mg2 | 0.402 | 2.275 | ||||
| Mgb | ||||||
| Fe52 | 0.146 | 0.955 | ||||
| [Fe/H] | dex | dex | ||||
Note. — Abundances measured with the Lick/IDS passbands defined by Brodie & Huchra (1990). The line strengths are given in mag. With the metallicity calibrations of Brodie & Huchra we derive for the -th absorption line an individual metallicity [Fe/H]i. According to the statistical significance of each individual metallicity indicator its weighting is given. The weighted mean metallicity of each globular cluster and of the entire GCS (indicated as ) is given at the bottom line. Lines which were found to be very poor or redundant metallicity indicators (Brodie & Huchra, 1990) have no weighting assigned and are excluded from the averaging process. The errors include both Poisson flux uncertainties and metallicity-calibration errors.
| cluster | [Fe/H]spec | [Fe/H]phot |
|---|---|---|
| D7 | 0.23 | 0.20 |
| D14 | 0.39 | 0.20 |
| D15 | 0.20 | 0.20 |
| D25 | 0.37 | 0.30 |
| D46 | 0.82 | 0.45 |
| L1 | 0.19 | |
| L63 | 0.81 | |
| [Fe/H] | [Fe/H] |
Note. — The spectroscopical mean metallicity was obtained from the mean spectrum of 7 globular clusters. Exactly the same values can be calculated by weighted averaging of individual globular cluster metallicities. The photometric mean metallicity is a weighted mean of the above values. The error of [Fe/H] includes only the photometric uncertainty of the color. It does not include the error of the color-metallicity calibration (c.f. equation 1).
| Label | RAaaBoth RA and Dec have an accuracy of (RA, Dec)″. The center of NGC 3115 DW1 has the coordinates RA and Dec. | DecaaBoth RA and Dec have an accuracy of (RA, Dec)″. The center of NGC 3115 DW1 has the coordinates RA and Dec. | bbAll magnitudes were taken from Durrell et al. (1996b). | cc in was obtained from Durrell et al. (1996b) while the magnitude was taken from our HST photometry. Note that the color suffers large uncertainty due to low S/N of the F814W images. The color is not corrected for galactic extinction and has to be de-reddened (E mag (Schlegel et al., 1998); EE(B-V) (Dean et al., 1978) yields E mag). | dd was obtained from Durrell et al. (1996b). | eeProjected radial distance to the center of NGC 3115 DW1. | eeProjected radial distance to the center of NGC 3115 DW1. | ffMean radial velocity calculated from cross-correlations and line shifts. | ||
|---|---|---|---|---|---|---|---|---|---|---|
| [deg] (J2000) | [deg] (J2000) | [mag] | [mag] | [mag] | [″] | [pc] | [km s-1] | |||
| mask A | ||||||||||
| L15 | 151.46547275 | 8.02573829 | 215.2 | 11474 | 70407 | 106 | ||||
| L3 | 151.44513389 | 8.03275119 | 197.4 | 10525 | 69 | 57 | ||||
| L27 | 151.45595107 | 8.01588459 | 166.1 | 8856 | 25235 | 105 | ||||
| L11 | 151.47453033 | 8.00005692 | 190.1 | 10139 | 84 | 58 | ||||
| L18 | 151.45373013 | 8.00788268 | 21.65 0.05 | 0.74 0.06 | 140.2 | 7475 | 199 | 42 | ||
| L7 | 151.43413151 | 8.01463921 | 122.8 | 6549 | 60 | 81 | ||||
| L16 | 151.43857103 | 8.00897480 | 109.7 | 5850 | 196 | 85 | ||||
| D8 | 151.44176680 | 8.00230439 | 21.70 0.02 | 1.47 0.06 | 96.0 | 5117 | 86 | 59 | ||
| D21 | 151.42597410 | 8.00187100 | 21.64 0.03 | 1.37 0.06 | 0.70 0.04 | 72.1 | 3845 | |||
| D10 | 151.45237834 | 7.98267887 | 20.97 0.02 | 1.10 0.03 | 99.6 | 5312 | 110 | 39 | ||
| D58 | 151.43598000 | 7.99663820 | 23.22 0.11 | 2.09 0.10 | 1.09 0.18 | 67.1 | 3579 | 8766 | 89 | |
| D73 | 151.43584940 | 7.98355023 | 23.38 0.09 | 0.64 0.15 | 41.1 | 2190 | 5015 | 128 | ||
| D20 | 151.42182290 | 7.98467580 | 21.72 0.04 | 1.55 0.15 | 0.65 0.06 | 13.7 | 731 | 22562 | 103 | |
| D24 | 151.43774990 | 7.97262110 | 21.78 0.04 | 1.28 0.07 | 0.67 0.07 | 58.0 | 3093 | 157 | 112 | |
| D14 | 151.42099595 | 7.97540485 | 21.34 0.03 | 0.90 0.04 | 26.4 | 1409 | 468 | 71 | ||
| D6 | 151.43119970 | 7.96549650 | 20.28 0.02 | 1.58 0.03 | 0.50 0.03 | 63.8 | 3401 | 24 | 32 | |
| D1 | 151.40556550 | 7.97613822 | 18.85 0.01 | 0.73 0.01 | 70.5 | 3757 | 147 | 39 | ||
| D5 | 151.41731295 | 7.96373779 | 20.32 0.01 | 0.60 0.02 | 70.2 | 3742 | 131 | 36 | ||
| L37 | 151.42092628 | 7.95714247 | 90.0 | 4800 | 24560 | 102 | ||||
| L44 | 151.43991405 | 7.94358566 | 148.5 | 7922 | 22998 | 108 | ||||
| L14 | 151.43728995 | 7.93698967 | 168.0 | 8961 | 52 | 53 | ||||
| L51 | 151.42385948 | 7.93980723 | 151.5 | 8082 | 47 | 96 | ||||
| L1 | 151.41836728 | 7.93746430 | 161.4 | 8609 | 420 | 29 | ||||
| L63 | 151.40348832 | 7.93354949 | 189.4 | 10102 | 605 | 74 | ||||
| mask B | ||||||||||
| L8 | 151.42908177 | 8.03330443 | 185.8 | 9908 | 99444 | 65 | ||||
| L4 | 151.45874258 | 8.02204502 | 189.3 | 10095 | 49 | 60 | ||||
| L6 | 151.43119125 | 8.02568813 | 159.5 | 8504 | ||||||
| L23 | 151.44361588 | 8.01586187 | 140.1 | 7469 | 293 | 106 | ||||
| D9 | 151.43313299 | 8.00698070 | 21.63 0.02 | 1.52 0.06 | 95.5 | 5090 | 24 | 61 | ||
| D36 | 151.44962050 | 7.99643065 | 22.86 0.07 | 1.70 0.17 | 103.9 | 5539 | 4 | 73 | ||
| D26 | 151.44384880 | 7.98342710 | 22.49 0.07 | 1.25 0.11 | 1.43 0.13 | 69.4 | 3700 | 2567 | 109 | |
| D2 | 151.43874410 | 7.99131620 | 20.32 0.02 | 2.69 0.04 | 1.60 0.03 | 61.2 | 3264 | 11 | 59 | |
| D25 | 151.43899620 | 7.98802330 | 21.78 0.04 | 1.27 0.07 | 0.69 0.06 | 56.3 | 3005 | 532 | 60 | |
| D46 | 151.42821583 | 7.98176333 | 22.53 0.05 | 0.74 0.09 | 13.4 | 716 | 623 | 106 | ||
| D3 | 151.44378760 | 7.97441980 | 20.74 0.02 | 3.32 0.03 | 1.53 0.04 | 74.0 | 3947 | 5 | 56 | |
| D15 | 151.43225130 | 7.97337860 | 21.30 0.02 | 1.52 0.05 | 0.80 0.04 | 41.4 | 2208 | 681 | 30 | |
| D7 | 151.41813758 | 7.97210601 | 20.53 0.03 | 0.89 0.04 | 41.8 | 2231 | 703 | 25 | ||
| D42 | 151.44129540 | 7.96256740 | 22.79 0.07 | 1.56 0.10 | 1.63 0.18 | 91.9 | 4902 | 58100 | 123 | |
| L36 | 151.45635892 | 7.95500702 | 149.4 | 7966 | 26386 | 96 | ||||
| D41 | 151.40979676 | 7.96307913 | 22.19 0.04 | 0.49 0.06 | 85.6 | 4563 | 308 | 45 | ||
| L37 | 151.42092628 | 7.95714247 | 90.0 | 4800 | 31100 | 82 | ||||
| L26 | 151.44282349 | 7.94889087 | 135.7 | 7236 | 22895 | 168 | ||||
| L39 | 151.42936599 | 7.94366459 | 138.8 | 7400 | 24184 | 146 | ||||
| L52 | 151.41051686 | 7.94476283 | 142.6 | 7606 | 139 | 122 | ||||
| L17 | 151.45223278 | 7.92867126 | 215.7 | 11504 | 131658 | 51 | ||||
| L38 | 151.42761022 | 7.93031858 | 186.0 | 9921 | 24735 | 89 | ||||